Alamos Gold Breaks Above 200-Day Moving Average
Shares of Alamos Gold Inc. (AGI) crossed above their key 200-day moving average of $38.91 on Tuesday, trading as high as $39.10 and signaling potential technical strength.

Ibex73 / Wikimedia Commons (CC BY 4.0)
Shares of Alamos Gold Inc. (AGI) crossed a significant technical threshold on Tuesday, trading above their 200-day moving average. The stock reached an intraday high of $39.10, surpassing the average price of $38.91. This move coincided with a gain of approximately 1.7% for the session.
The 200-day moving average is a widely monitored long-term trend indicator in technical analysis. A sustained break above this level is often interpreted by chartists as a bullish signal, suggesting the underlying trend may be shifting from negative or neutral to positive. For Alamos Gold, this crossover occurs after a period where the stock has traded below this key average.
Technical Significance of the Breakout
The crossing represents a potential inflection point for the miner's stock. Technical analysts view the 200-day line as a dividing line between long-term bullish and bearish territory. A stock trading above its 200-day average is generally considered to be in a long-term uptrend, while trading below it suggests a downtrend.
This development does not guarantee future price appreciation but adds a positive data point for momentum-focused investors. The move will be closely watched to see if the stock can consolidate above this level, which would strengthen the technical case. A failure to hold above $38.91 could see the signal negated.
Context and Market Implications
Alamos Gold is a mid-tier gold producer with operating mines in North America. The breakout comes amid a mixed environment for precious metals, where gold prices face pressure from a strong U.S. dollar and higher interest rates, yet find support from geopolitical uncertainty and central bank buying.
For the gold mining sector, individual stock strength can sometimes precede broader moves, making technical breaks like this one noteworthy for sector watchers. The company's performance relative to the price of gold itself will also be a factor, as it reflects operational efficiency and market sentiment toward the specific miner.
Investors typically use such technical signals in conjunction with fundamental analysis of the company's production costs, reserve base, and financial health. The next key levels to watch will be the stock's ability to challenge recent highs and the volume supporting the price move, which confirms the strength of the breakout.
This article is not investment advice and recommends no asset, level or direction; a single session's move is not evidence of a trend. For background see Markets, Bear Market, BIST 100, and for terms the finance glossary.
Sources
Related News

McEwen shares cross above 200-day average
McEwen Inc. stock moved above its 200-day moving average on Friday and traded as high as $21.07, with the shares up about 3.6% in afternoon trading.

Commercial Metals falls below 200-day average
Commercial Metals Co. shares slipped below their 200-day moving average on Wednesday, with the stock trading as low as $66.13 and down about 5% on the session.
Agnico Eagle falls below its 200-day average
Agnico Eagle Mines slipped under its 200-day moving average on Thursday, trading as low as $178 and roughly 3% lower on the session.
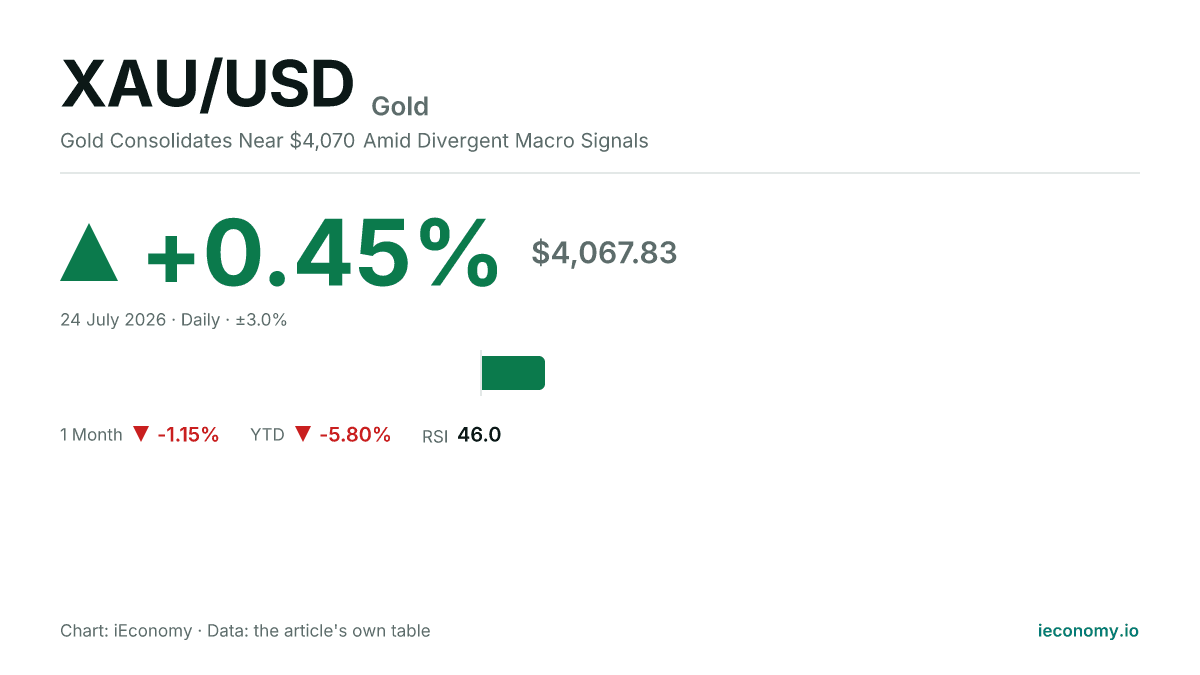
Gold Consolidates Near $4,070 Amid Divergent Macro Signals
Gold trades at $4,067.83, posting a modest daily gain but remains in negative territory for the month and year. With an RSI of 46.0 indicating neutral momentum, the metal is caught between structural support and a challenging macro backdrop of disinflation and shifting rate expectations.
AngloGold Ashanti Shares Move Above 200-Day Average
AngloGold Ashanti shares traded above their 200-day moving average, with the stock also rising sharply in Thursday and Friday trading sessions.
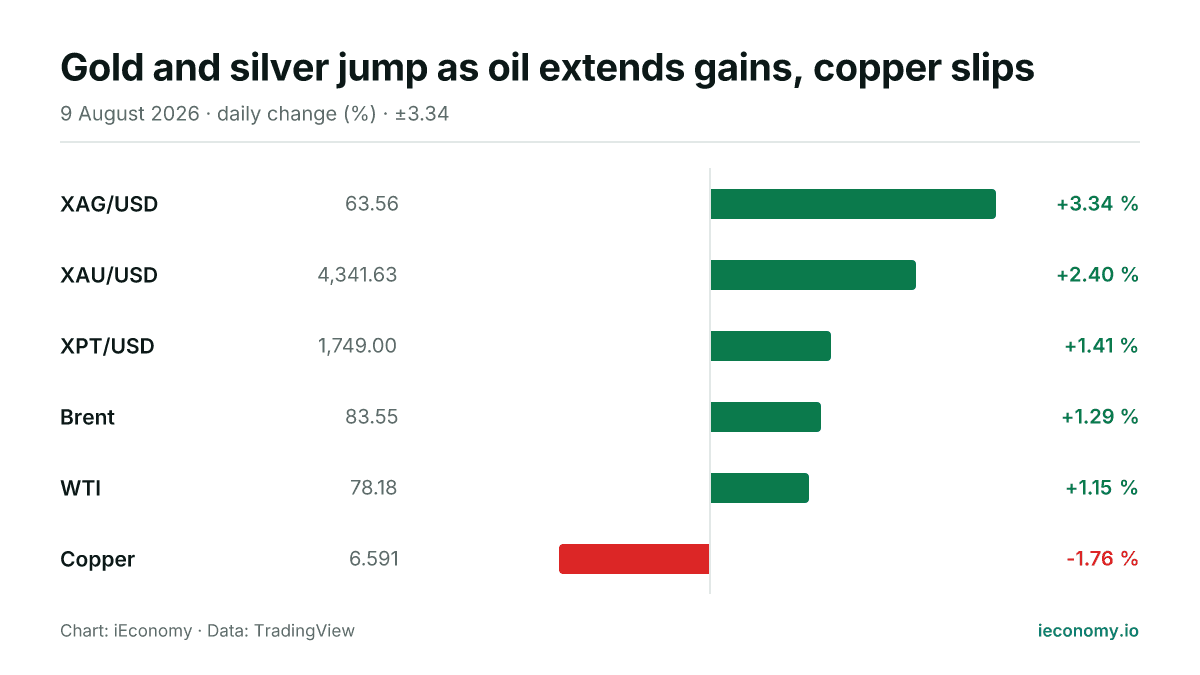
Gold and silver jump as oil extends gains, copper slips
Precious metals and crude were mostly higher on Sunday, with silver leading the advances and copper the only decliner. The moves were broad but uneven, leaving a mixed snapshot for commodity traders and investors.