Markets
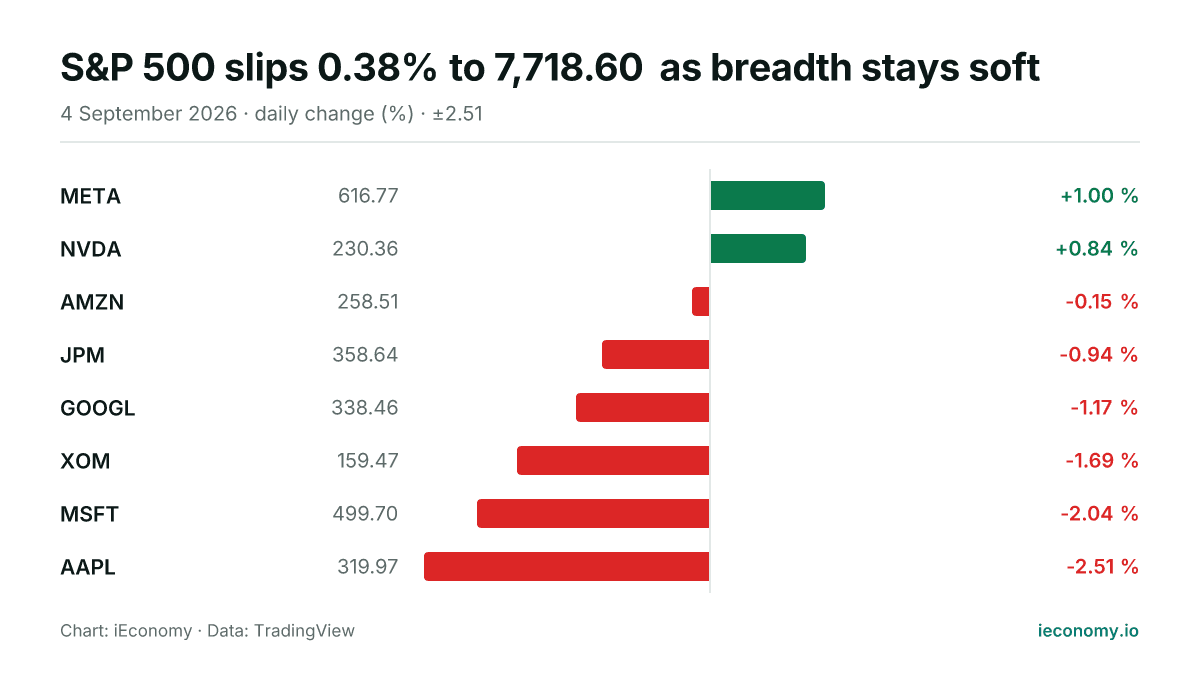
S&P 500 slips 0.38% to 7,718.60 as breadth stays soft
The S&P 500 finished Friday lower at 7,718.60, with six of the eight tracked constituents declining. META was the day’s best performer, while AAPL posted the steepest fall.

Crude oil slips as U.S.-Iran tensions ease
Oil prices edged lower after two days of gains as both Washington and Tehran held back from fresh attacks. Traders also took comfort from remarks suggesting major combat operations had ended.
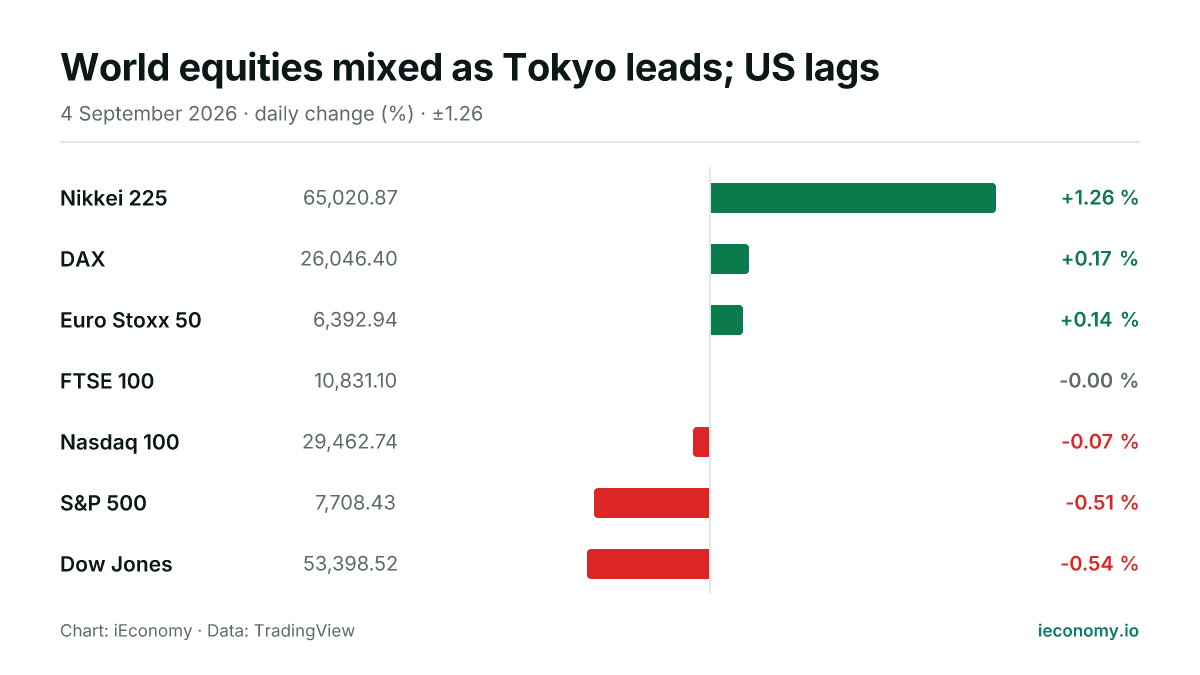
World equities mixed as Tokyo leads; US lags
Asian and European indices were mostly firmer on Friday, while US benchmarks finished lower in the digest. The move was uneven, with the Nikkei 225 the clear standout and the Dow Jones and S&P 500 among the weaker gauges.
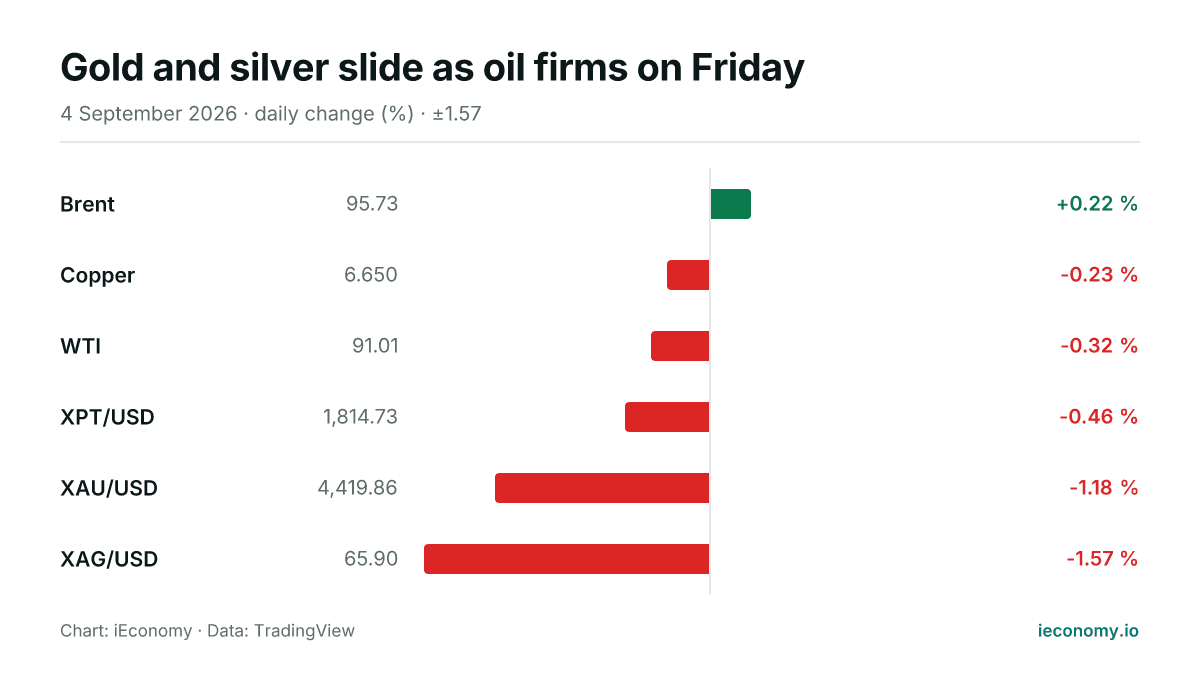
Gold and silver slide as oil firms on Friday
Gold and silver fell on Friday, while crude oil was mixed, with Brent higher and WTI lower. The move left five of six tracked markets down or flat, underscoring a broad but uneven drift.

Oil Steadies After Three-Day Rally on Strait Fears
Oil prices were little changed after a sharp three-day rise, as traders weighed renewed U.S.-Iran tensions around the Strait of Hormuz against signs that crude shipments were still moving.
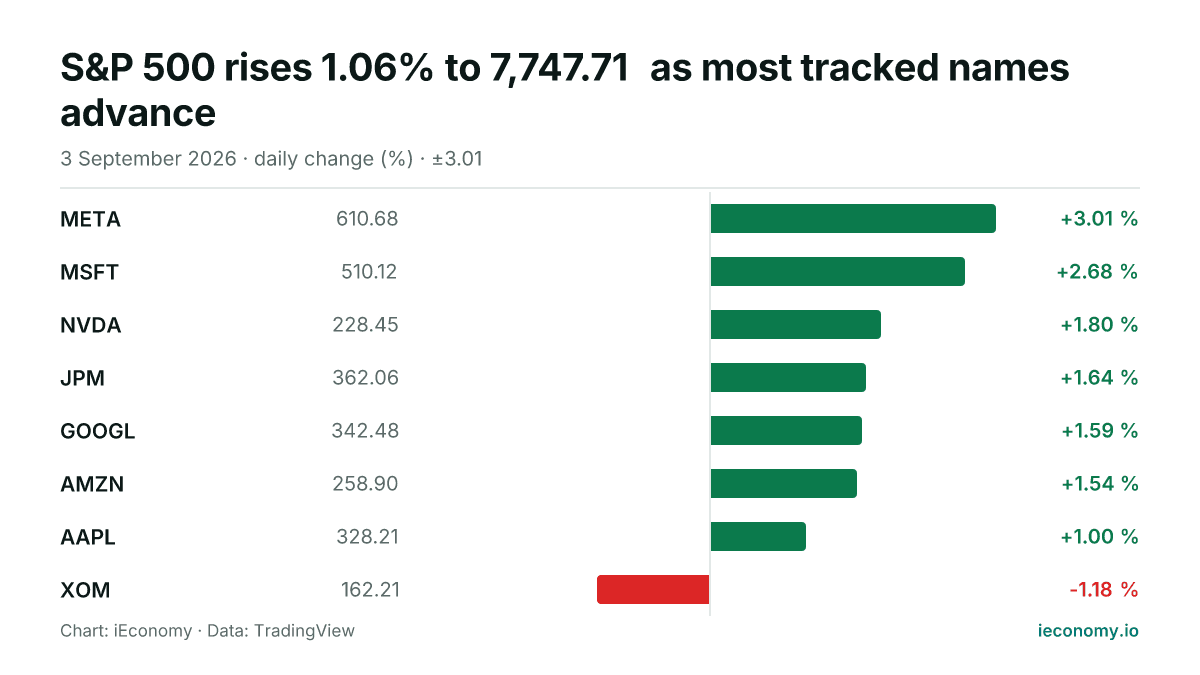
S&P 500 rises 1.06% to 7,747.71 as most tracked names advance
The S&P 500 finished Thursday higher, with 7 of 8 tracked constituents in positive territory. META was the strongest performer, while XOM was the only decliner among the names tracked in the digest.

Crude oil edges higher as Iran tensions keep markets tense
Oil prices rose modestly as renewed U.S.-Iran military action and threats around the Strait of Hormuz kept traders focused on potential supply disruption.
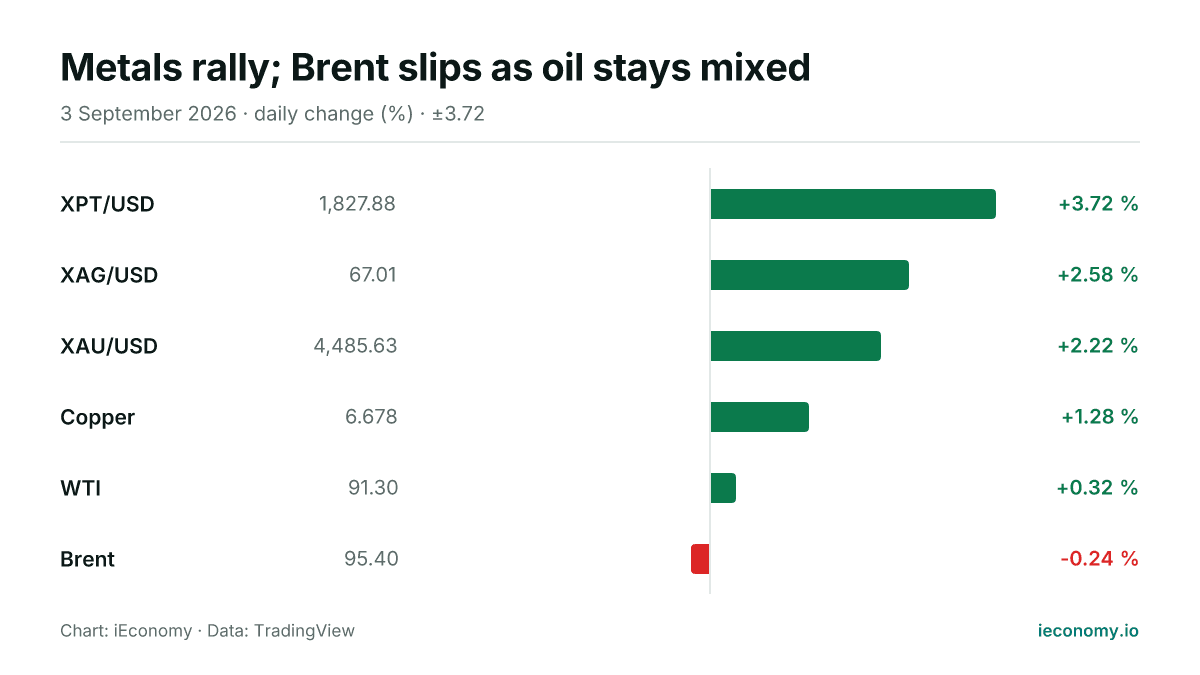
Metals rally; Brent slips as oil stays mixed
Gold, silver and platinum all advanced on Thursday, with silver leading the precious-metals move. WTI edged higher while Brent was slightly lower, leaving energy direction mixed and trade uneven.
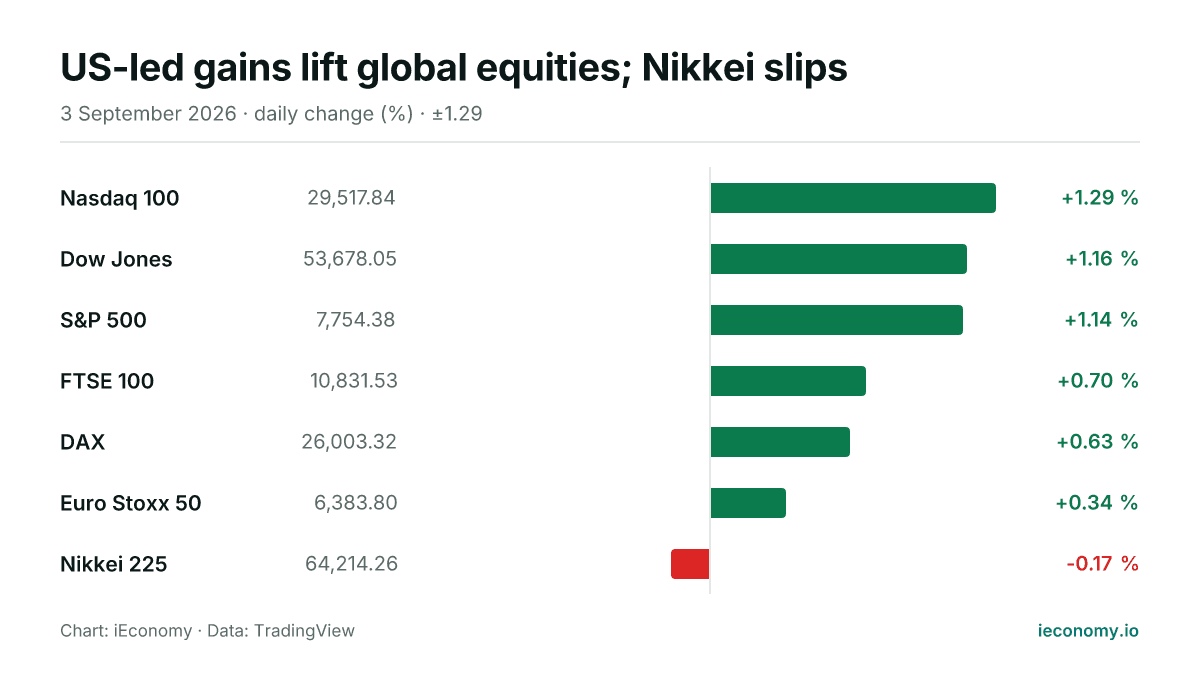
US-led gains lift global equities; Nikkei slips
US, European and Asian equities were mixed but broadly firmer on Thursday, with six of seven tracked benchmarks higher. The Nasdaq 100 led the advance, while the Nikkei 225 was the lone decliner.
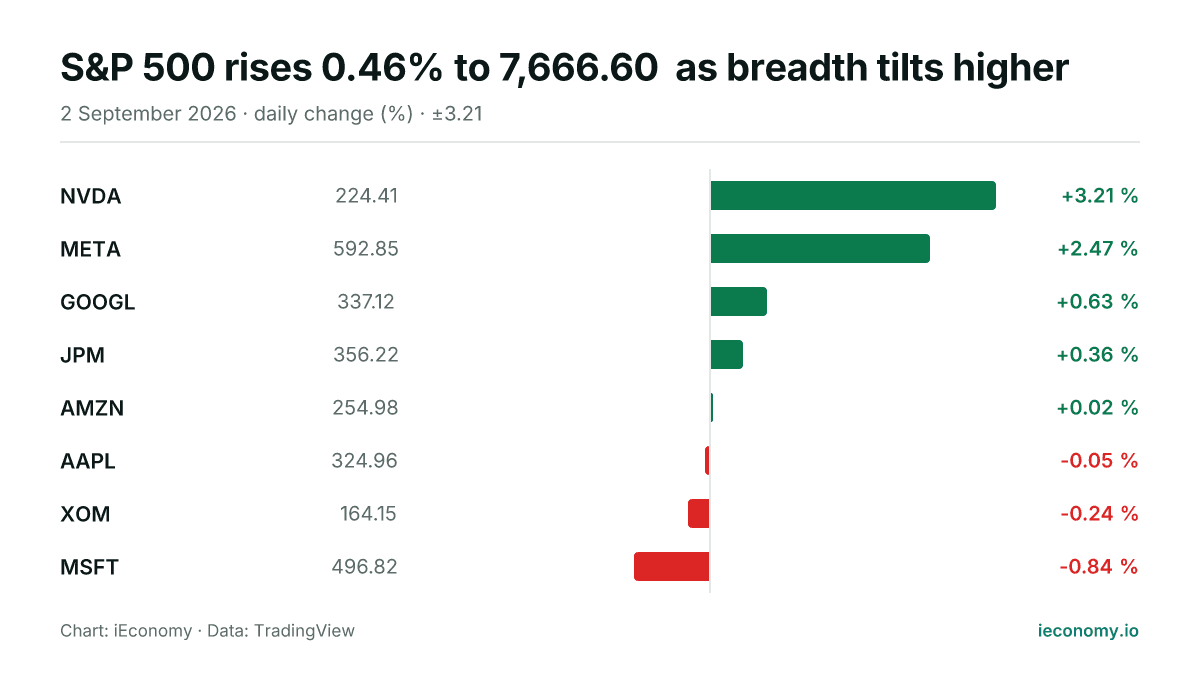
S&P 500 rises 0.46% to 7,666.60 as breadth tilts higher
The S&P 500 finished Wednesday at 7,666.60, up 0.46%, with five of eight tracked constituents advancing. NVIDIA was the strongest performer, while Microsoft lagged.
Crude Oil Rises as U.S.-Iran Tensions Shake Markets
Oil futures extended a two-day advance as fresh U.S. strikes on Iran and Tehran’s retaliation kept traders focused on supply risks tied to the Strait of Hormuz.
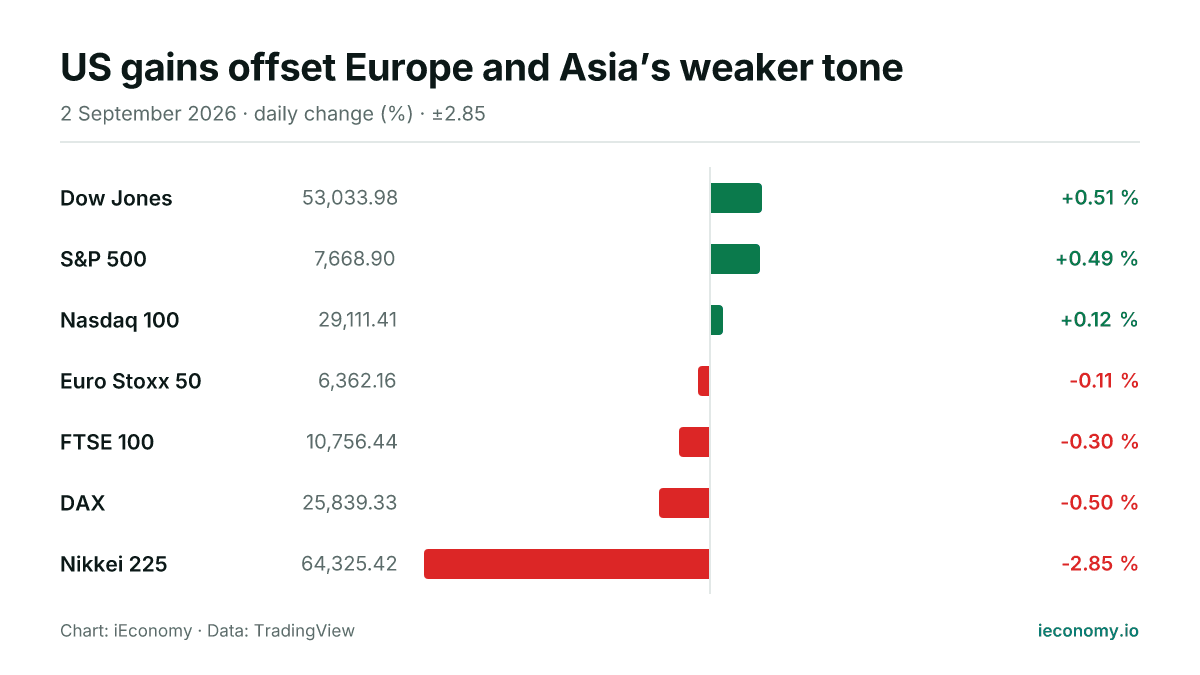
US gains offset Europe and Asia’s weaker tone
US equities advanced modestly while European benchmarks edged lower and Japan’s Nikkei 225 fell sharply. The day left three of seven tracked indices higher, with the strongest move still concentrated in Tokyo.
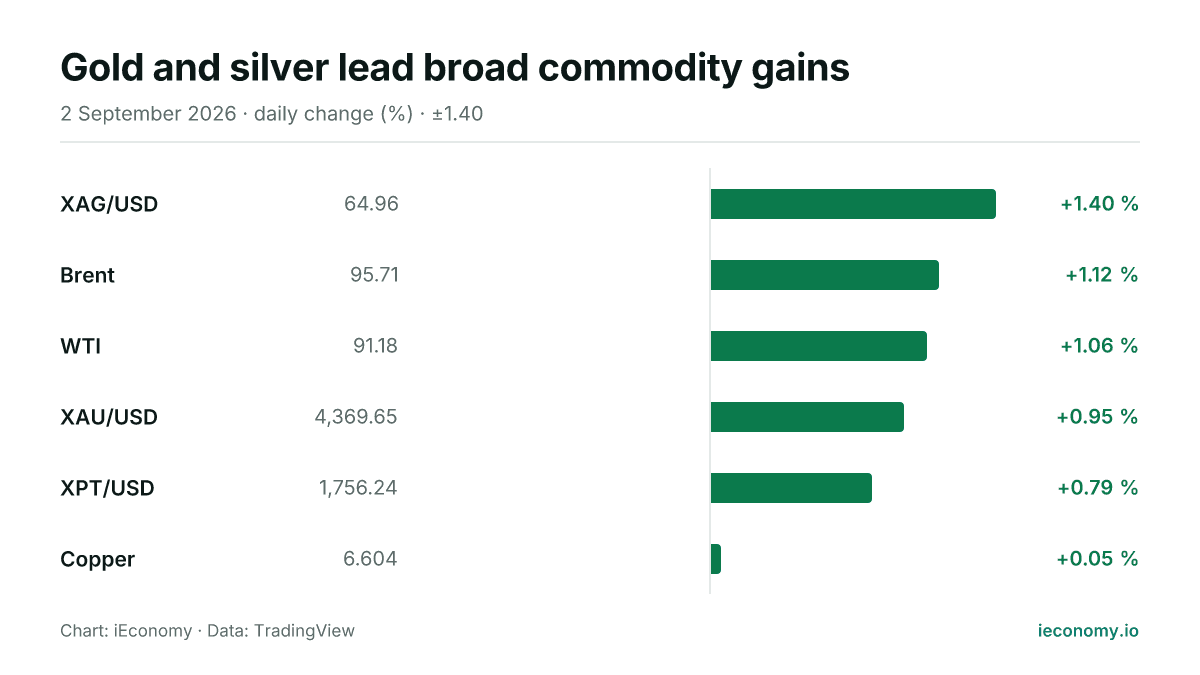
Gold and silver lead broad commodity gains
Gold, silver and crude oil were all higher on Wednesday, with every tracked commodity advancing. Silver led the complex, while copper lagged with only a marginal rise, underscoring a broad but uneven move.

Oil Holds Steady as U.S.-Iran Conflict Deepens
Crude prices were little changed after hitting multiweek highs, as renewed fighting between the U.S. and Iran kept the Strait of Hormuz in focus even as supply still moved through the route.

Treasuries Extend Slump as Oil Spike Pressures Bonds
U.S. government bonds fell for a fifth straight session as oil prices jumped more than 5% after fresh U.S. strikes on Iran-linked targets, lifting the 10-year yield to its highest close since October 2023.
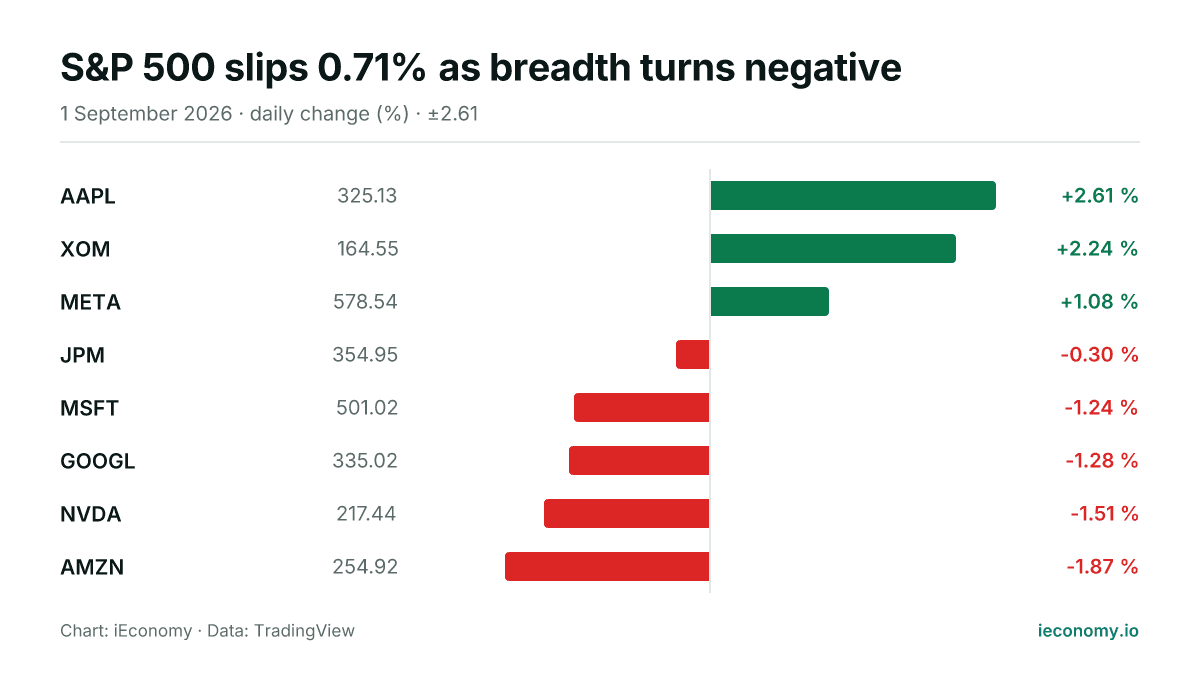
S&P 500 slips 0.71% as breadth turns negative
The S&P 500 finished the Tuesday session at 7,631.47, down 0.71%. Among eight tracked constituents, three rose and five fell, with Apple the strongest and Amazon the weakest.
August Review and Outlook: Treasury turns more active
Treasury expanded long-dated buybacks and other market interventions in August while the Federal Reserve kept rates unchanged despite hawkish messaging from Chair Kevin Warsh.
Crude oil jumps as U.S. expands strikes on Iran
Oil prices surged after Washington launched another round of strikes on Iran, reviving fears over Middle East supply risks and the Strait of Hormuz.
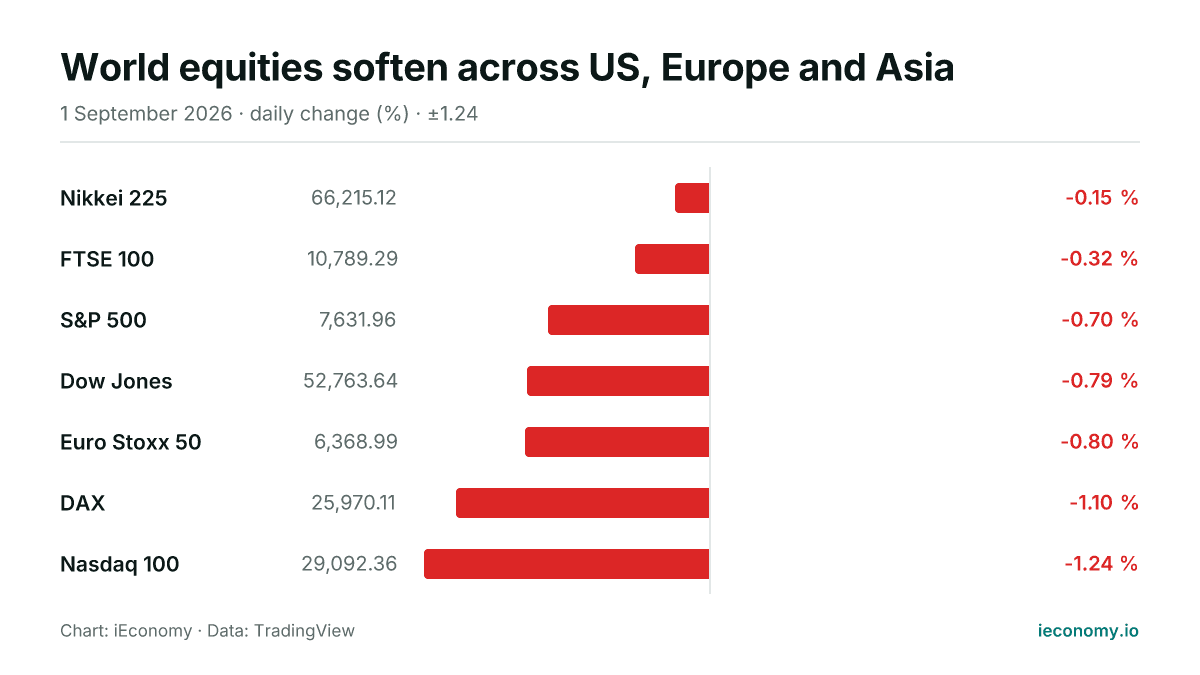
World equities soften across US, Europe and Asia
All seven tracked equity benchmarks were lower or flat on Tuesday, with US growth shares lagging and Europe also under pressure. The move was broad rather than concentrated, leaving no market in positive territory.
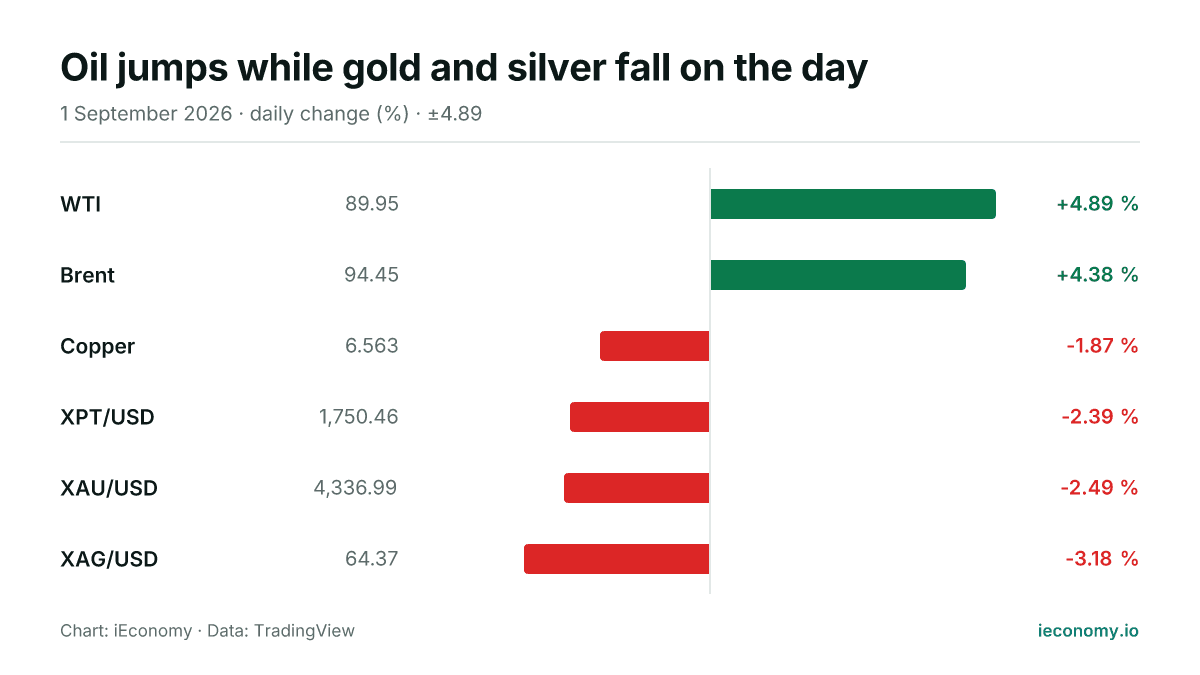
Oil jumps while gold and silver fall on the day
Crude oil rose sharply on Tuesday, while gold and silver retreated and copper also eased. The move left only two of six tracked commodities higher, underscoring a broad split in the day’s price action.
Oil Prices Jump on Mounting Strait of Hormuz Tensions
Oil climbed sharply as clashes between Washington and Tehran intensified, heightening fears of disruption in the Strait of Hormuz, a key route for global crude shipments.
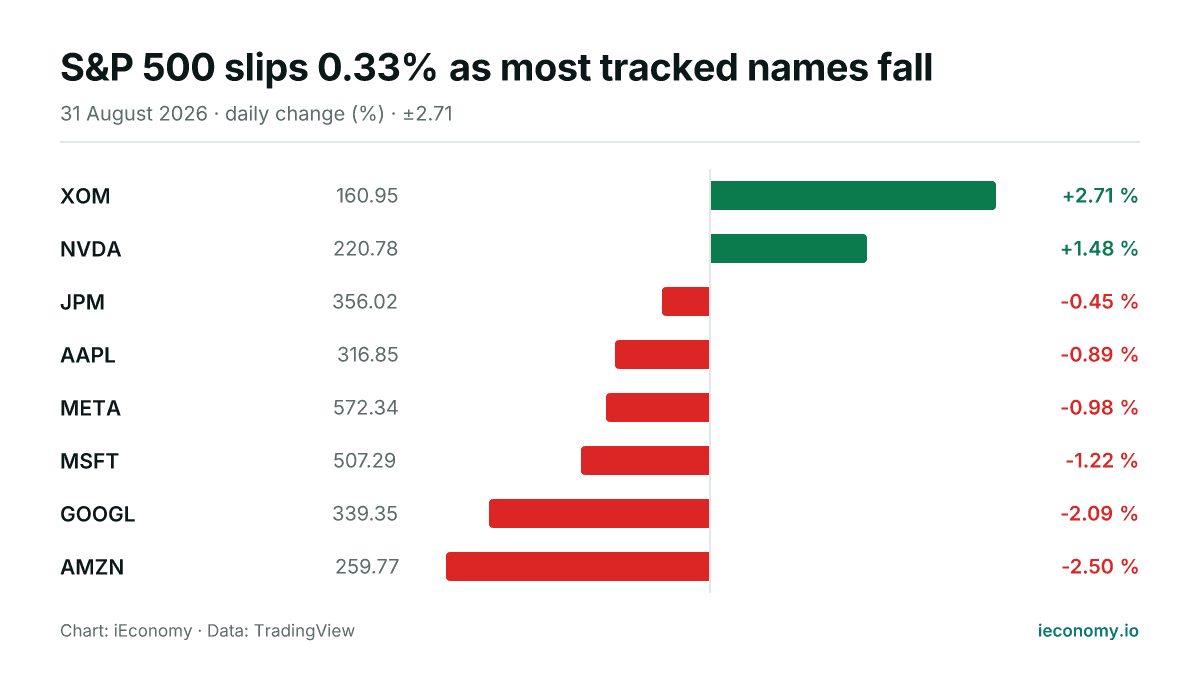
S&P 500 slips 0.33% as most tracked names fall
The S&P 500 ended Monday at 7,686.14, down 0.33% on the session. In the small set of tracked constituents, six fell and two rose, with Exxon Mobil the strongest and Amazon the weakest.
Crude oil jumps as Gulf conflict flares again
Oil prices rose sharply after renewed U.S. strikes on Iran and Iranian retaliation revived fears over the Strait of Hormuz and wider supply disruption in the Gulf.
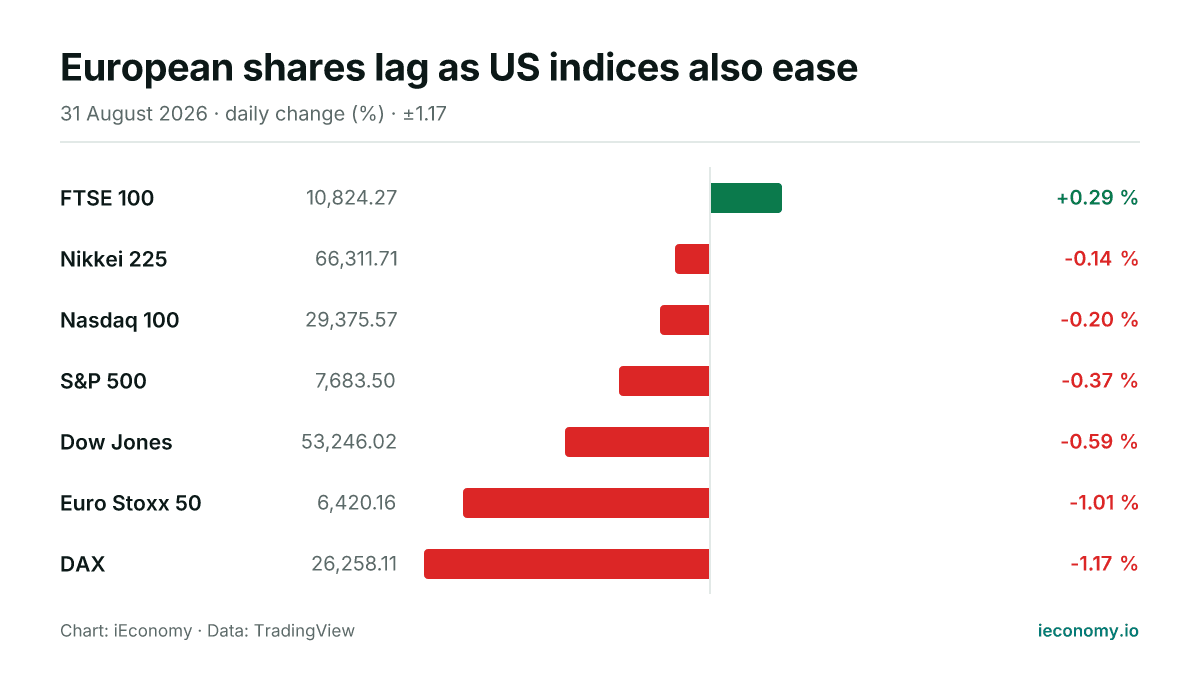
European shares lag as US indices also ease
World equity markets were mixed to weaker on Monday, with the FTSE 100 edging higher while most US, European and Asian benchmarks slipped. The DAX and Euro Stoxx 50 led declines, though moves remained modest in several cases.
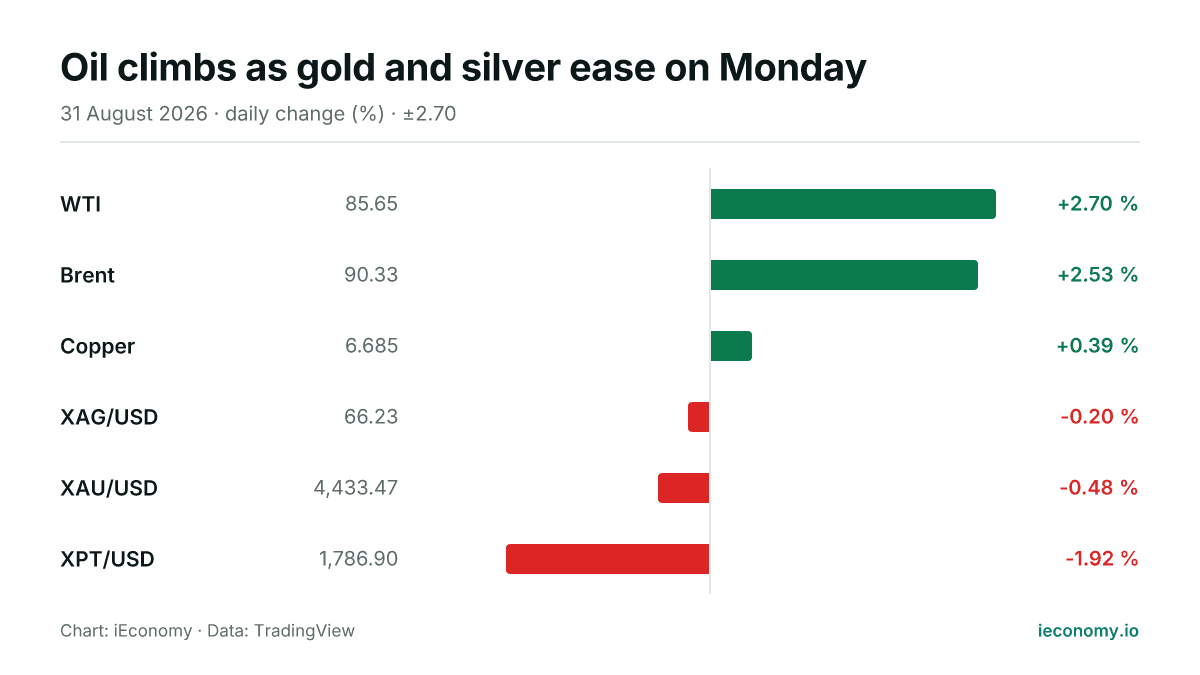
Oil climbs as gold and silver ease on Monday
Crude oil advanced on Monday while gold and silver slipped, leaving the complex mixed across the day. The moves were modest in bullion and sharper in energy, with copper also firmer.
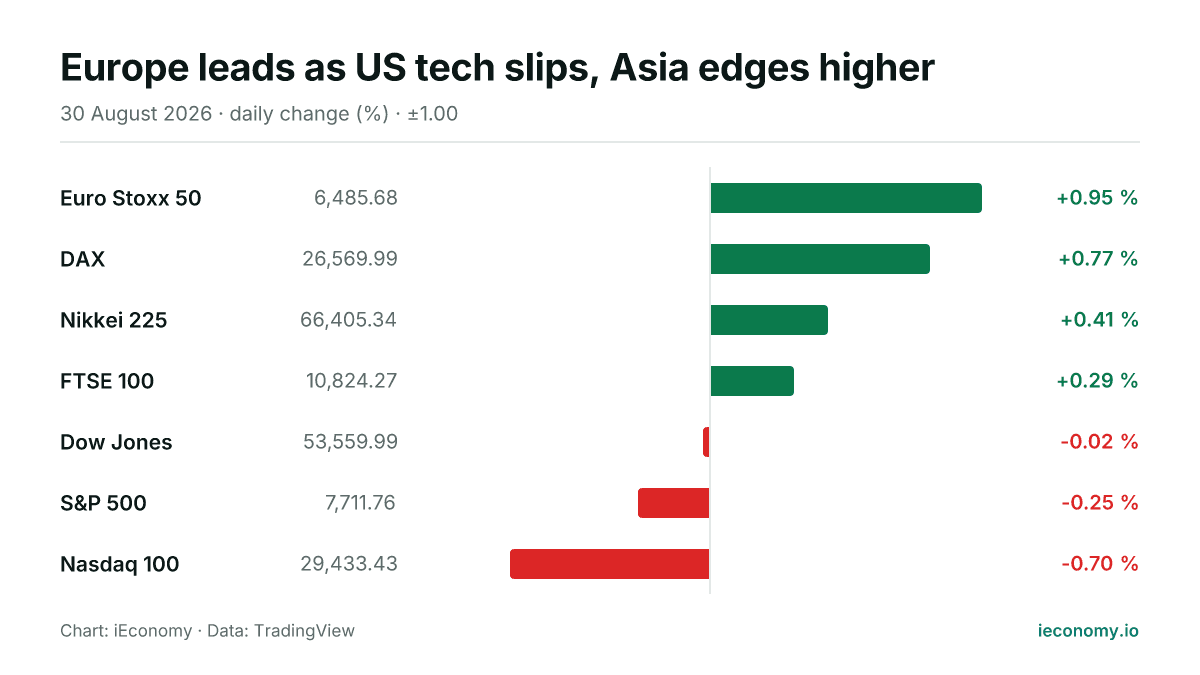
Europe leads as US tech slips, Asia edges higher
European benchmarks outperformed on Sunday, while Asian equities were firmer and the main US averages finished lower. The day’s moves were modest in some cases, but the spread between winners and laggards was clear.
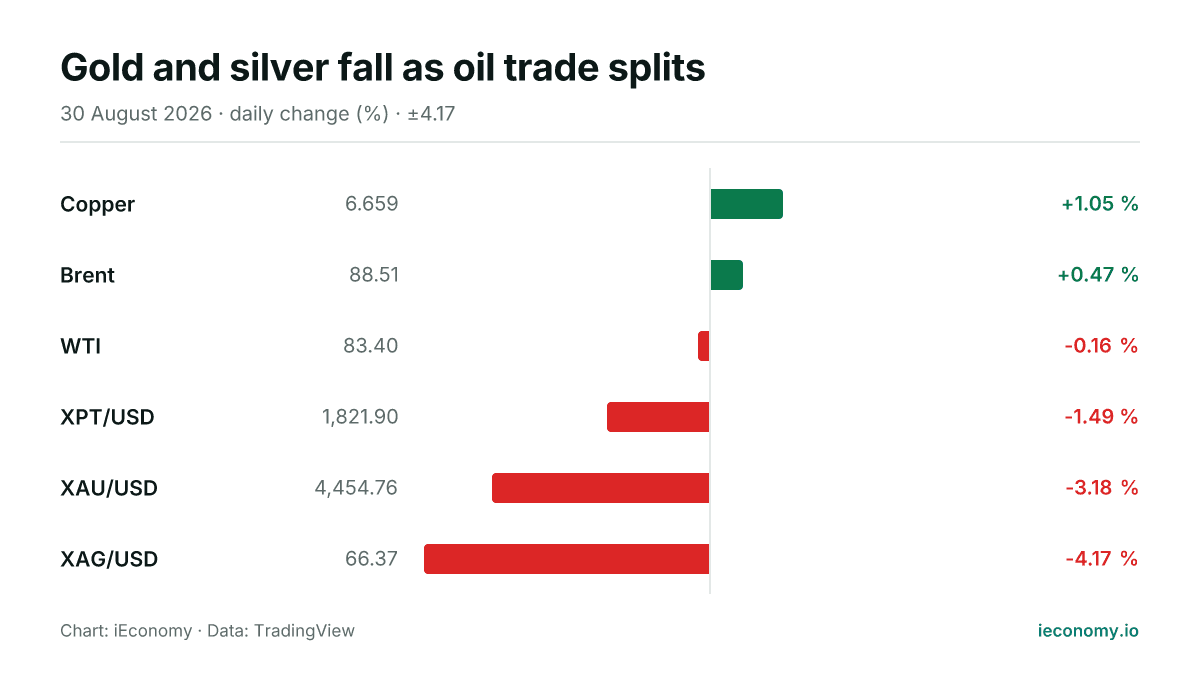
Gold and silver fall as oil trade splits
Gold and silver were weaker on Sunday, while Brent and copper held gains and WTI slipped. The day left the complex mixed, with moves driven by relative positioning rather than any disclosed catalyst.
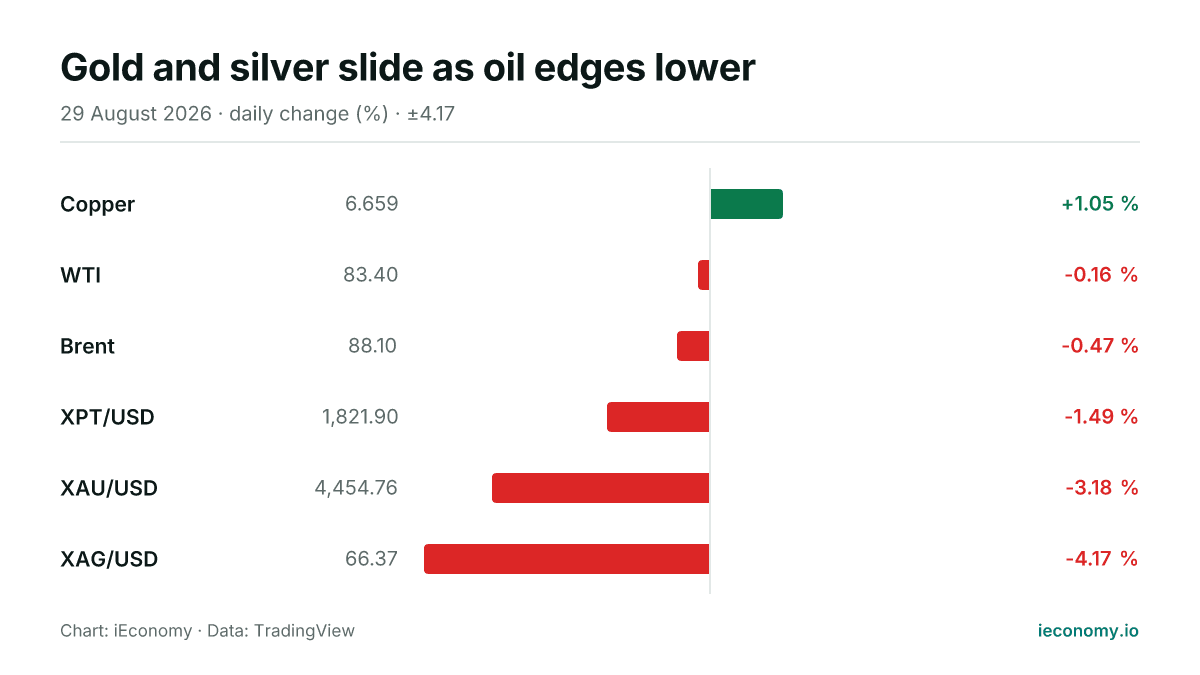
Gold and silver slide as oil edges lower
Commodities were mixed on Saturday, with gold and silver taking the heaviest losses while crude oil eased and copper was the only gainer. The day left six tracked markets mostly lower or flat, highlighting how quickly precious metals can move in percentage terms.
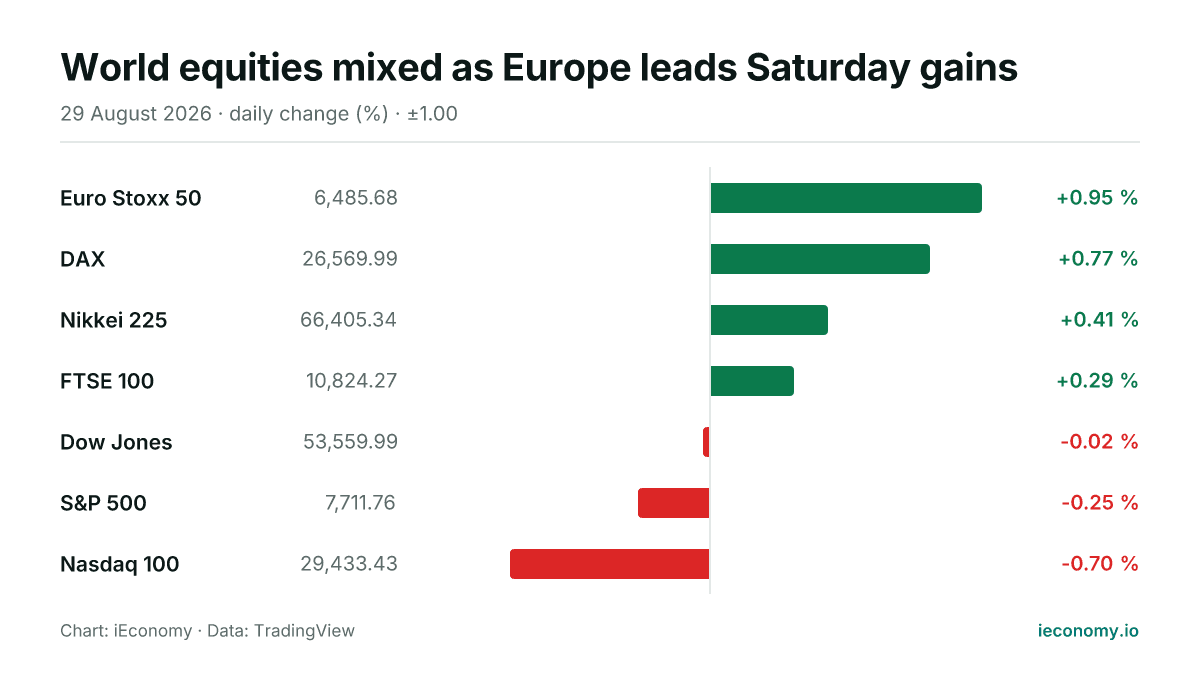
World equities mixed as Europe leads Saturday gains
European benchmarks outperformed on Saturday, with the Euro Stoxx 50 and DAX posting the strongest advances. US indices were softer, while Asian equities were also firmer, led by the Nikkei 225.
Crude oil eases as U.S.-Iran tension keeps market wary
Oil prices slipped after a sharp jump a day earlier, even as Washington said no talks with Tehran were planned and kept pressure on Iran through economic measures.
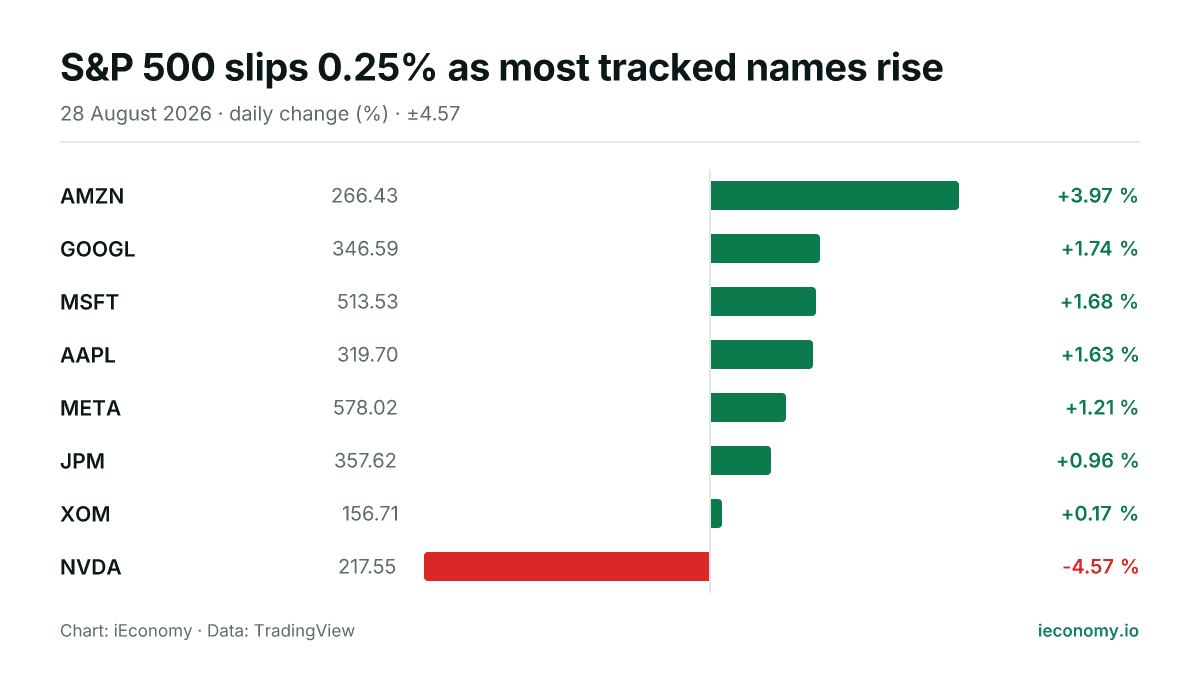
S&P 500 slips 0.25% as most tracked names rise
The S&P 500 finished Friday at 7,711.76, down 0.25% on the day. Breadth was positive among the tracked constituents, but a sharp fall in NVDA offset gains elsewhere.
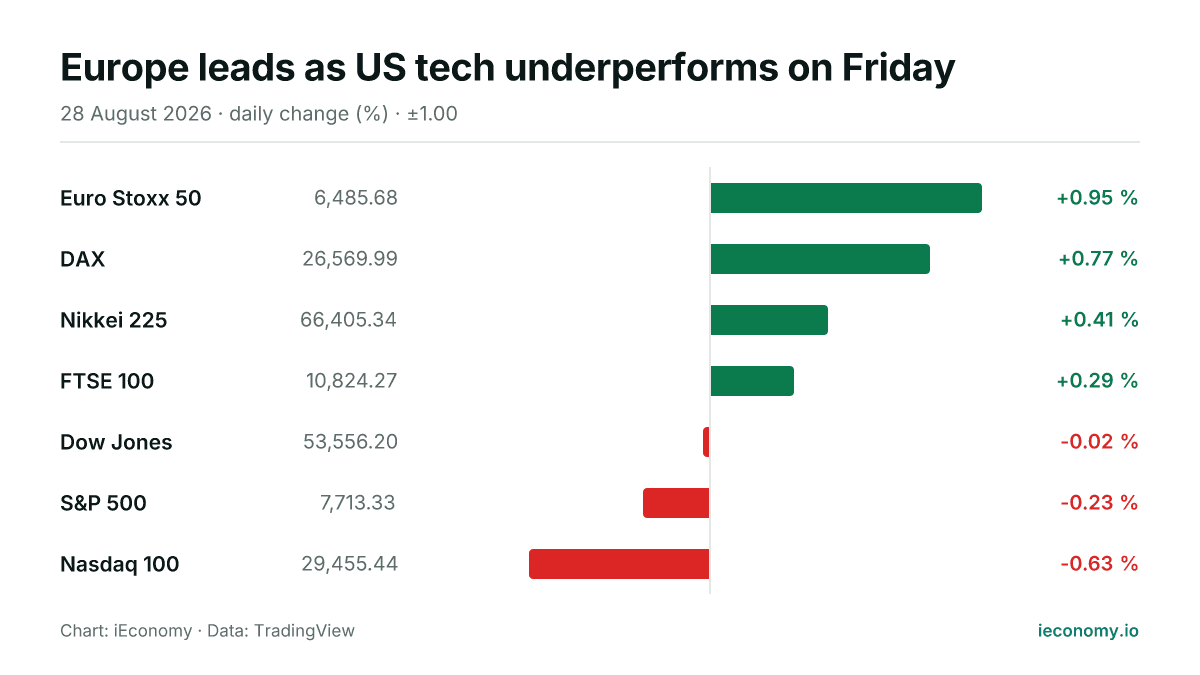
Europe leads as US tech underperforms on Friday
European and Asian benchmarks advanced on Friday, while the main US averages were mixed to weaker. The day’s moves were modest in the US and broader in Europe, leaving regional performance uneven.
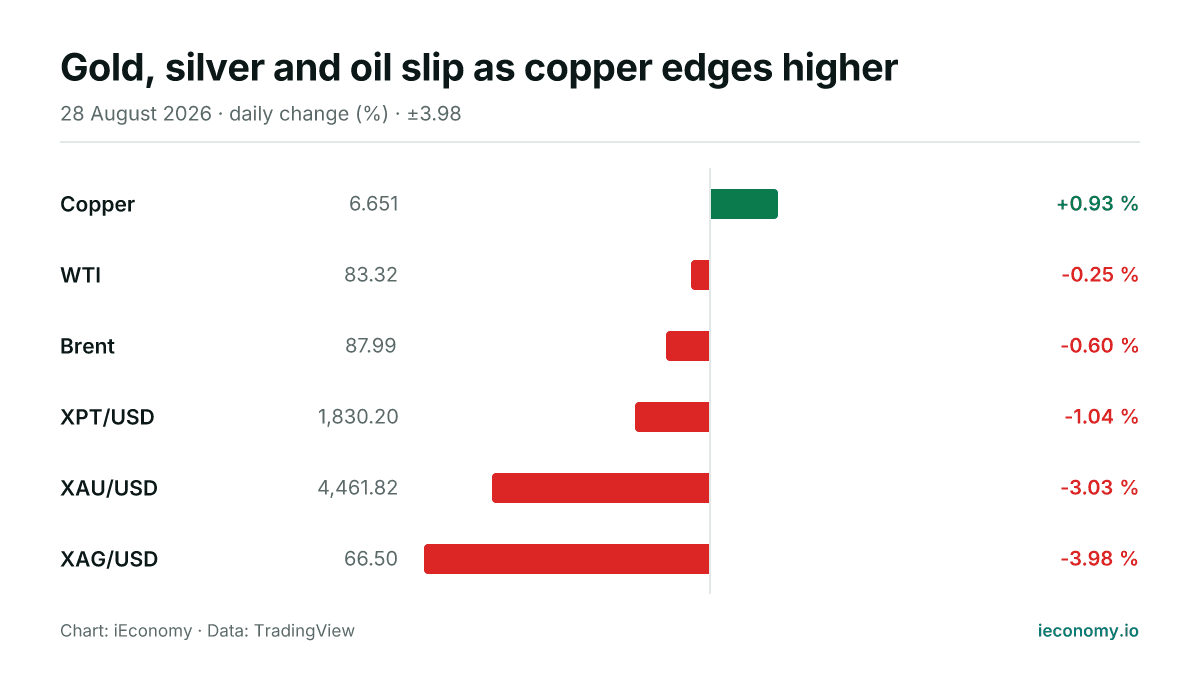
Gold, silver and oil slip as copper edges higher
On Friday, gold and silver led losses in the tracked commodity set while crude oil also eased and copper was the only gainer. The move left five of six instruments lower or flat, with the heaviest declines in precious metals.
Oil heads for weekly loss as Hormuz supply outlook improves
Oil prices were subdued on Friday and headed for a weekly loss as signs of more crude moving through the Strait of Hormuz eased supply fears, even as diplomacy remained uncertain.
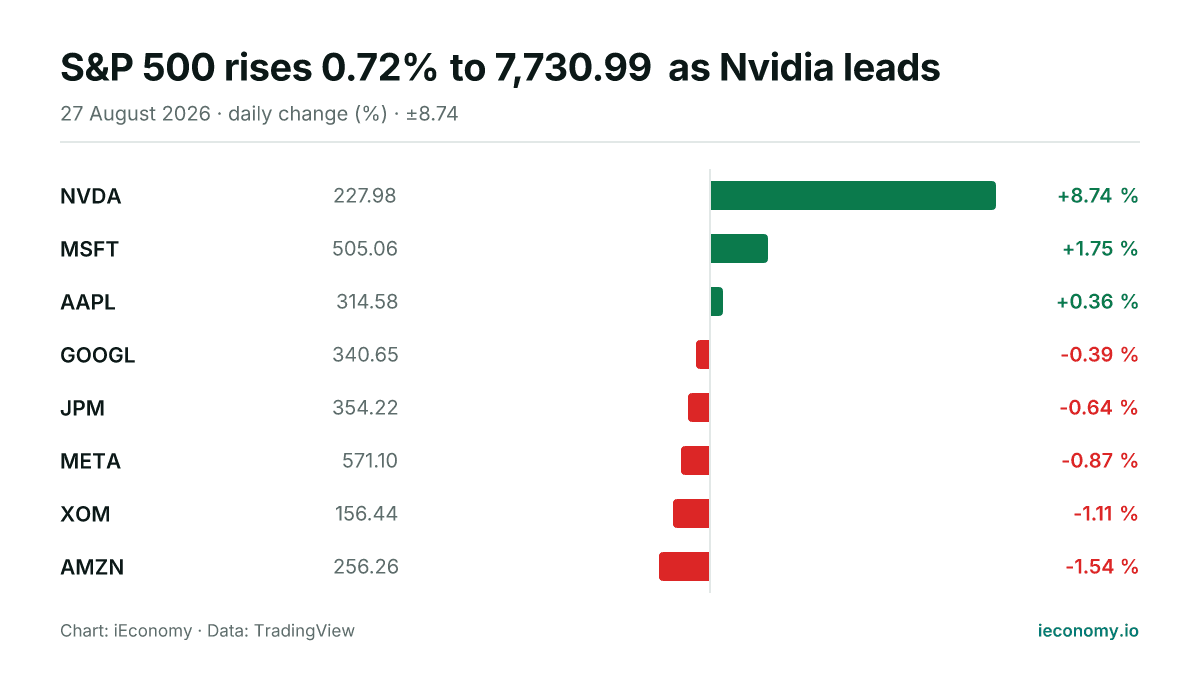
S&P 500 rises 0.72% to 7,730.99 as Nvidia leads
The S&P 500 advanced on Thursday, with a narrow majority of tracked constituents higher. Nvidia was the strongest performer, while Amazon lagged the group.
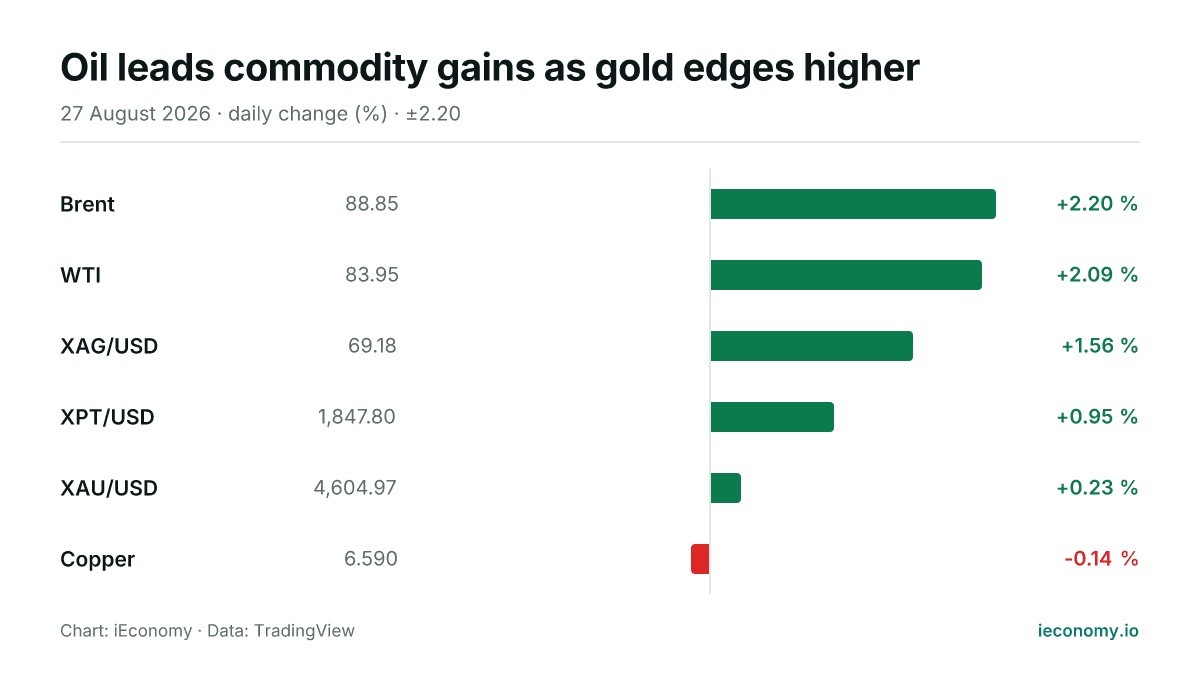
Oil leads commodity gains as gold edges higher
Crude oil outpaced the broader commodity board on Thursday, while silver and platinum also advanced. Gold rose more modestly and copper was the only tracked market to finish lower.
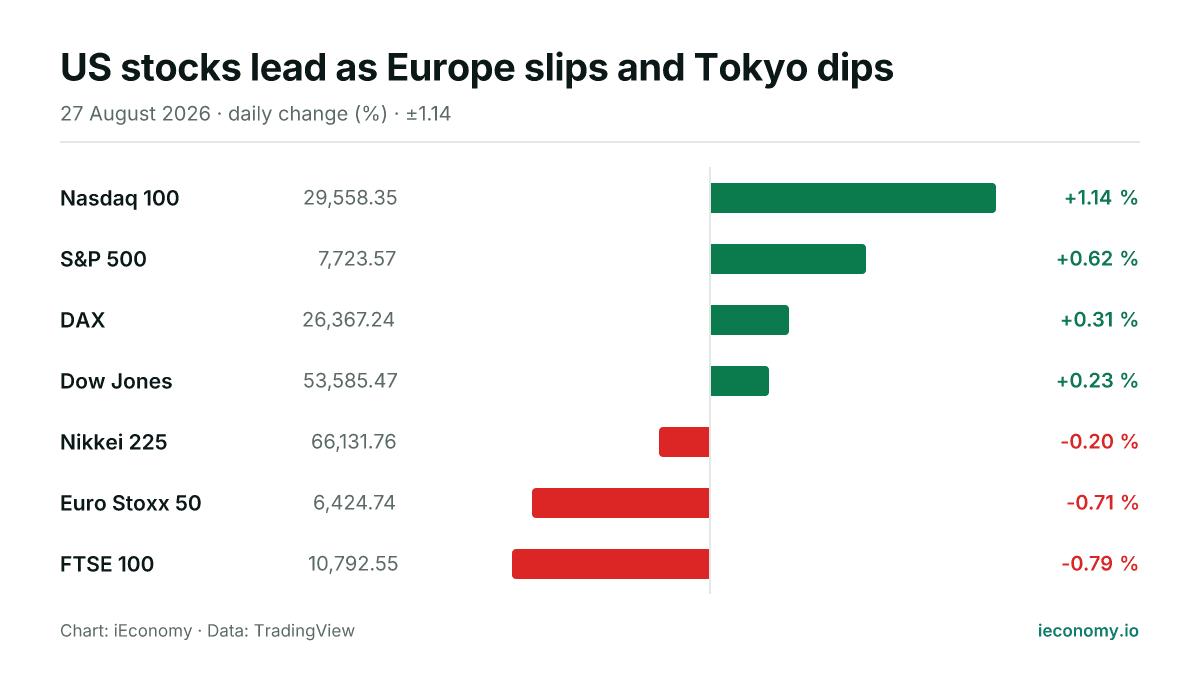
US stocks lead as Europe slips and Tokyo dips
US benchmarks were higher in Thursday trading, with the Nasdaq 100 leading gains. European indices were mixed to softer and the Nikkei 225 edged lower, leaving a split global session.
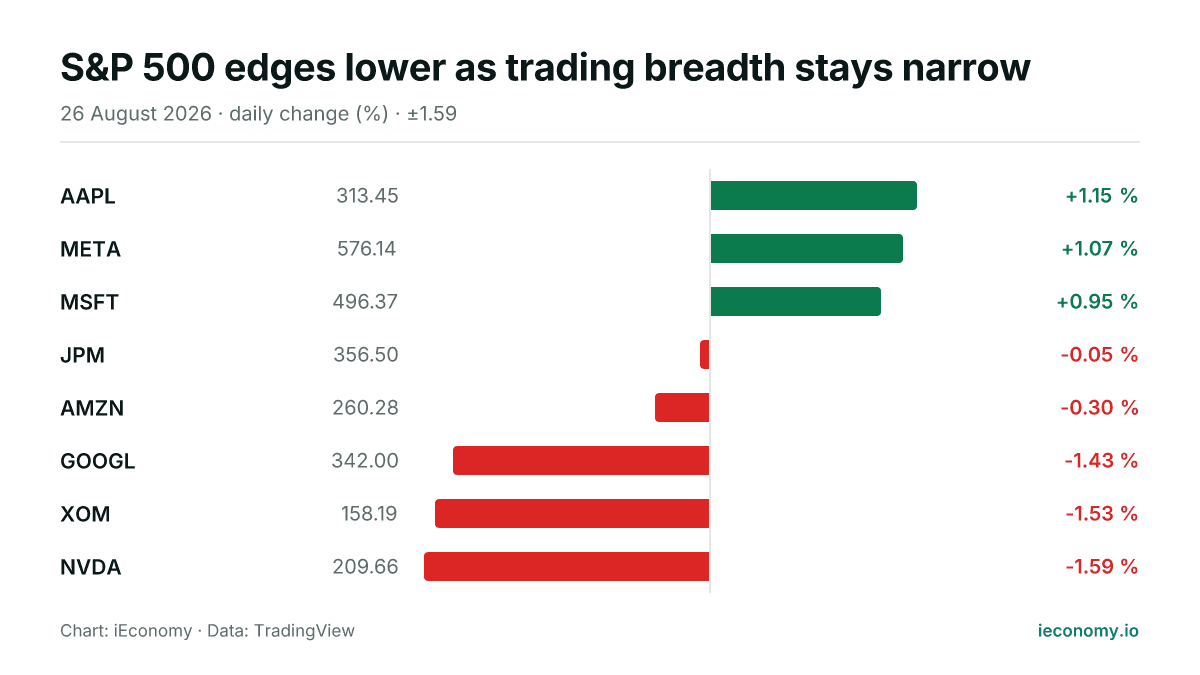
S&P 500 edges lower as trading breadth stays narrow
The S&P 500 ended Wednesday at 7,675.70, down 0.02% as five of the eight tracked constituents fell and three rose. Apple was the strongest performer, while Nvidia was the weakest.
Crude Oil Slides on Strait of Hormuz Transit Deal
Oil prices edged lower after reports that Iran and Oman are nearing a temporary shipping arrangement through the Strait of Hormuz, easing some immediate supply concerns.
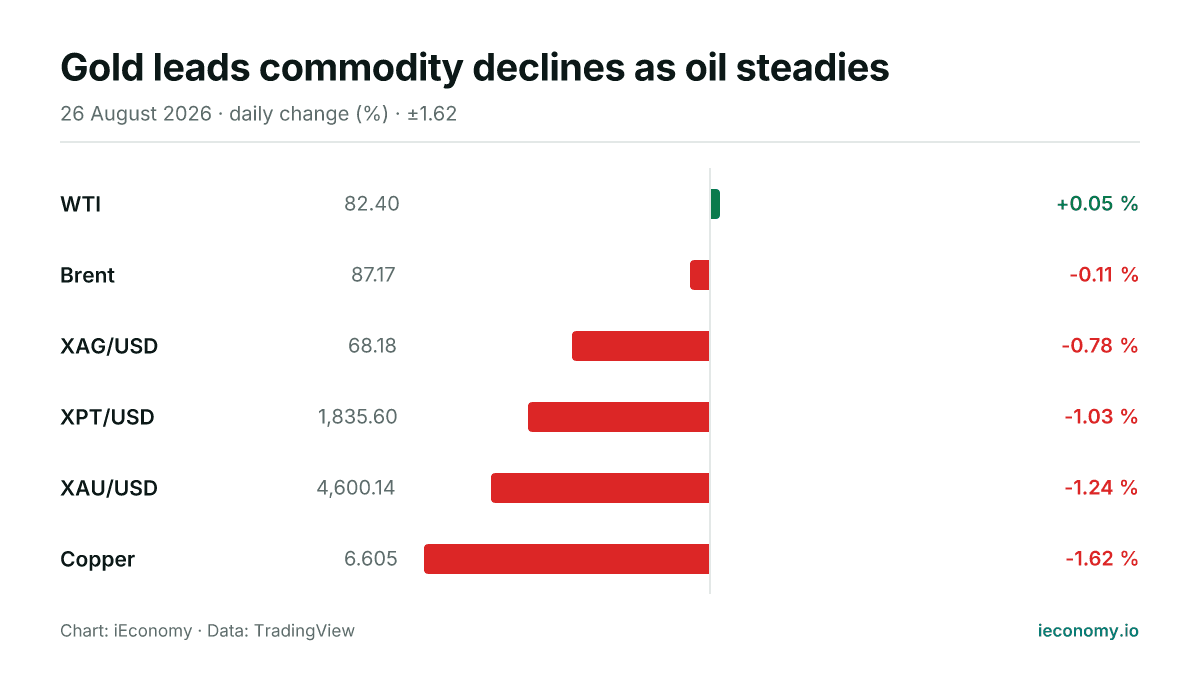
Gold leads commodity declines as oil steadies
On Wednesday, most tracked commodities were lower, with gold and silver among the weakest. WTI was the only gain in the six-instrument set, while Brent also edged down.
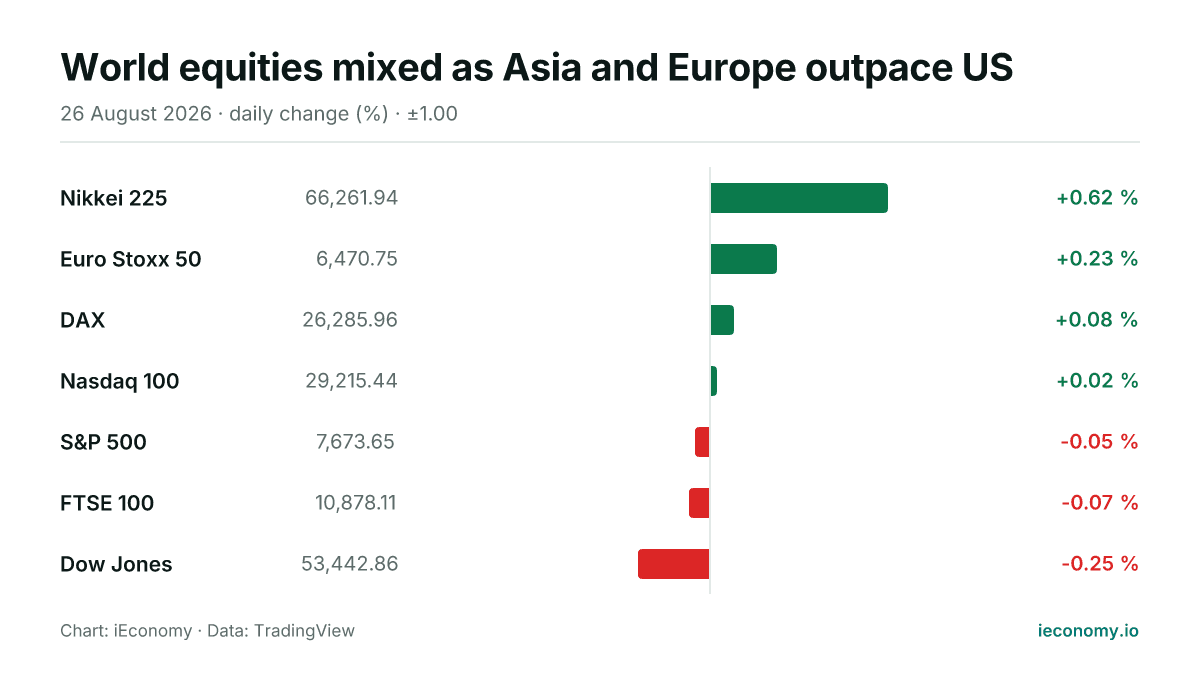
World equities mixed as Asia and Europe outpace US
Asian and European benchmarks edged higher as US indices were mixed in early trading. The moves were modest overall, with the Nikkei 225 leading and the Dow Jones the weakest in the group.

Alamos Gold Breaks Above 200-Day Moving Average
Shares of Alamos Gold Inc. (AGI) crossed above their key 200-day moving average of $38.91 on Tuesday, trading as high as $39.10 and signaling potential technical strength.
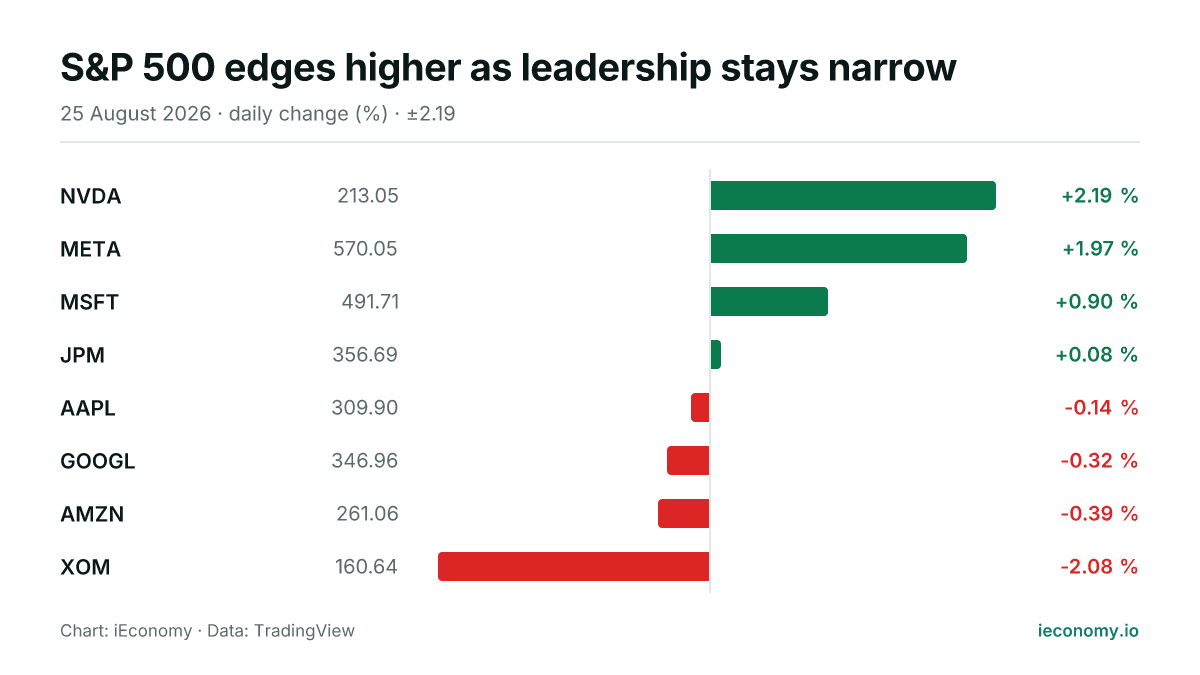
S&P 500 edges higher as leadership stays narrow
The S&P 500 finished Tuesday at 7,677.28, up 0.32%, with a split showing among the eight tracked constituents. NVDA led the gainers while XOM was the weakest name.
Crude Oil Falls as U.S. Pressures Iran Economically
Oil prices dropped after Washington stepped up economic pressure on Iran instead of military action, easing fears of a wider Gulf conflict and lifting some supply anxiety.
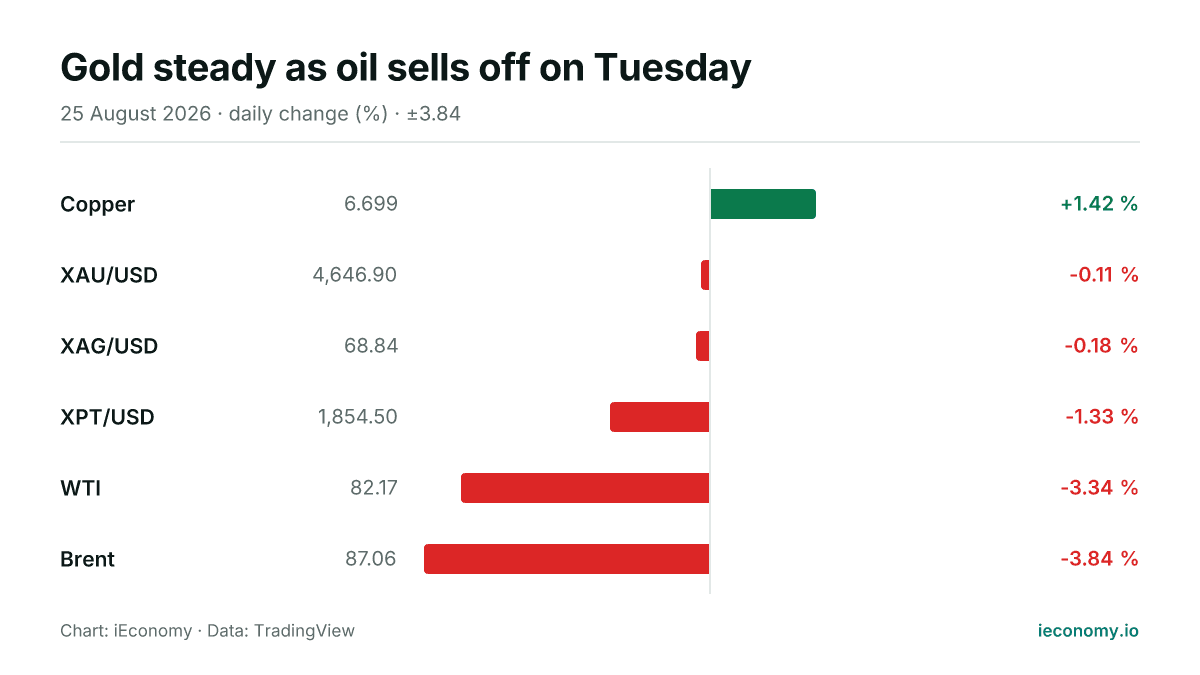
Gold steady as oil sells off on Tuesday
Gold and silver were little changed on Tuesday, while crude oil fell sharply and copper led the small group of gainers. The session left most tracked commodities lower or flat, with one clear outperformer.
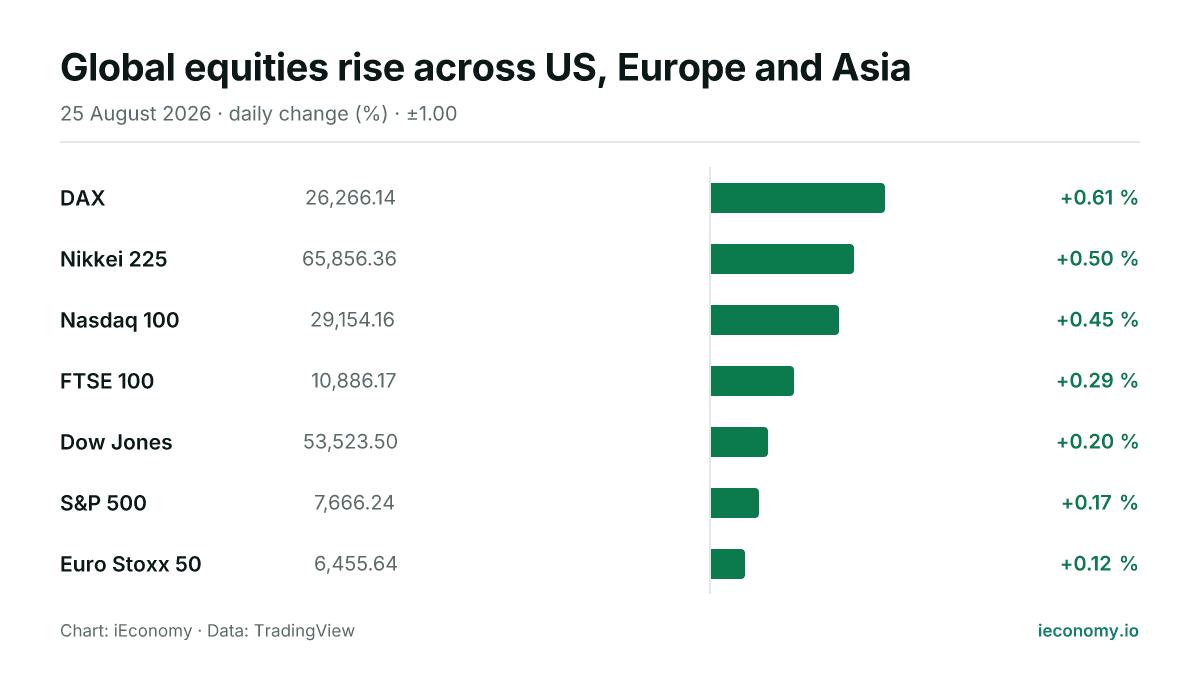
Global equities rise across US, Europe and Asia
All seven tracked benchmarks were higher on Tuesday, with gains led by Germany’s DAX and Japan’s Nikkei 225. The moves were broadly modest, leaving the day more notable for breadth than for size.
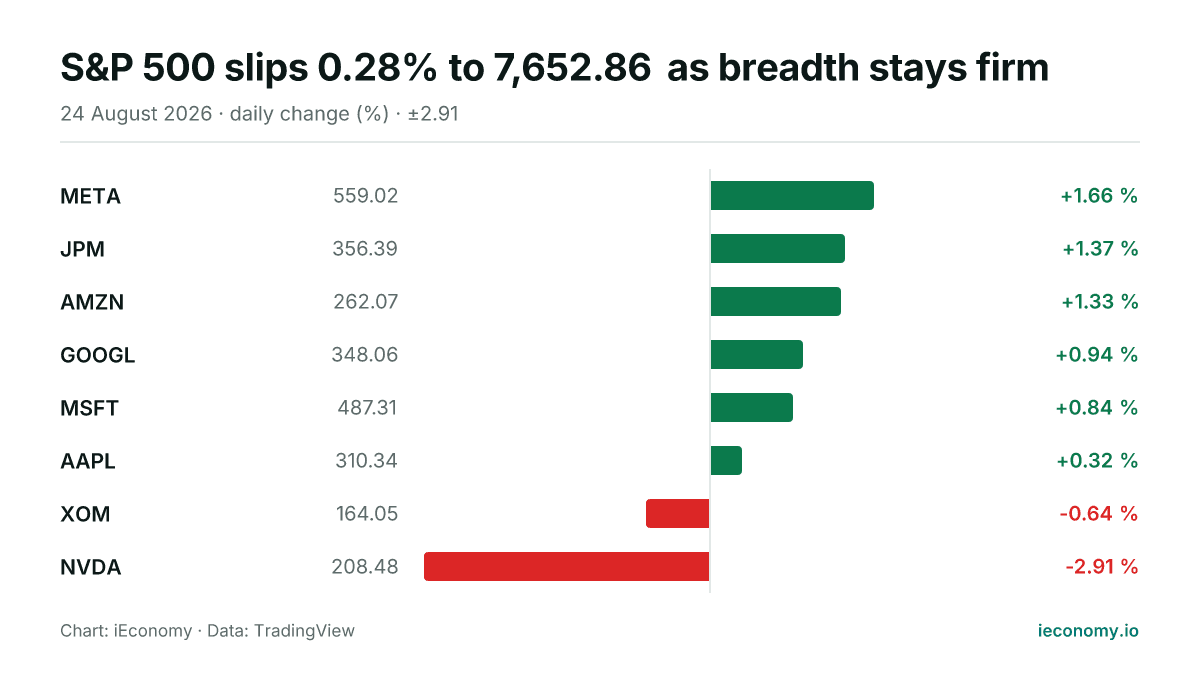
S&P 500 slips 0.28% to 7,652.86 as breadth stays firm
The S&P 500 edged lower on Monday, finishing at 7,652.86 after a modest decline of 0.28%. Among the eight tracked constituents, six rose and two fell, with META the strongest and NVDA the weakest.
Crude Oil Falls as Profit-Taking Follows Recent Gains
Oil prices slid after six straight sessions of advances as traders locked in profits and Washington escalated economic pressure on Iran, keeping Middle East risk in focus.
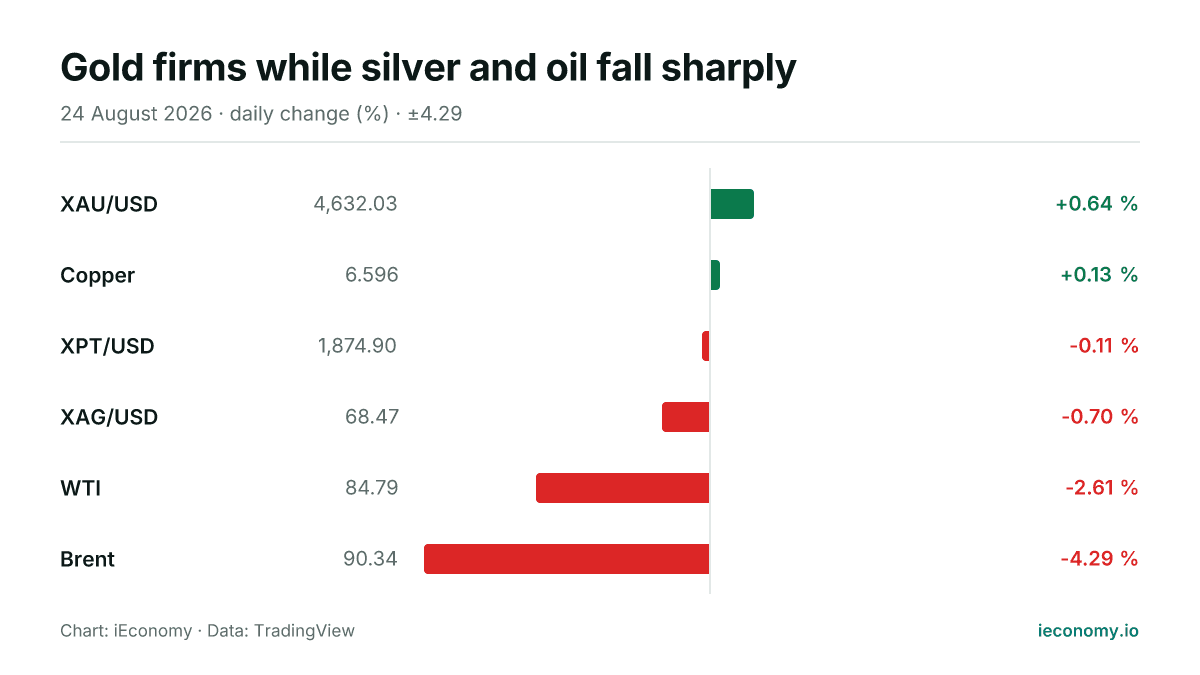
Gold firms while silver and oil fall sharply
Gold edged higher on Monday as silver and crude oil weakened, leaving a mixed but broadly softer commodity tape. Brent and WTI posted the steepest declines, while gold remained the clearest gainer in the digest.
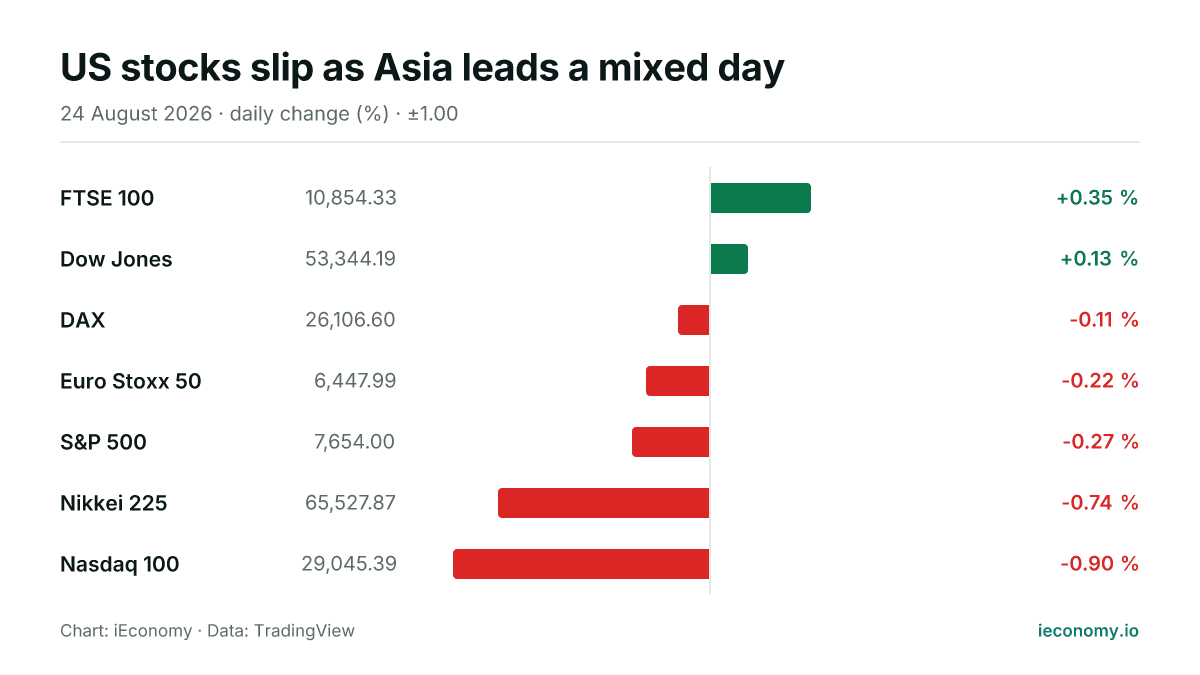
US stocks slip as Asia leads a mixed day
US equities were softer, Europe was broadly lower and Asia fell more sharply, leaving a mixed global tone on Monday. The FTSE 100 and Dow Jones edged higher while the Nikkei 225 and Nasdaq 100 underperformed.