Gold steady as oil sells off on Tuesday
Gold and silver were little changed on Tuesday, while crude oil fell sharply and copper led the small group of gainers. The session left most tracked commodities lower or flat, with one clear outperformer.
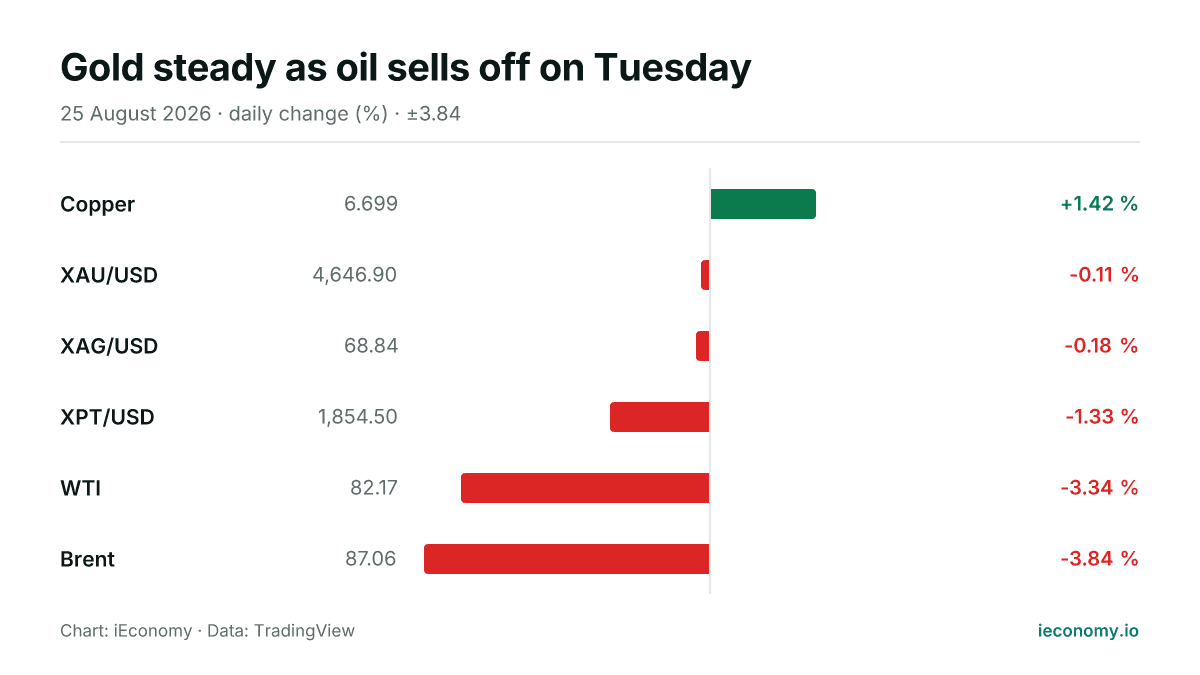
Chart: iEconomy · Data: TradingView
On Tuesday, the commodities tape was mixed to weaker overall: one instrument rose, five were lower or flat. Precious metals were comparatively steady, while crude oil dropped sharply and copper was the day’s lone climber.
What moved and by how much
XAU/USD edged down 0.11% to 4,646.90, and XAG/USD slipped 0.18% to 68.84. Those moves were small in percentage terms, but they still matter because even modest declines in these markets can reflect position adjustments in very liquid contracts.
| Instrument | Last | Change |
|---|---|---|
| Copper | 6.699 | +1.42 % |
| XAU/USD | 4,646.90 | -0.11 % |
| XAG/USD | 68.84 | -0.18 % |
| XPT/USD | 1,854.50 | -1.33 % |
| WTI | 82.17 | -3.34 % |
| Brent | 87.06 | -3.84 % |
WTI fell 3.34% to 82.17 and Brent declined 3.84% to 87.06. In commodity trading, a percentage move of that size typically stands out because oil is priced continuously and reacts quickly to changes in order flow, hedging demand and risk positioning.
Copper moved in the opposite direction, rising 1.42% to 6.699. Against a backdrop of broad weakness elsewhere, that made it the clearest outlier in the session.
The standouts at each end
The strongest performer was copper, while Brent was the weakest of the six instruments tracked. Between those two ends of the spectrum, the day highlighted how different commodity groups can diverge even when they are all moving within the same global trading window.
Gold and silver sat near the middle of the pack, with only modest losses. That sort of action often points to a market that is being repositioned rather than one experiencing a disorderly move, although the digest itself does not identify a specific trigger.
Oil’s larger drop is mechanically important because the benchmark prices are watched not only by traders but also by hedgers and users of physical supply. A move in Brent or WTI can change the value of open exposures immediately, even before any broader narrative emerges.
What a long-term investor should take from one day
One session does not define a longer trend. For long-term investors, the main lesson is that commodities can separate quickly by sector: precious metals may drift, energy may reprice sharply, and industrial metals may move in the other direction.
That difference matters for portfolio construction because diversification across commodity groups does not guarantee uniform outcomes on any given day. It does, however, help reduce reliance on a single price path, which is especially relevant when volatility is concentrated in one corner of the market.
From a mechanics perspective, investors should read such moves as changes in market pricing rather than proof of a new regime. The day’s data show relative strength in copper, near-flat precious metals and a pronounced slide in crude oil, but they do not establish what comes next.
This article is not investment advice and recommends no asset, level or direction; a single session's move is not evidence of a trend. For background see Markets, Bear Market, BIST 100, and for terms the finance glossary.
Frequently asked questions
Which commodity moved the most on Tuesday?
Were gold and silver weak too? Gold and silver were lower, but only slightly. Their moves were small enough to look more like muted session drift than a decisive break in either direction.
Were gold and silver weak too?
What should readers focus on after a single session like this? The key point is dispersion: some markets can fall hard while others barely move or even rise. For investors, that means the day is more useful for understanding relative behaviour and market mechanics than for drawing a forecast.
Sources
Related News
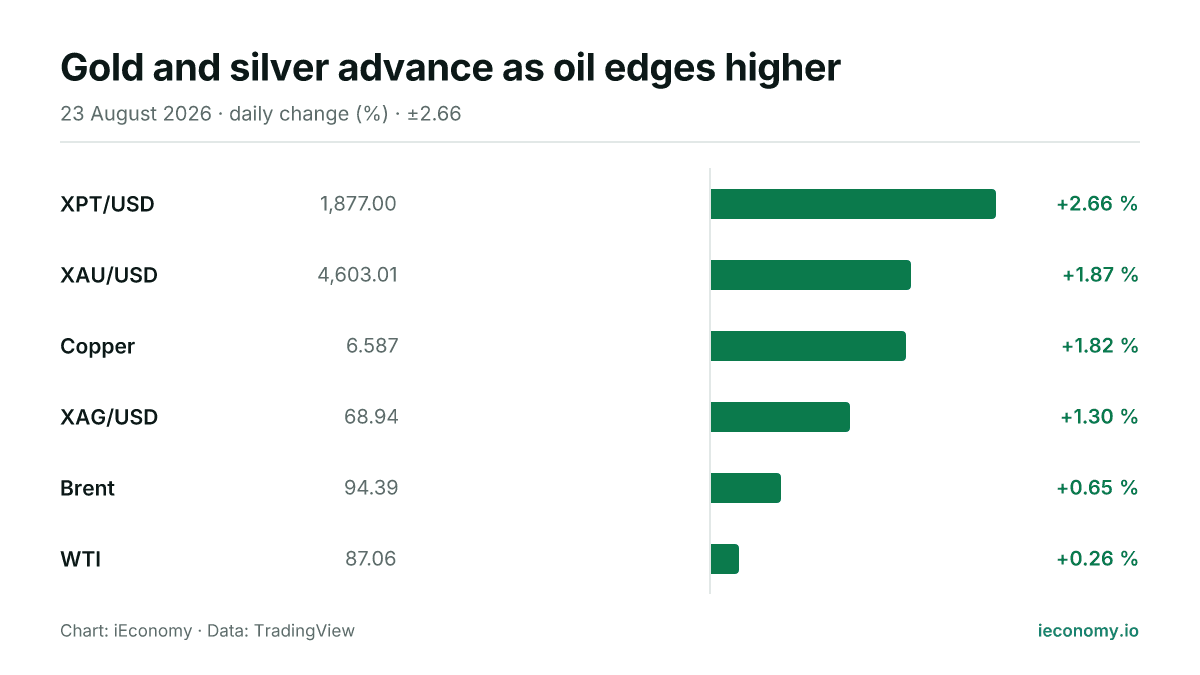
Gold and silver advance as oil edges higher
Gold and silver moved higher on Sunday, with platinum also leading the metals pack. Crude oil rose more modestly, leaving all six tracked commodities in positive territory.
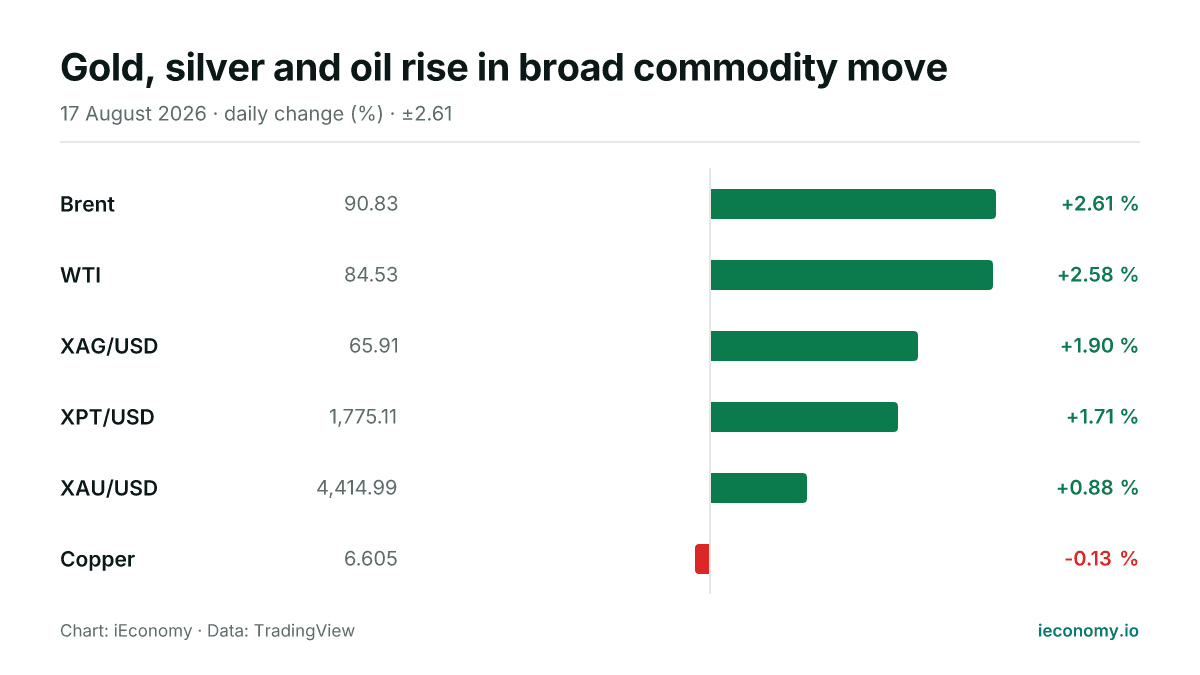
Gold, silver and oil rise in broad commodity move
Most tracked commodities were higher on Monday, led by Brent and WTI, while copper was the lone decliner. Gold and silver also advanced, keeping the precious-metals complex firm on the day.
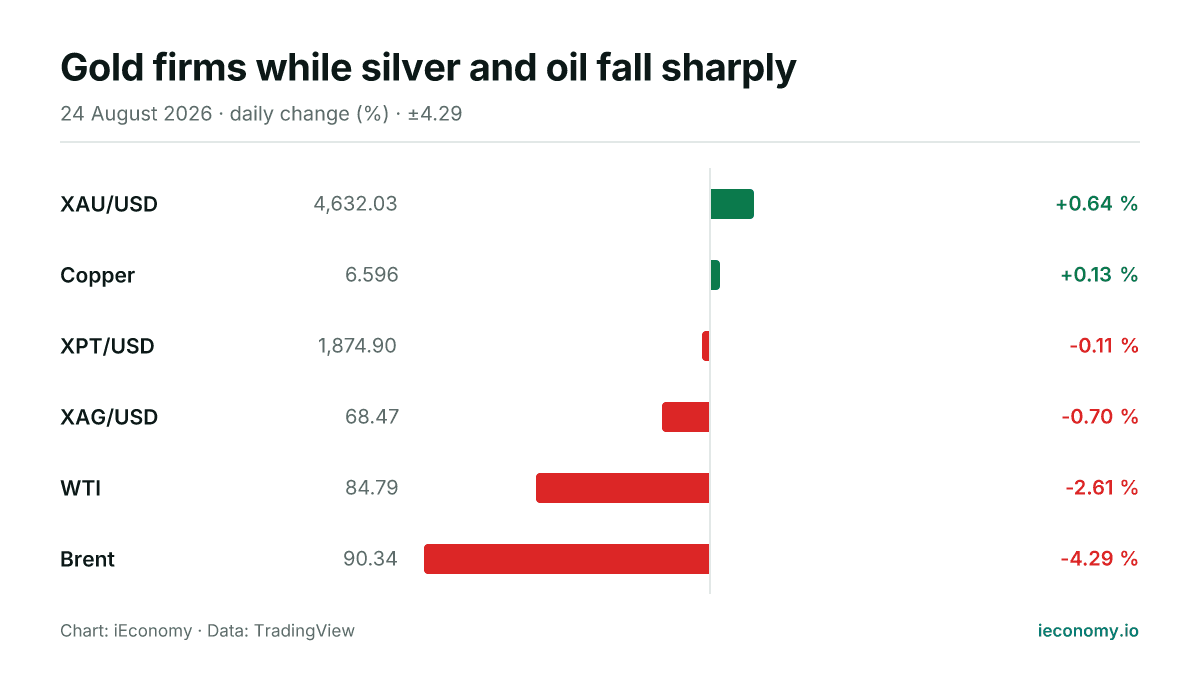
Gold firms while silver and oil fall sharply
Gold edged higher on Monday as silver and crude oil weakened, leaving a mixed but broadly softer commodity tape. Brent and WTI posted the steepest declines, while gold remained the clearest gainer in the digest.
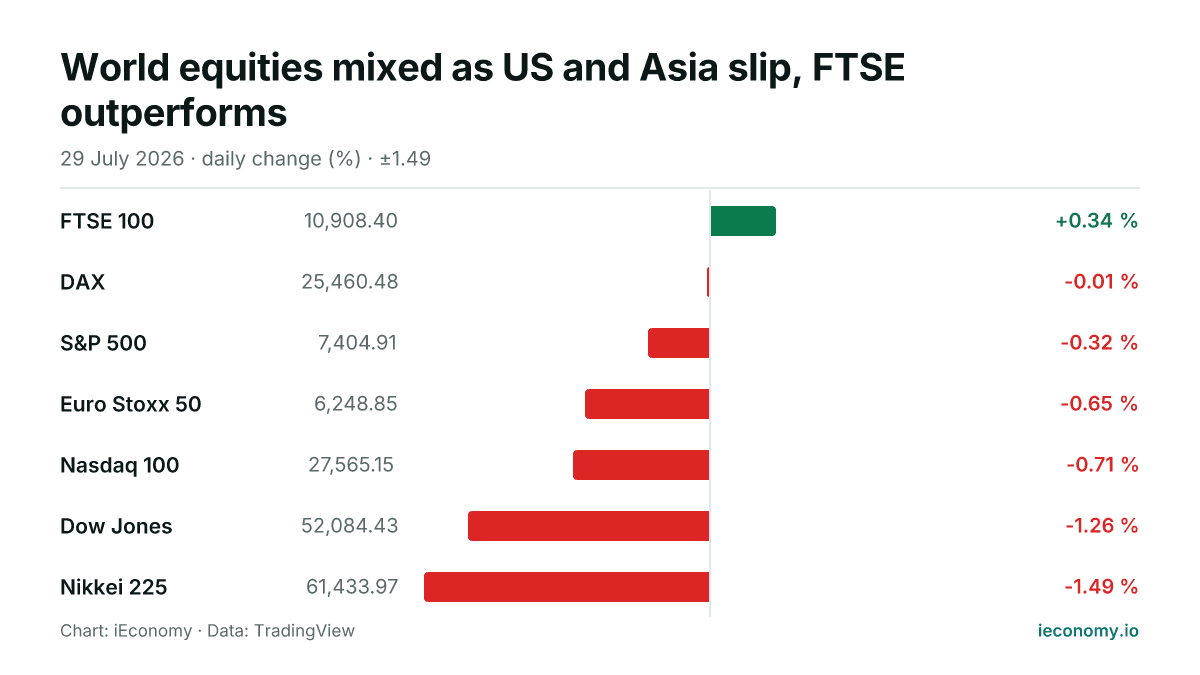
World equities mixed as US and Asia slip, FTSE outperforms
Global shares were mostly lower on Wednesday, with losses led by the Dow Jones and Nikkei 225 while the FTSE 100 edged higher. The DAX was almost unchanged, and the broader tone was one of modest pressure across US, European and Asian indices.

Crude Oil Falls as Demand Outlook Weakens
Oil prices fell as OPEC and the IEA cut their demand outlooks, even as the U.S.-Iran standoff kept supply risks in focus and helped limit the decline.
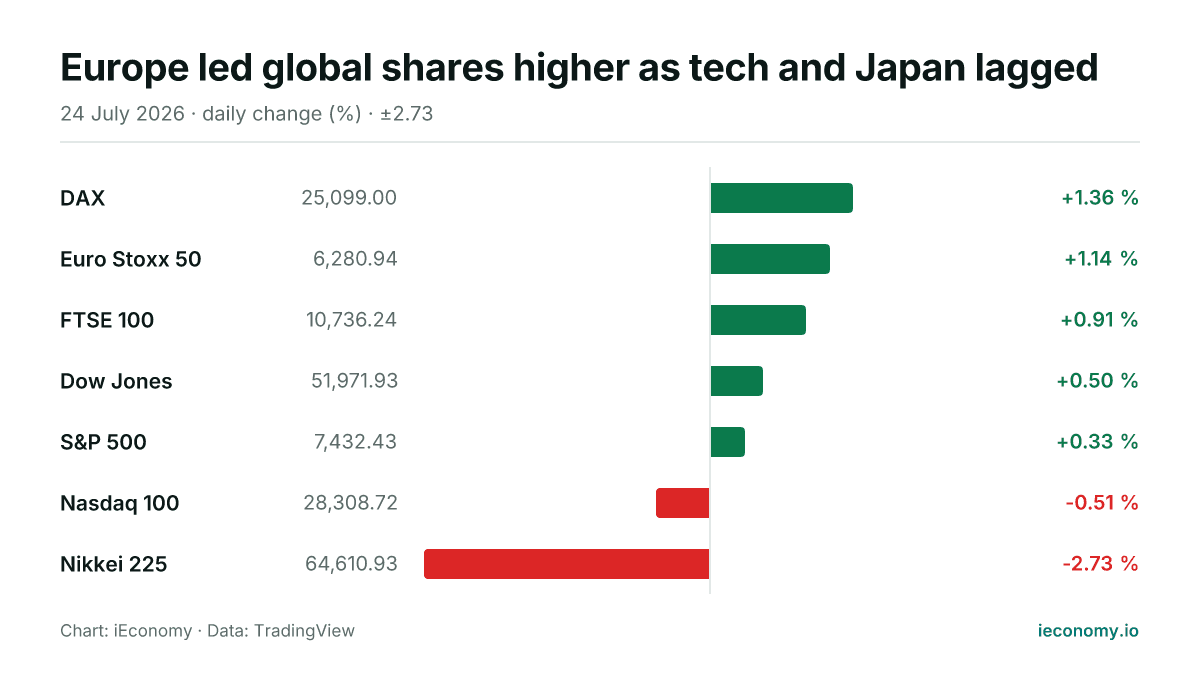
Europe led global shares higher as tech and Japan lagged
European indices outperformed on Friday, while US benchmarks were mixed and Tokyo fell sharply. The day left five of the seven tracked equity gauges higher, with the Nasdaq 100 and Nikkei 225 on the losing side.