Gold leads commodity declines as oil steadies
On Wednesday, most tracked commodities were lower, with gold and silver among the weakest. WTI was the only gain in the six-instrument set, while Brent also edged down.
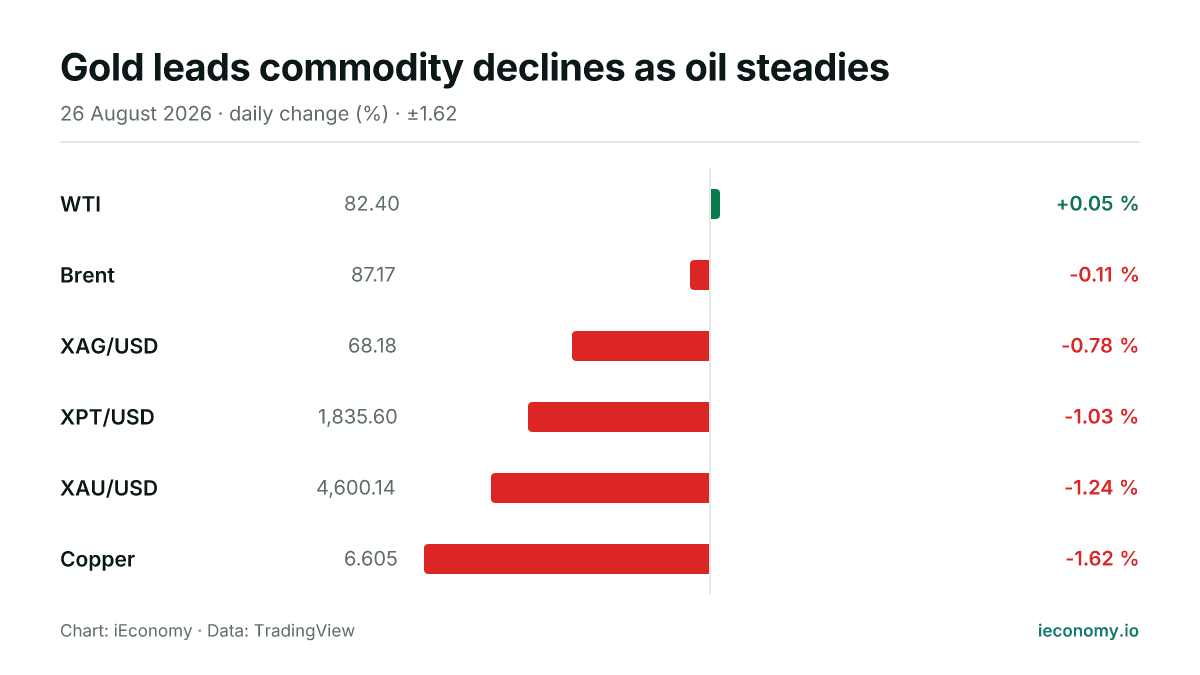
Chart: iEconomy · Data: TradingView
On Wednesday, most tracked commodities were lower, with five of the six instruments either flat or in decline. Gold, silver and platinum all lost ground, while crude oil was mixed, leaving WTI as the only gain in the group.
What moved and by how much
XAU/USD fell 1.24% to 4,600.14, making gold the largest decliner in the digest. XAG/USD slipped 0.78% to 68.18, while XPT/USD dropped 1.03% to 1,835.60.
| Instrument | Last | Change |
|---|---|---|
| WTI | 82.40 | +0.05 % |
| Brent | 87.17 | -0.11 % |
| XAG/USD | 68.18 | -0.78 % |
| XPT/USD | 1,835.60 | -1.03 % |
| XAU/USD | 4,600.14 | -1.24 % |
| Copper | 6.605 | -1.62 % |
In energy, WTI rose 0.05% to 82.40, a marginal gain that left it effectively flat on the day. Brent moved the other way, easing 0.11% to 87.17, so the crude complex was not moving in one direction.
The standouts at each end
WTI was the day’s lone riser, but the move was small enough to read as stability rather than conviction. At the other end, gold’s decline was the clearest one-day move in the set and the largest absolute shift among the six instruments.
The spread between the stronger and weaker readings matters because it shows that commodity markets are not behaving as a single block. Energy and metals can move for different reasons, and even within one sector the two benchmarks can diverge.
What a long-term investor should take from one day
A single session is most useful as a snapshot of relative pressure, not as a signal of direction. For longer-horizon investors, the main point is that daily moves can be uneven across metals and energy, so portfolio risk depends on how exposures are balanced.
Mechanically, a lower spot price means market participants were willing to transact at weaker levels at that moment, while a higher one means the opposite. That does not tell you why the move happened, and it does not establish a trend without further sessions.
Because gold, silver and oil each respond to different trading flows and liquidity conditions, the same day can produce different outcomes across the complex. That makes diversification, rather than concentration in a single commodity, the more important structural takeaway from one data point.
This article is not investment advice and recommends no asset, level or direction; a single session's move is not evidence of a trend. For background see Markets, Bear Market, BIST 100, and for terms the finance glossary.
Frequently asked questions
Which commodity moved the most?
Gold moved the most in percentage terms, falling 1.24% to 4,600.14. Among the day’s energy benchmarks, WTI was nearly unchanged and Brent was only slightly lower.
Was crude oil stronger or weaker overall?
The crude complex was mixed. WTI edged higher by 0.05%, while Brent fell 0.11%, so there was no broad directional move across both benchmarks.
What should a reader infer from one day’s moves?
One day shows how prices were trading at that moment, but not whether the move will persist. For longer-term decisions, the important lesson is that commodity markets can diverge sharply, so risk should be assessed instrument by instrument.
Sources
Related News
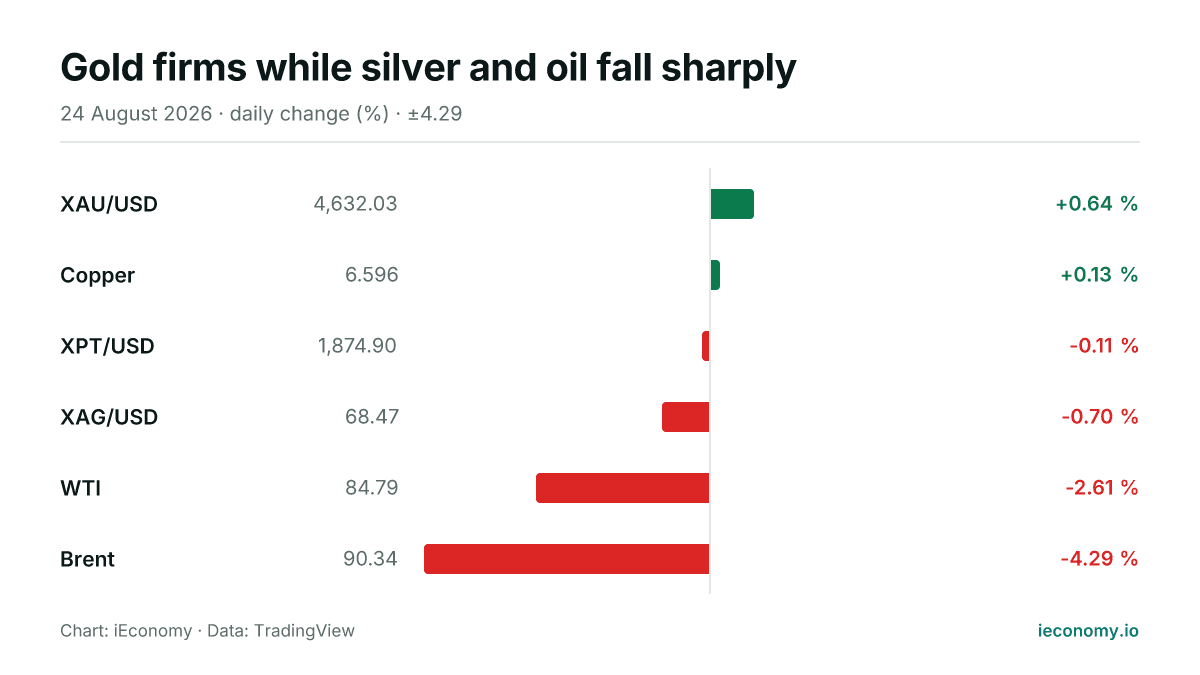
Gold firms while silver and oil fall sharply
Gold edged higher on Monday as silver and crude oil weakened, leaving a mixed but broadly softer commodity tape. Brent and WTI posted the steepest declines, while gold remained the clearest gainer in the digest.
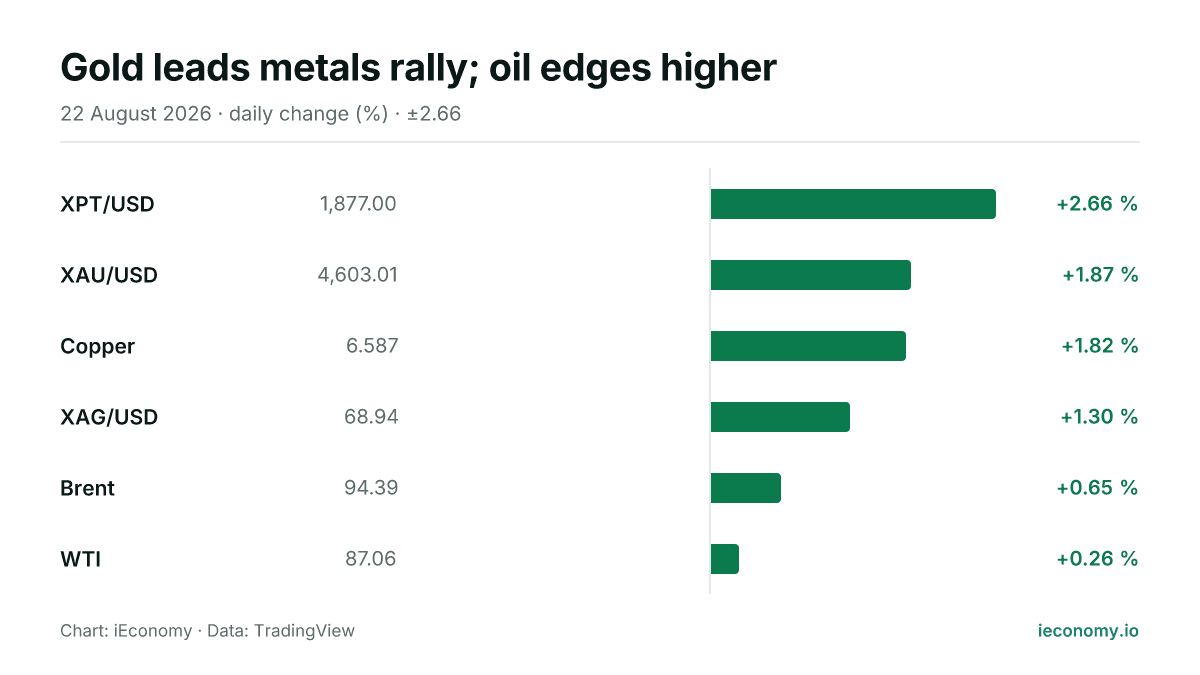
Gold leads metals rally; oil edges higher
Gold and silver advanced alongside crude oil in a broad commodity move on Saturday, with all six tracked instruments higher. Gold led the precious-metals complex, while Brent and WTI posted more modest gains.
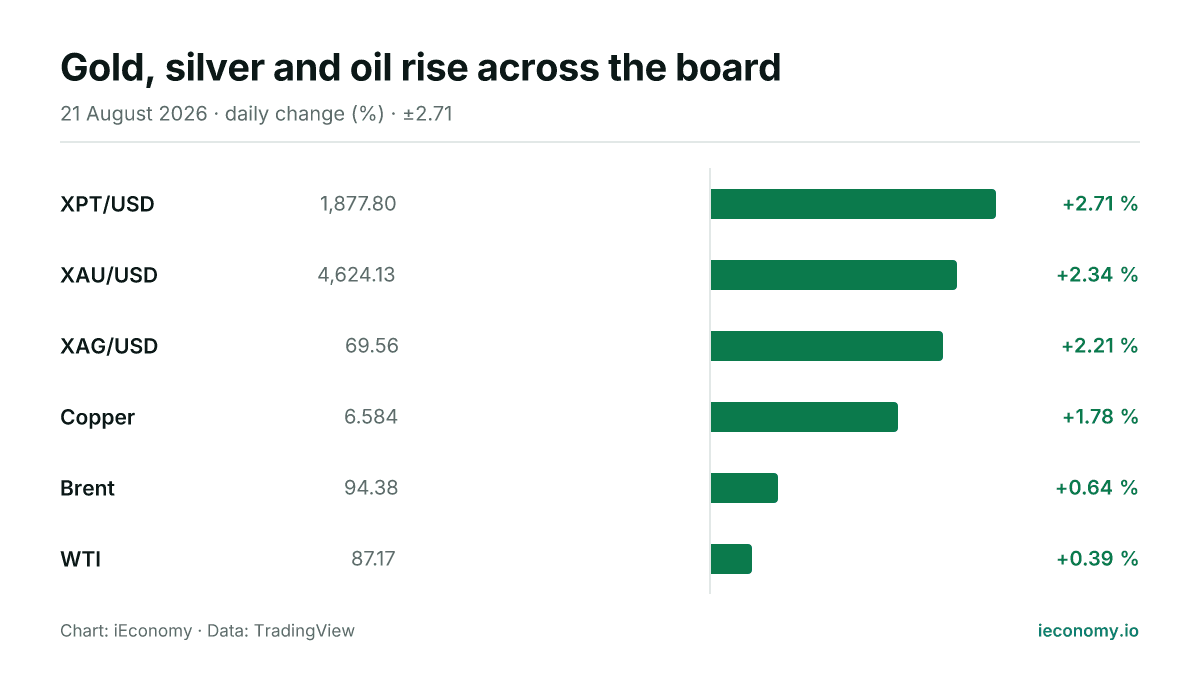
Gold, silver and oil rise across the board
All six tracked commodities moved higher on Friday, led by platinum and gold, while Brent and WTI posted smaller gains. The day’s moves point to broad buying pressure rather than a split market.
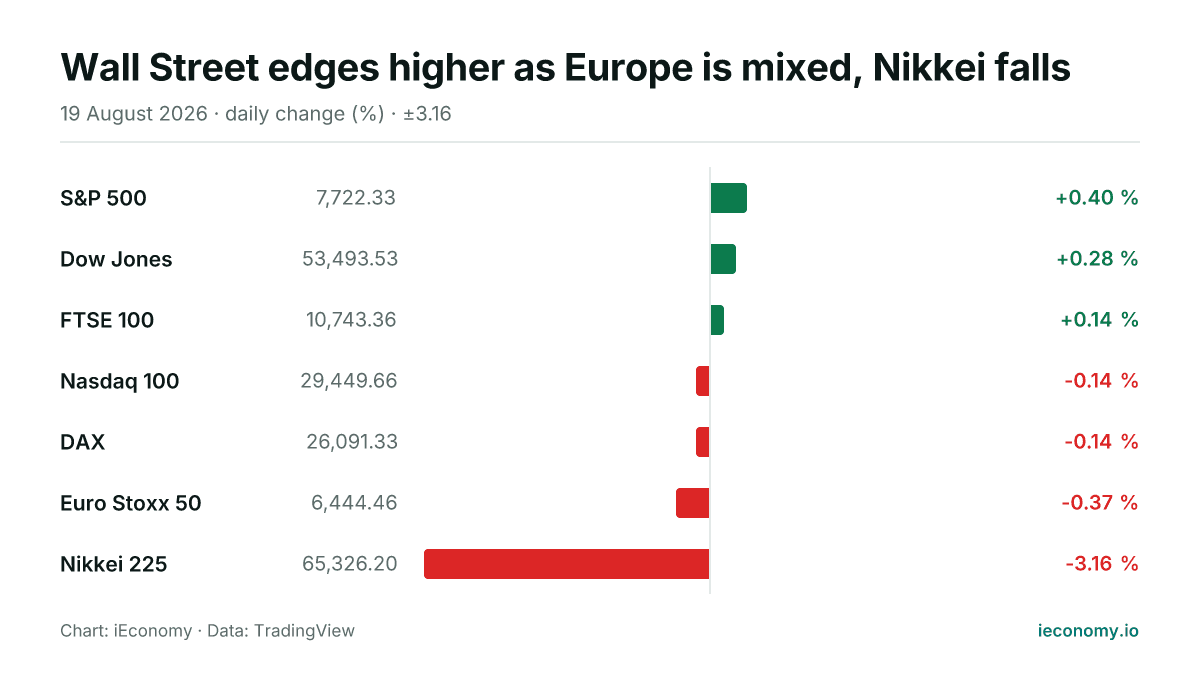
Wall Street edges higher as Europe is mixed, Nikkei falls
US equities were firmer in Wednesday trading, led by the S&P 500 and Dow Jones, while European indices were split and Japan’s Nikkei 225 lagged sharply. The session showed a broad but uneven risk appetite, with gains in some benchmarks offset by declines elsewhere.
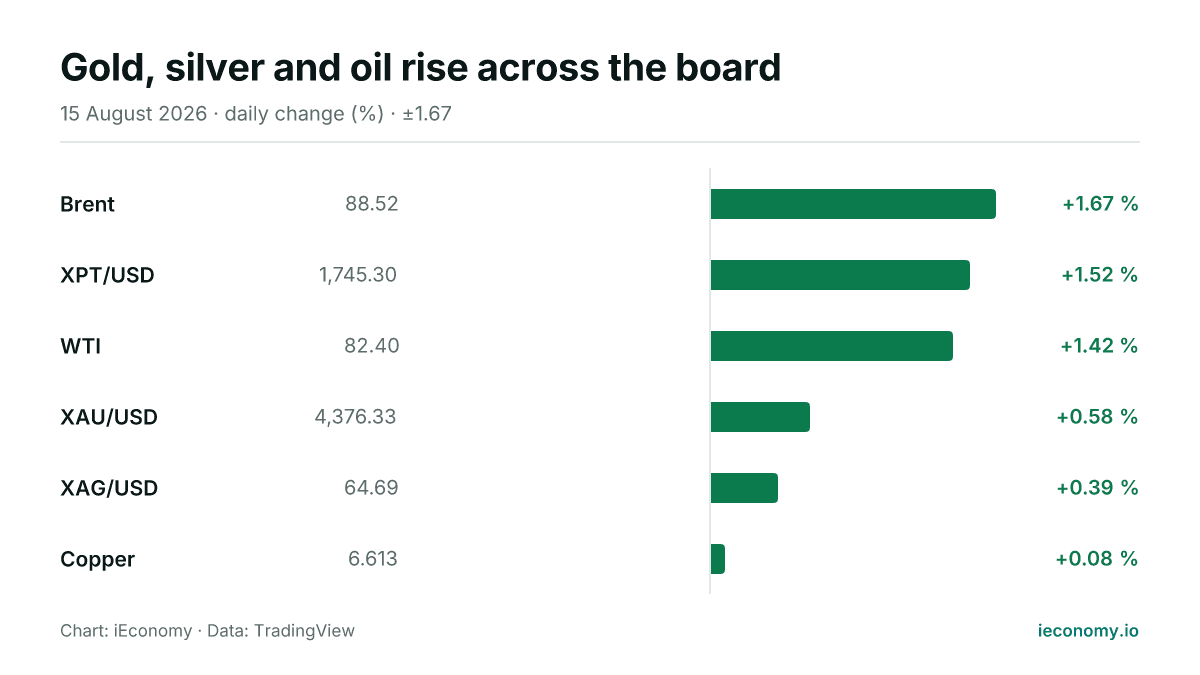
Gold, silver and oil rise across the board
All six tracked commodities moved higher on Saturday, led by Brent and platinum-group metals, while gold and silver also advanced. The day’s gains were broad-based, but the moves remain a snapshot rather than a signal on direction.
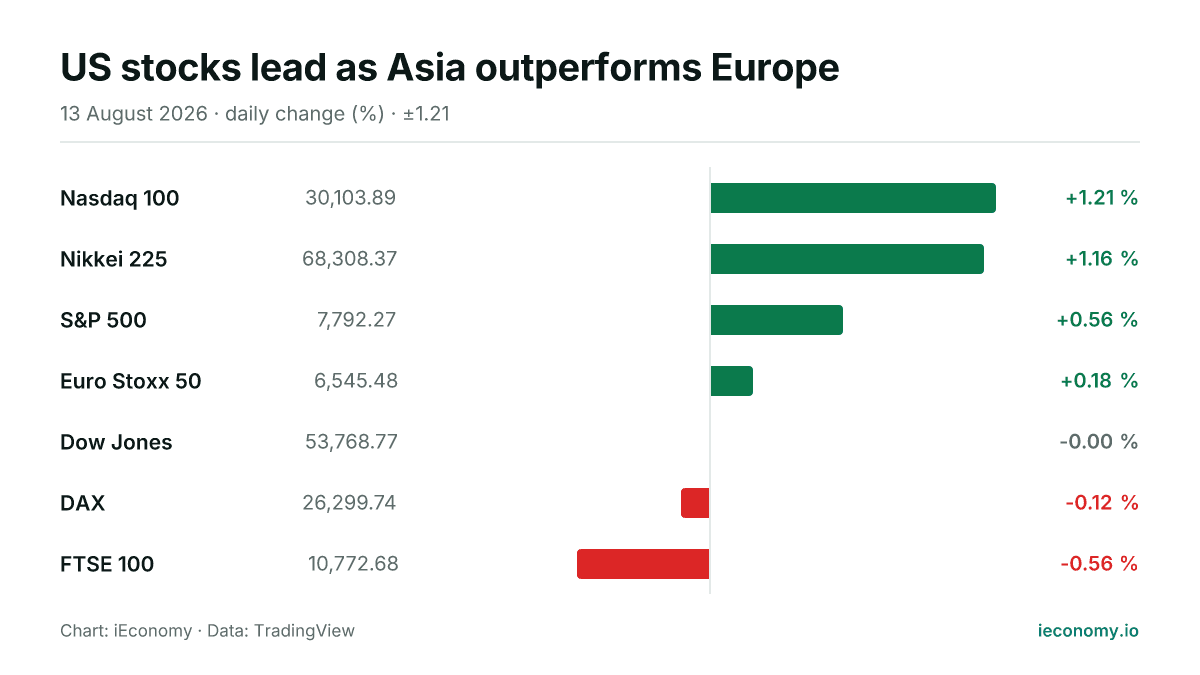
US stocks lead as Asia outperforms Europe
US and Asian indices advanced more firmly than European benchmarks on Thursday, with the Nasdaq 100 and Nikkei 225 setting the pace while the FTSE 100 lagged. The day left seven major benchmarks split, with four higher and three lower or flat.