Global equities rise across US, Europe and Asia
All seven tracked benchmarks were higher on Tuesday, with gains led by Germany’s DAX and Japan’s Nikkei 225. The moves were broadly modest, leaving the day more notable for breadth than for size.
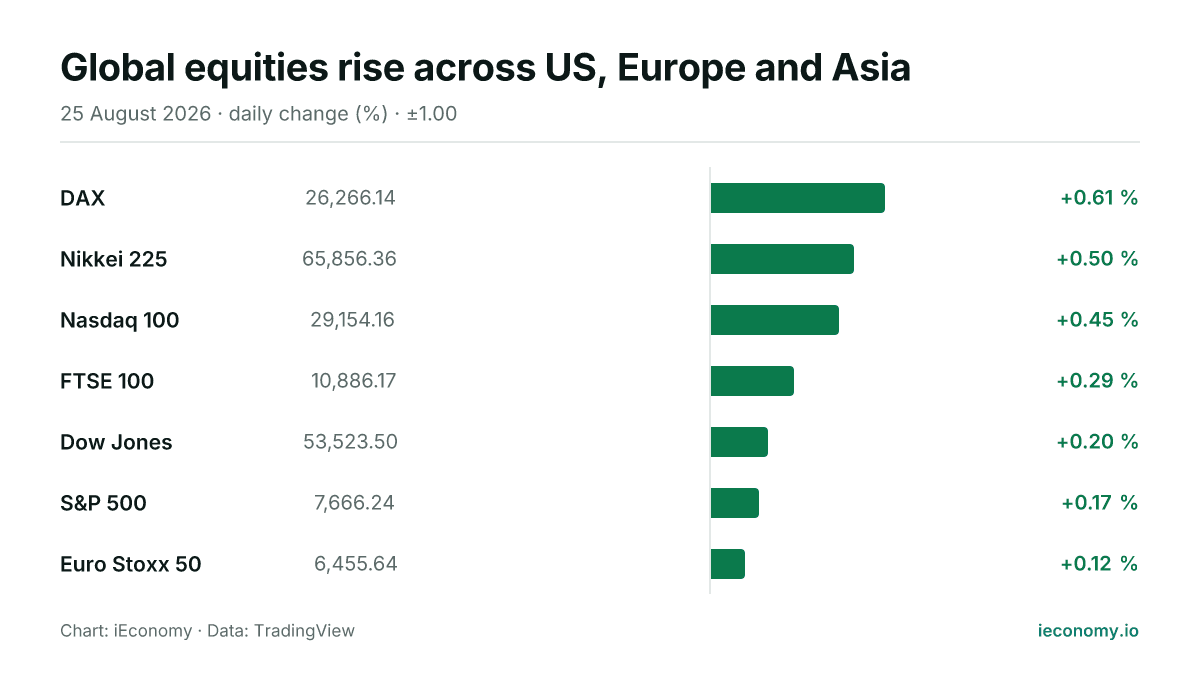
Chart: iEconomy · Data: TradingView
World equity benchmarks were mostly higher on Tuesday, with all seven tracked indices in positive territory. The moves were orderly rather than dramatic, and the day’s main feature was the breadth of advances across the US, Europe and Asia.
What moved and by how much
Germany’s DAX led the group with a gain of 0.61%, while the Nikkei 225 added 0.50% and the Nasdaq 100 rose 0.45%. The FTSE 100, Dow Jones, S&P 500 and Euro Stoxx 50 also advanced, but by smaller margins.
| Instrument | Last | Change |
|---|---|---|
| DAX | 26,266.14 | +0.61 % |
| Nikkei 225 | 65,856.36 | +0.50 % |
| Nasdaq 100 | 29,154.16 | +0.45 % |
| FTSE 100 | 10,886.17 | +0.29 % |
| Dow Jones | 53,523.50 | +0.20 % |
| S&P 500 | 7,666.24 | +0.17 % |
| Euro Stoxx 50 | 6,455.64 | +0.12 % |
The European indices were mixed only in size, not direction: the DAX outpaced the Euro Stoxx 50, which rose 0.12%, and the FTSE 100 gained 0.29%. In the US, the Nasdaq 100 outperformed the Dow Jones and the S&P 500, showing a firmer session for growth-sensitive large caps.
The standouts at each end
At the top of the table, the DAX, at 26,266.14, posted the strongest percentage increase among the tracked benchmarks. At the other end, the Euro Stoxx 50 registered the smallest rise, though it still remained in positive territory.
The difference between the leaders and laggards was one of relative strength rather than outright divergence. With no index lower or flat, the session suggested broad participation, but also limited conviction in any single market.
What a long-term investor should take from one day
A single day of gains does not alter the longer-term picture by itself, but it can show where participation is widest and where leadership is concentrated. When all major regions rise together, the move often reflects common positioning rather than a change in fundamentals that can be read directly from prices alone.
For long-term investors, the useful point is that volatility can differ even when direction is shared. Broader advances can support portfolios diversified across regions and styles, but short-term moves still need to be judged in context, because a session like this can fade or extend without warning.
This article is not investment advice and recommends no asset, level or direction; a single session's move is not evidence of a trend. For background see Markets, Bear Market, BIST 100, and for terms the finance glossary.
Frequently asked questions
Was the advance broad-based?
Yes. All seven tracked indices were higher, so the day was defined by breadth rather than by a narrow rally in one region. That kind of uniform move can make the market look steady even when the size of the gains remains modest.
Which index moved the most?
The DAX had the largest rise at 0.61%. The Euro Stoxx 50 had the smallest increase at 0.12%, showing that European benchmarks moved in the same direction but with different strength.
What should investors infer from this session?
The main lesson is that one positive day across major regions is informative about market tone, but not decisive on its own. Investors usually need a longer run of sessions to judge whether a move reflects persistent leadership, rotation or simply normal day-to-day variation.
Sources
Related News
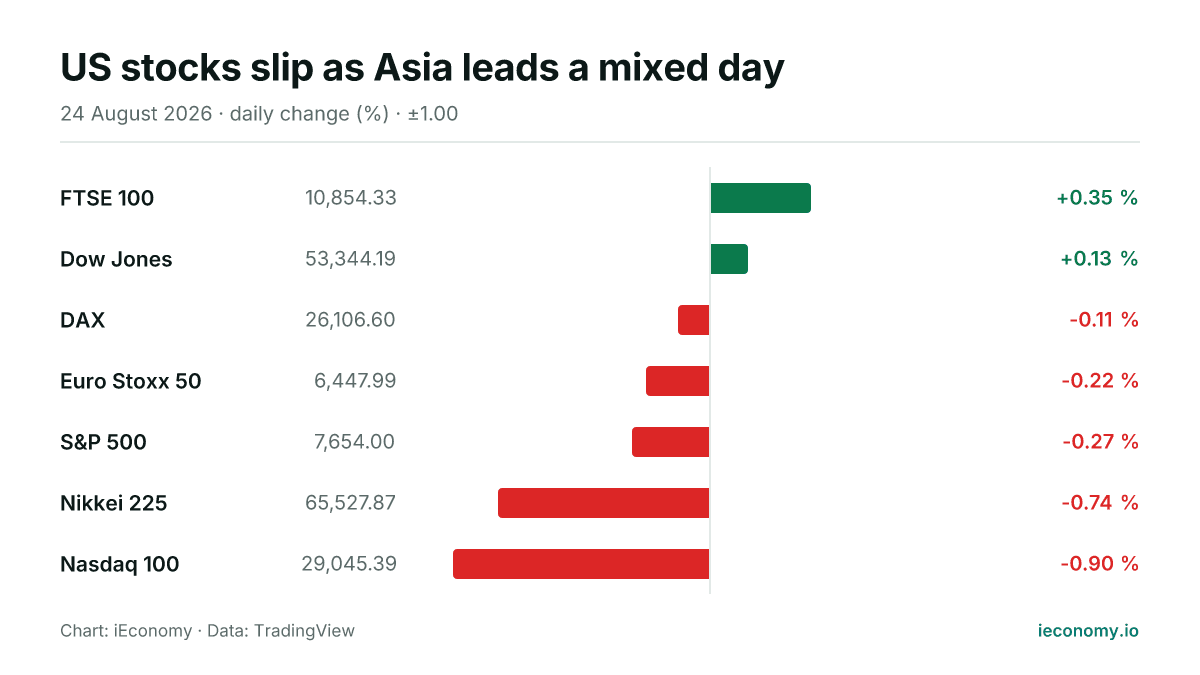
US stocks slip as Asia leads a mixed day
US equities were softer, Europe was broadly lower and Asia fell more sharply, leaving a mixed global tone on Monday. The FTSE 100 and Dow Jones edged higher while the Nikkei 225 and Nasdaq 100 underperformed.
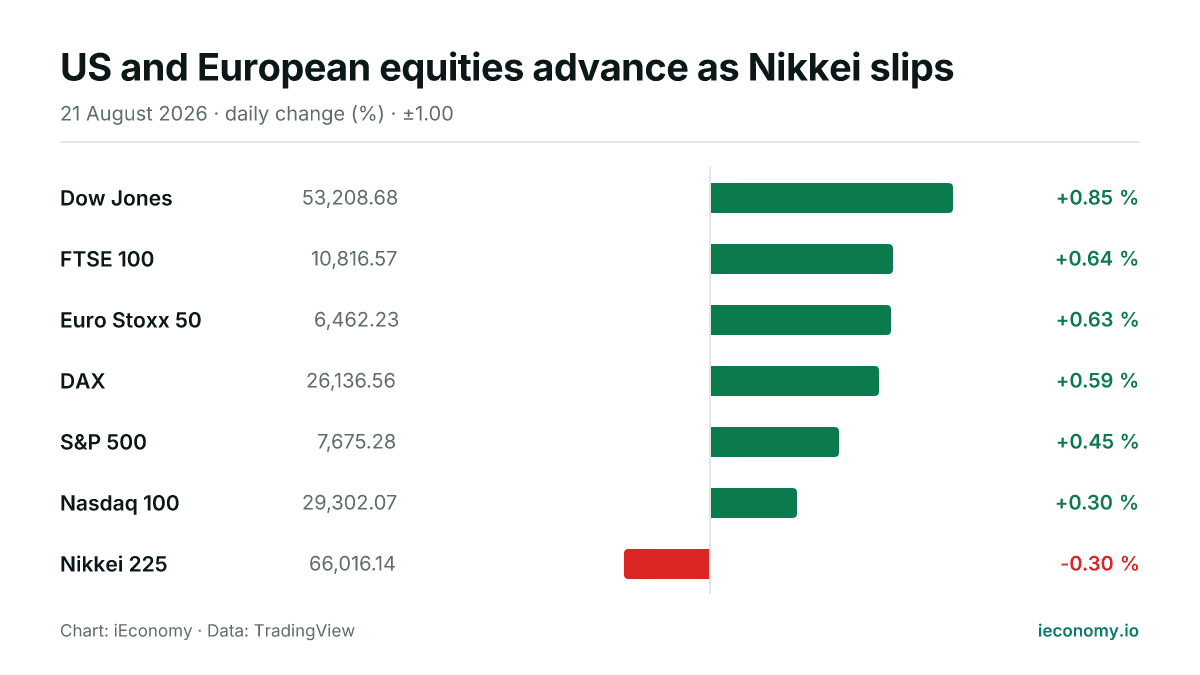
US and European equities advance as Nikkei slips
World equity markets were mostly firmer on Friday, with US and European benchmarks higher and Japan's Nikkei 225 lower. The moves were broad but modest, leaving risk appetite positive without being one-directional.
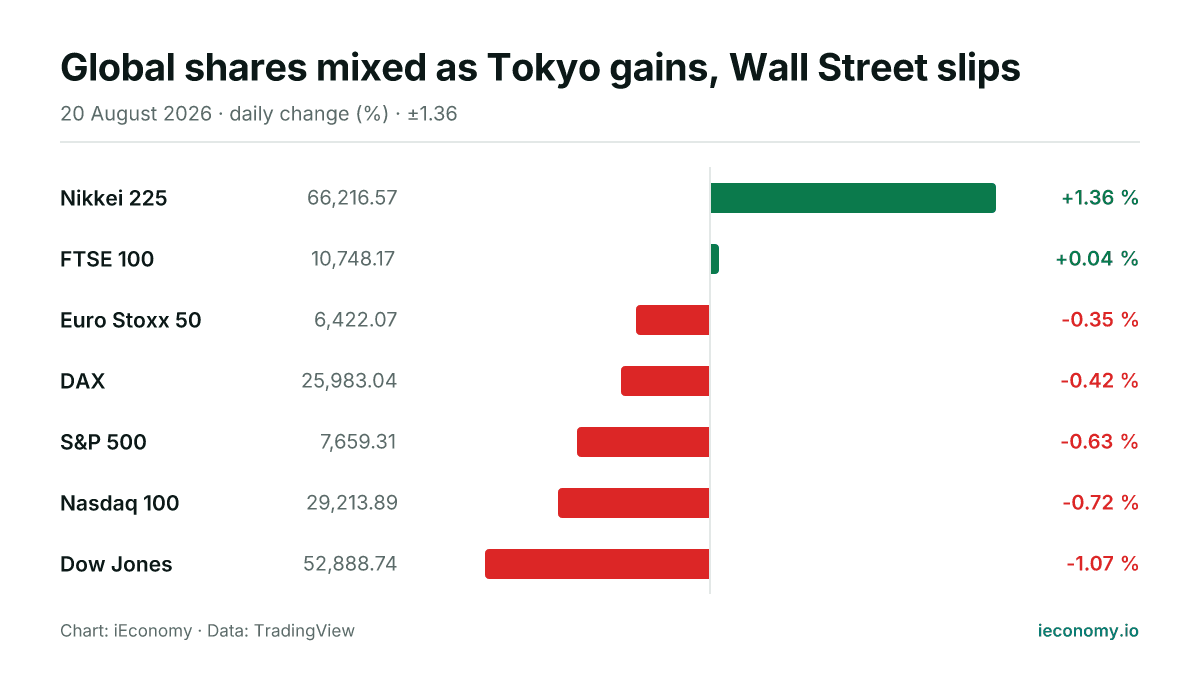
Global shares mixed as Tokyo gains, Wall Street slips
Asian equities were firmer and Europe was little changed to lower, while US indices traded lower. The day’s pattern showed rotation rather than a broad-risk selloff, with only two of seven benchmarks advancing.
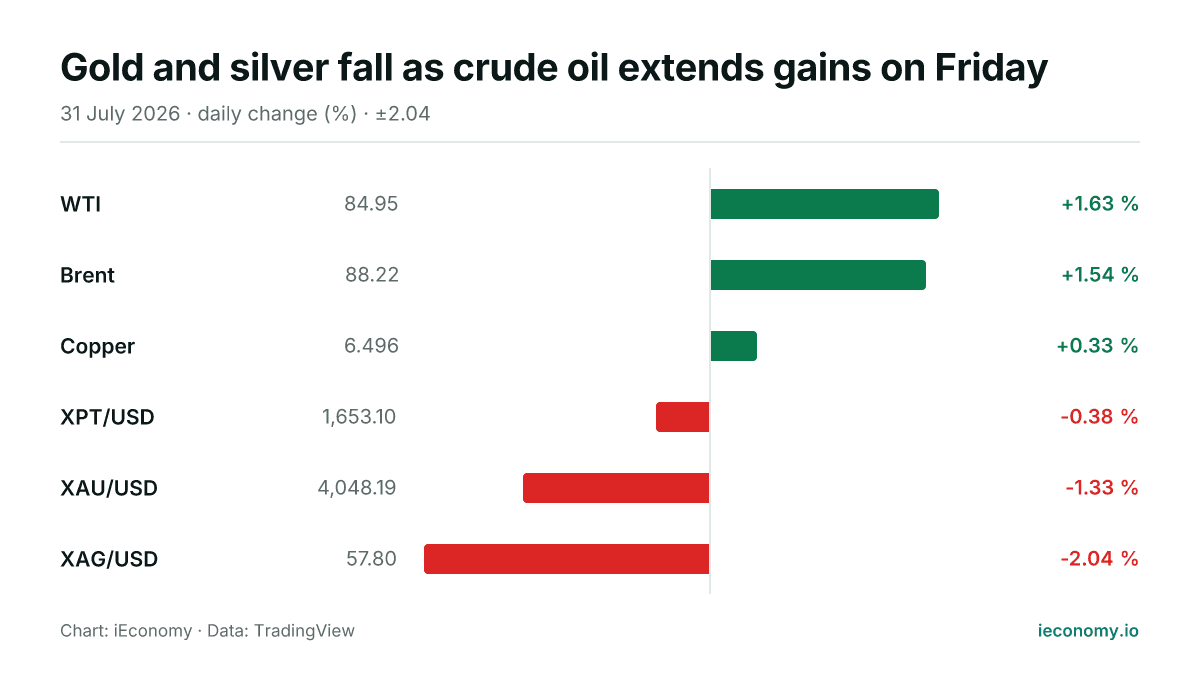
Gold and silver fall as crude oil extends gains on Friday
Gold and silver were lower while crude oil moved higher on 2026-07-31, with copper also slightly firmer. The day left a mixed commodity tape, led by strength in energy and weakness in precious metals.
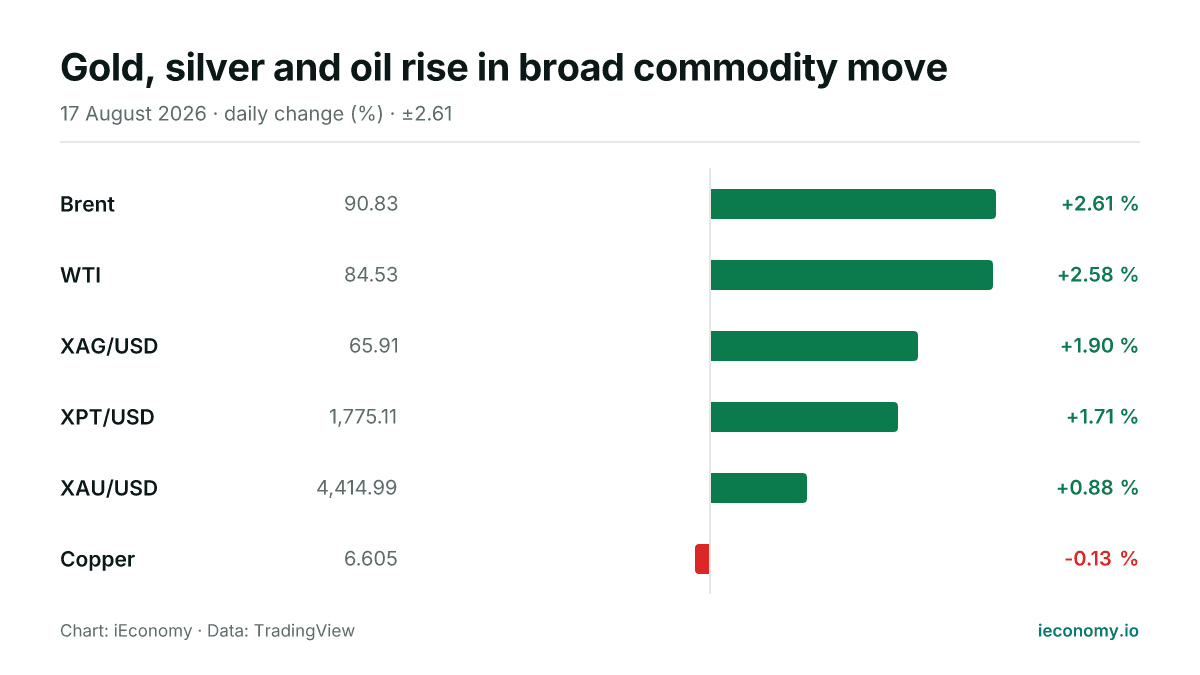
Gold, silver and oil rise in broad commodity move
Most tracked commodities were higher on Monday, led by Brent and WTI, while copper was the lone decliner. Gold and silver also advanced, keeping the precious-metals complex firm on the day.
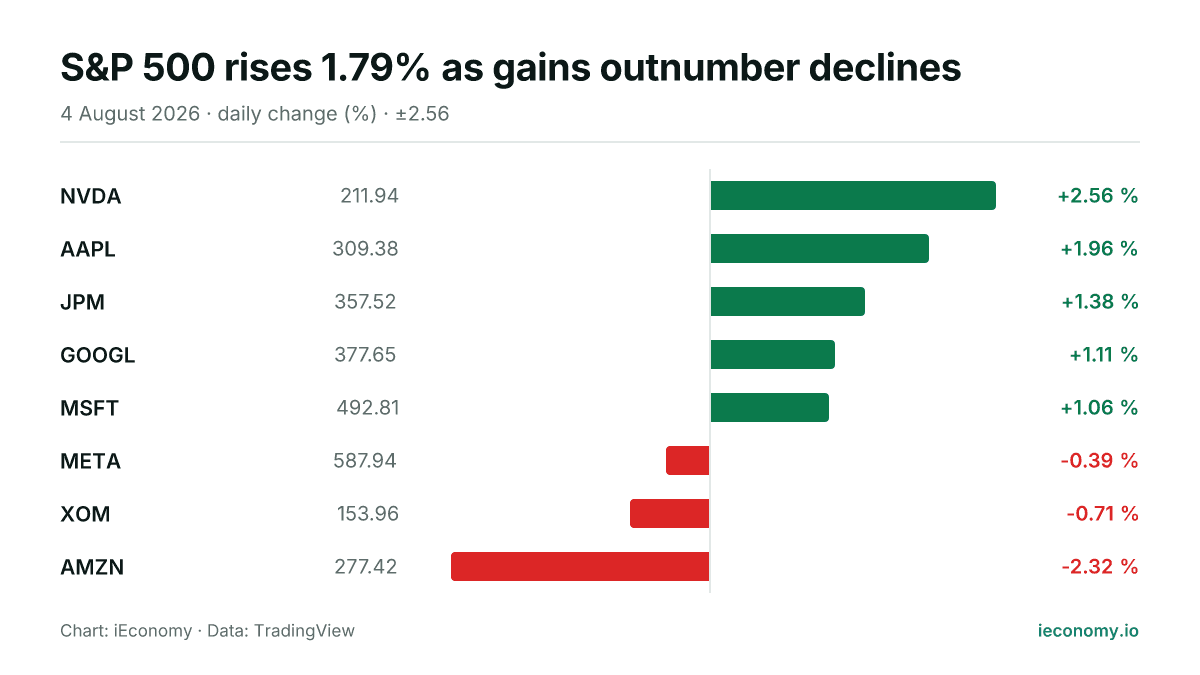
S&P 500 rises 1.79% as gains outnumber declines
The S&P 500 finished Tuesday at 7,736.52, up 1.79%, with five of the eight tracked constituents higher and three lower. NVDA led the day, while AMZN was the weakest performer.