Gold and silver fall as crude oil extends gains on Friday
Gold and silver were lower while crude oil moved higher on 2026-07-31, with copper also slightly firmer. The day left a mixed commodity tape, led by strength in energy and weakness in precious metals.
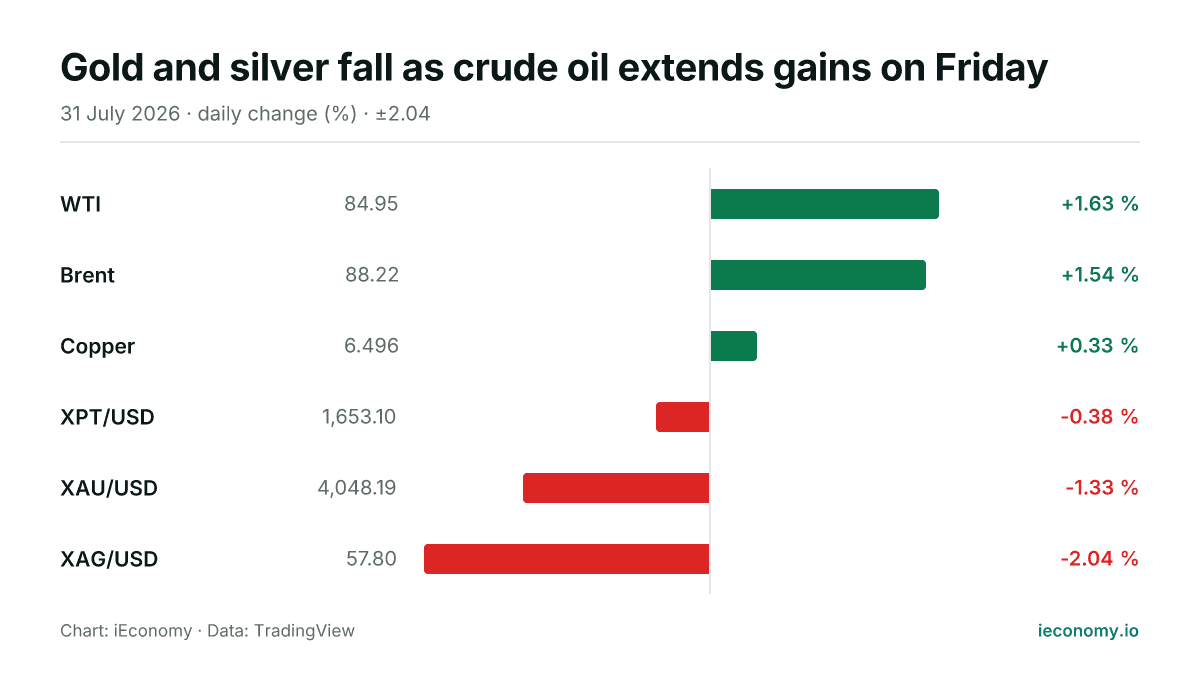
Chart: iEconomy · Data: TradingView
Commodity trading was mixed on Friday, 2026-07-31, with crude oil firmer and precious metals weaker. WTI and Brent both advanced, copper edged higher, and gold and silver both lost ground, leaving the day split between energy strength and softer haven-linked metals.
What moved and by how much
WTI rose 1.63% to 84.95 and Brent gained 1.54% to 88.22, making oil the clearest positive move in the group. Copper also posted a modest gain, up 0.33%. At the other end, XAU/USD fell 1.33% to 4,048.19, while XAG/USD dropped 2.04% to 57.80. XPT/USD was lower too, easing 0.38%. The day’s moves were not uniform: energy and industrial metal pricing held up better than precious metals.
The standouts at each end
| Instrument | Last | Change |
|---|---|---|
| WTI | 84.95 | +1.63 % |
| Brent | 88.22 | +1.54 % |
| Copper | 6.496 | +0.33 % |
| XPT/USD | 1,653.10 | -0.38 % |
| XAU/USD | 4,048.19 | -1.33 % |
| XAG/USD | 57.80 | -2.04 % |
On the upside, WTI and Brent stood out for the size of their gains and for moving in the same direction, which matters because the two benchmarks often reinforce one another when the oil complex is bid. On the downside, silver was the weakest of the tracked contracts, underlining that even relatively small daily percentage changes can be meaningful in high-priced markets. Gold also weakened, but less sharply than silver, while platinum’s move was comparatively contained.
What a long-term investor should take from one day
For longer-term investors, a single session is mainly useful as a reminder of mechanics rather than a signal in itself. Futures and spot-linked metals can move differently because of positioning, currency effects, and shifts in relative demand for hedges versus cyclical exposure. One day’s move does not establish a trend, and it should not be read as confirmation of a broader turn. The practical takeaway is that commodities can diverge sharply within the same session, so portfolio risk should be assessed across the whole complex, not just one headline market.
Sources
Related News

Oil outperforms as gold and silver ease on Monday
Crude oil led the session higher on Monday, while gold and silver slipped and broader metals were weaker. The moves show how single-day performance can diverge sharply across commodities even within the same trading day.

Gold and silver gain as crude oil falls on the day
Gold and silver advanced on Saturday, while WTI and Brent moved lower. The cross-commodity picture left precious metals firmer and crude softer, with copper barely changed.
Gold and silver rise as crude oil drops sharply
Gold and silver advanced on Friday while crude oil fell, leaving the commodity board mixed. The move was led by precious metals, with Brent and WTI weaker and only a few contracts in positive territory.
Gold, silver and oil rise across the board
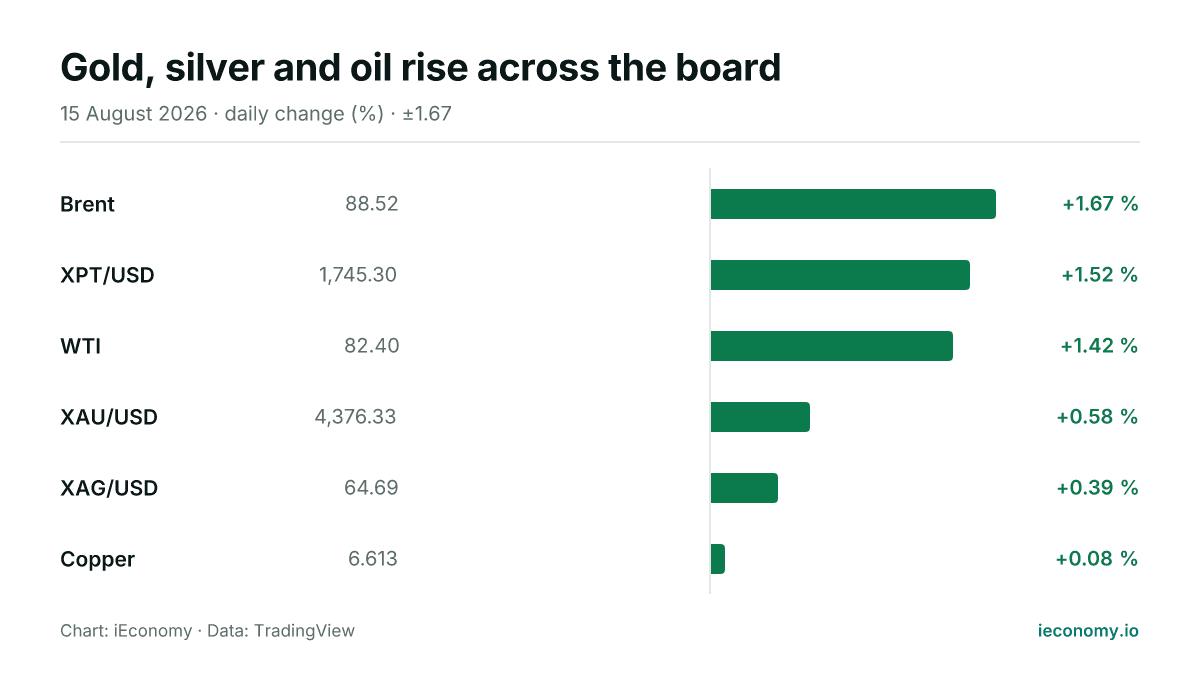
All six tracked commodities moved higher on Saturday, led by Brent and platinum-group metals, while gold and silver also advanced. The day’s gains were broad-based, but the moves remain a snapshot rather than a signal on direction.

Commercial Metals falls below 200-day average
Commercial Metals Co. shares slipped below their 200-day moving average on Wednesday, with the stock trading as low as $66.13 and down about 5% on the session.
Global equities advance, led by a sharp Nikkei jump
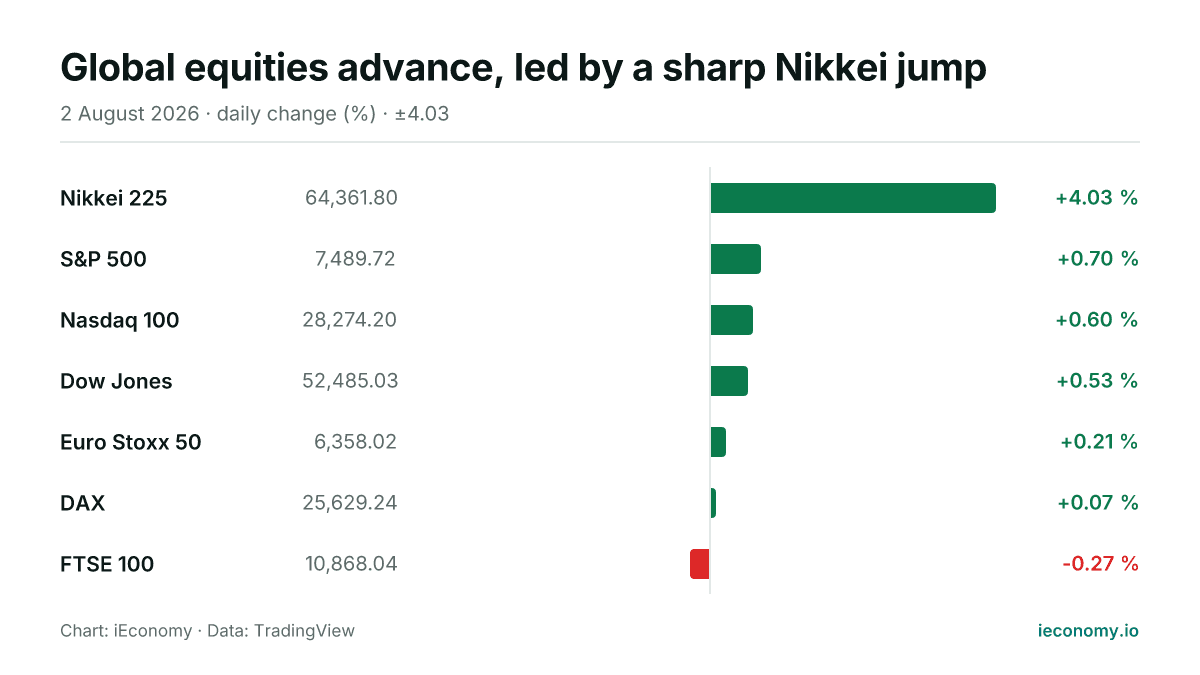
Most major equity benchmarks were higher on the day, with Japan’s Nikkei 225 the clear outlier on the upside. In Europe, gains were modest and London lagged slightly.