S&P 500 slips 0.28% to 7,652.86 as breadth stays firm
The S&P 500 edged lower on Monday, finishing at 7,652.86 after a modest decline of 0.28%. Among the eight tracked constituents, six rose and two fell, with META the strongest and NVDA the weakest.
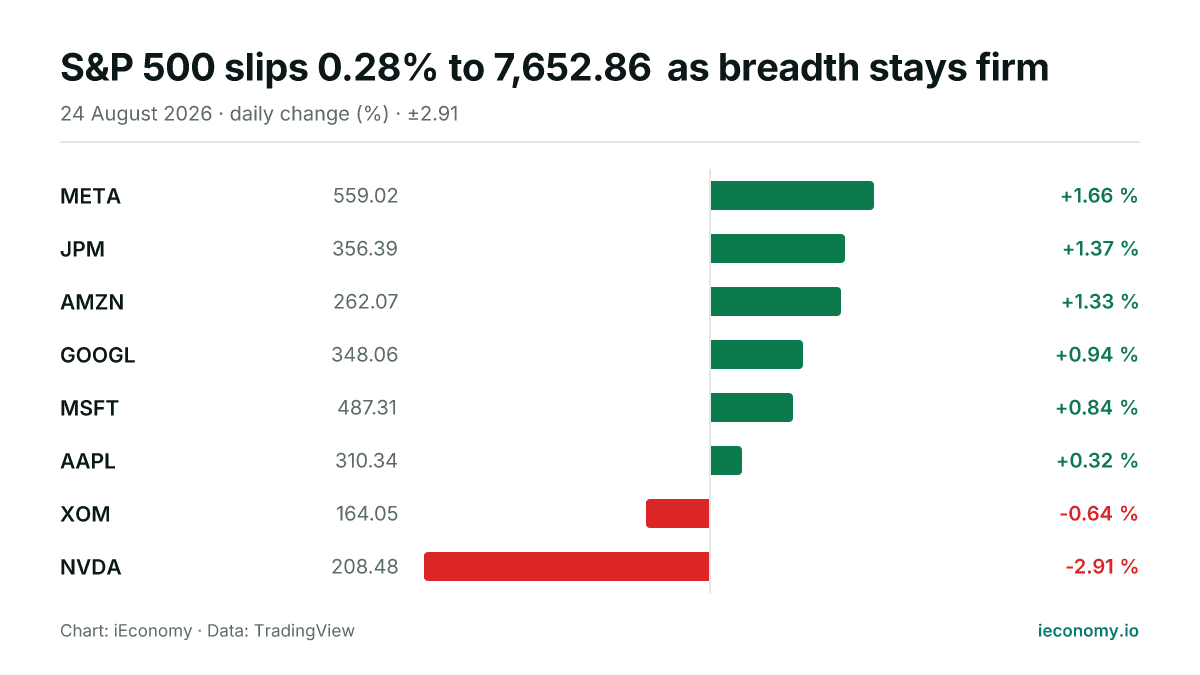
Chart: iEconomy · Data: TradingView
The S&P 500 ended Monday at 7,652.86, down 0.28% on the day. The move was mild rather than disorderly, and the session left the index close to flat even as individual names moved more sharply.
How the index moved and how broad the move was
On the day, six of the eight tracked constituents finished higher and two were lower. That combination points to a market where participation was reasonably broad, even though the index itself drifted down.
| Stock | Last | Change |
|---|---|---|
| META | 559.02 | +1.66 % |
| JPM | 356.39 | +1.37 % |
| AMZN | 262.07 | +1.33 % |
| GOOGL | 348.06 | +0.94 % |
| MSFT | 487.31 | +0.84 % |
| AAPL | 310.34 | +0.32 % |
| XOM | 164.05 | -0.64 % |
| NVDA | 208.48 | -2.91 % |
For index investors, that kind of session usually means the headline move reflects a mix of offsetting stock-level changes rather than a single decisive swing across the whole market. The S&P 500 can fall while most tracked names rise if the weaker names carry enough weight or move enough to offset gains elsewhere.
The standout individual performers
META was the best performer among the tracked names, rising 1.66% to 559.02. Its gain stood out in a session that otherwise lacked a strong directional trend at the index level.
NVDA was the weakest performer, falling 2.91% to 208.48. With only two names down, that decline was still notable, showing how a single heavier or more volatile stock can influence the tone of an otherwise mixed session.
What a long-term investor should take from one session
A single day like this is mostly useful for reading market mechanics, not for drawing conclusions about longer-term direction. Small index moves can hide a wide range of stock-specific outcomes, especially when breadth is uneven but not poor.
For long-term investors, the main lesson is that session noise and underlying participation are not the same thing. An index can edge lower even when most tracked stocks rise, so it is worth separating the headline level from the distribution of returns within the market.
Sources
Related News
S&P 500 edges higher as leadership stays narrow
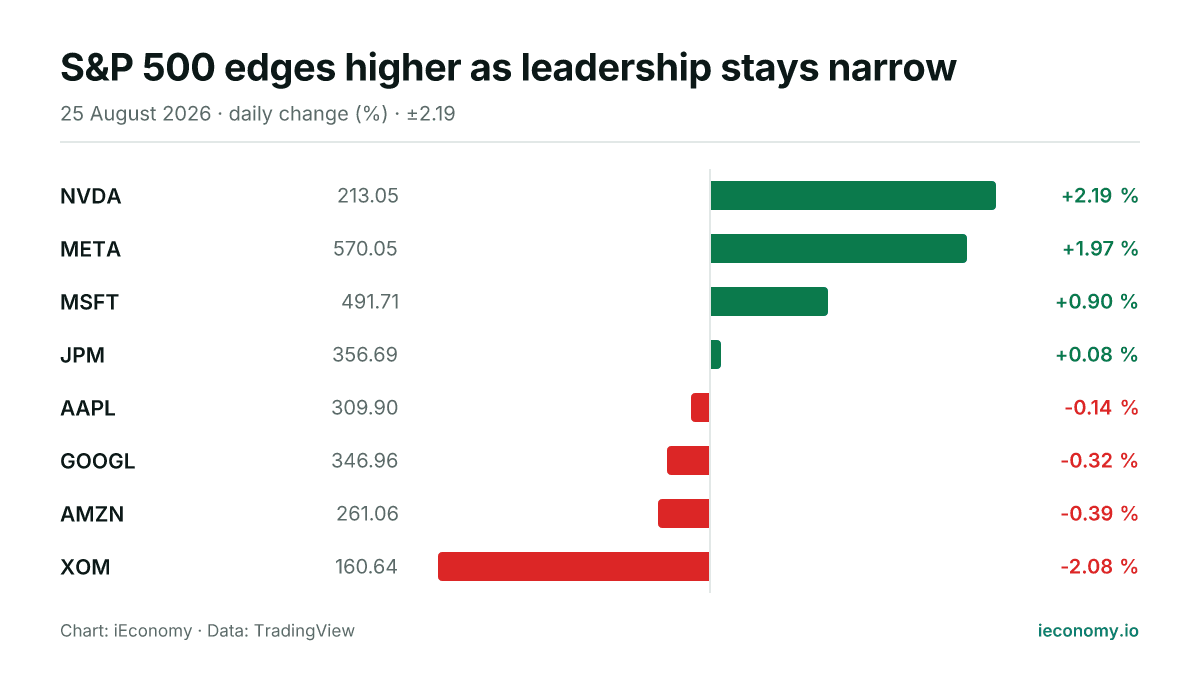
The S&P 500 finished Tuesday at 7,677.28, up 0.32%, with a split showing among the eight tracked constituents. NVDA led the gainers while XOM was the weakest name.
S&P 500 edges higher to 7,674.37 as gains and losses balance
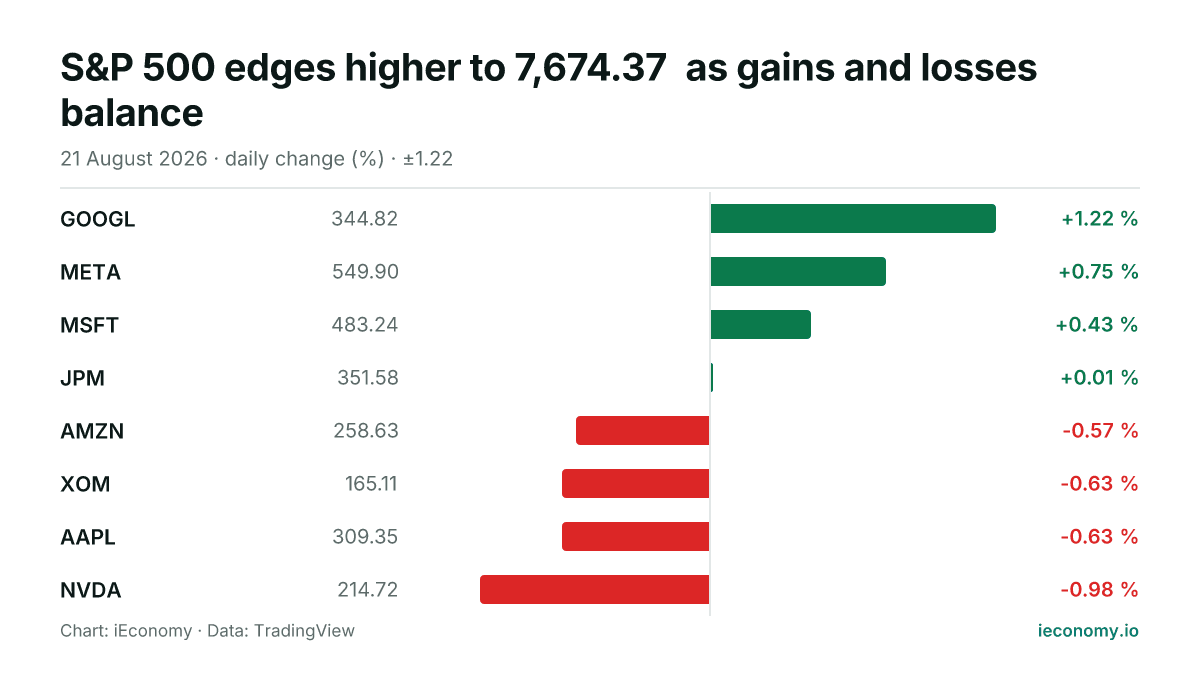
The S&P 500 rose 0.43% to 7,674.37 on Friday. Among the eight tracked constituents, four finished higher and four lower, with GOOGL the strongest and NVDA the weakest.
S&P 500 slips 0.87% as most tracked stocks fall
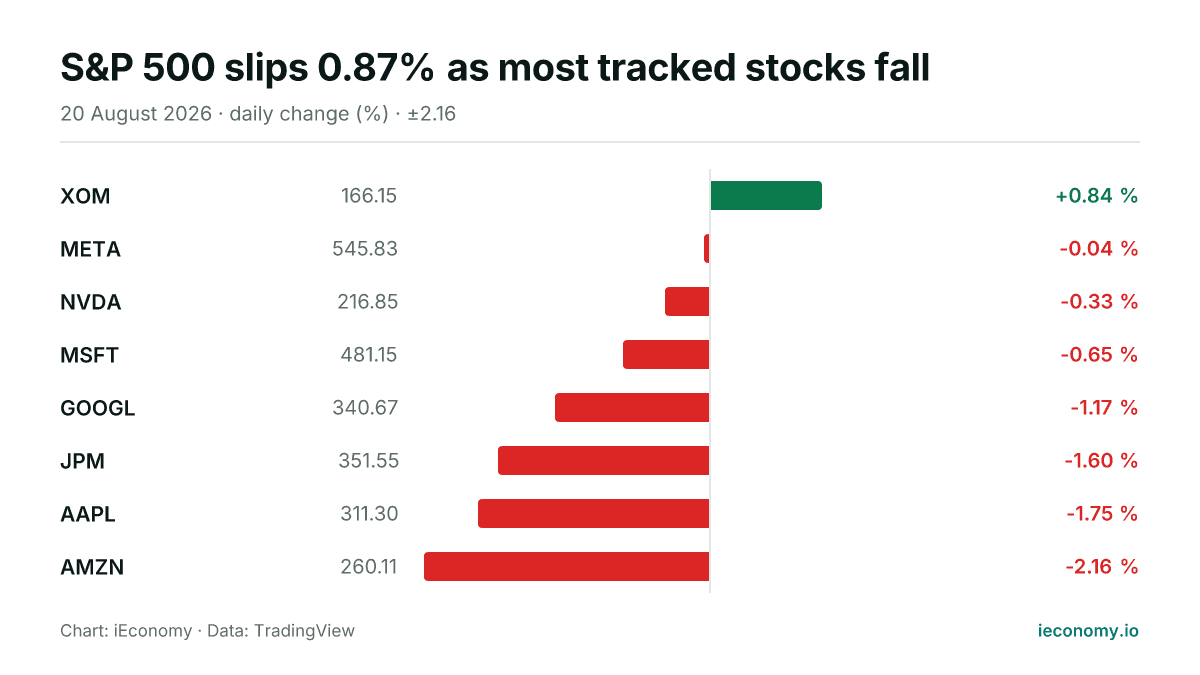
The S&P 500 ended Thursday at 7,641.16, down 0.87% on the session. Among the eight tracked constituents, one finished higher and seven were lower, with AMZN the weakest and XOM the strongest.
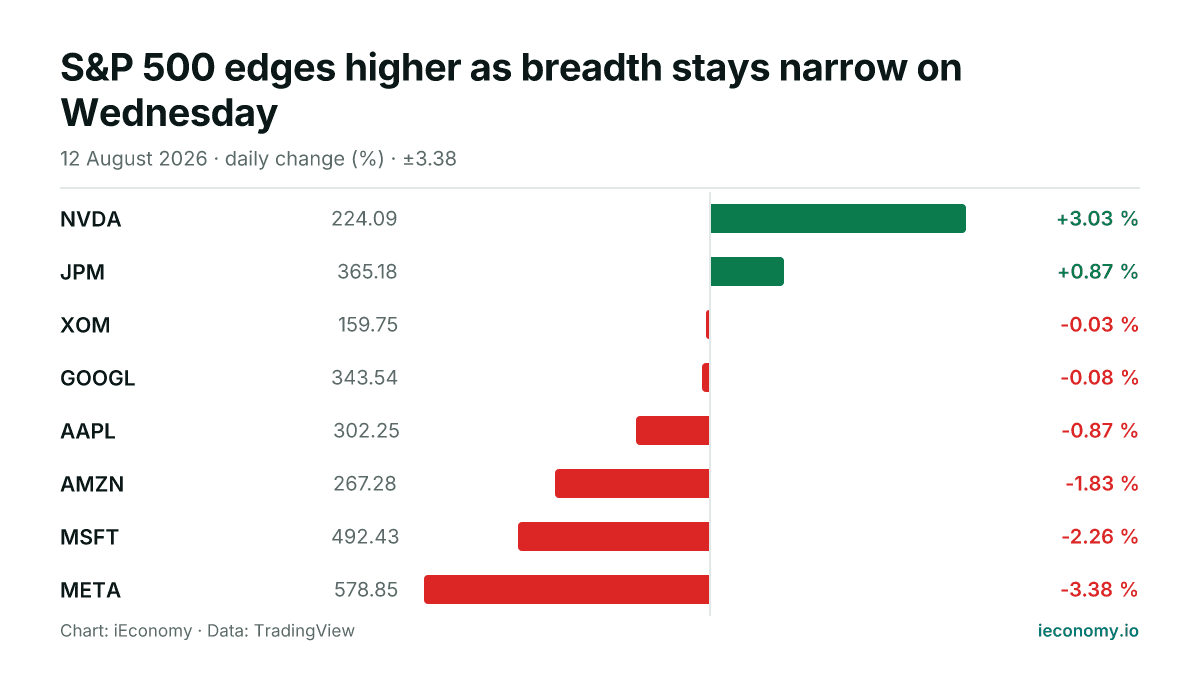
S&P 500 edges higher as breadth stays narrow on Wednesday
The S&P 500 finished Wednesday at 7,748.50, up 0.26%, with only 2 of the 8 tracked constituents rising. NVDA was the strongest performer, while META was the weakest.
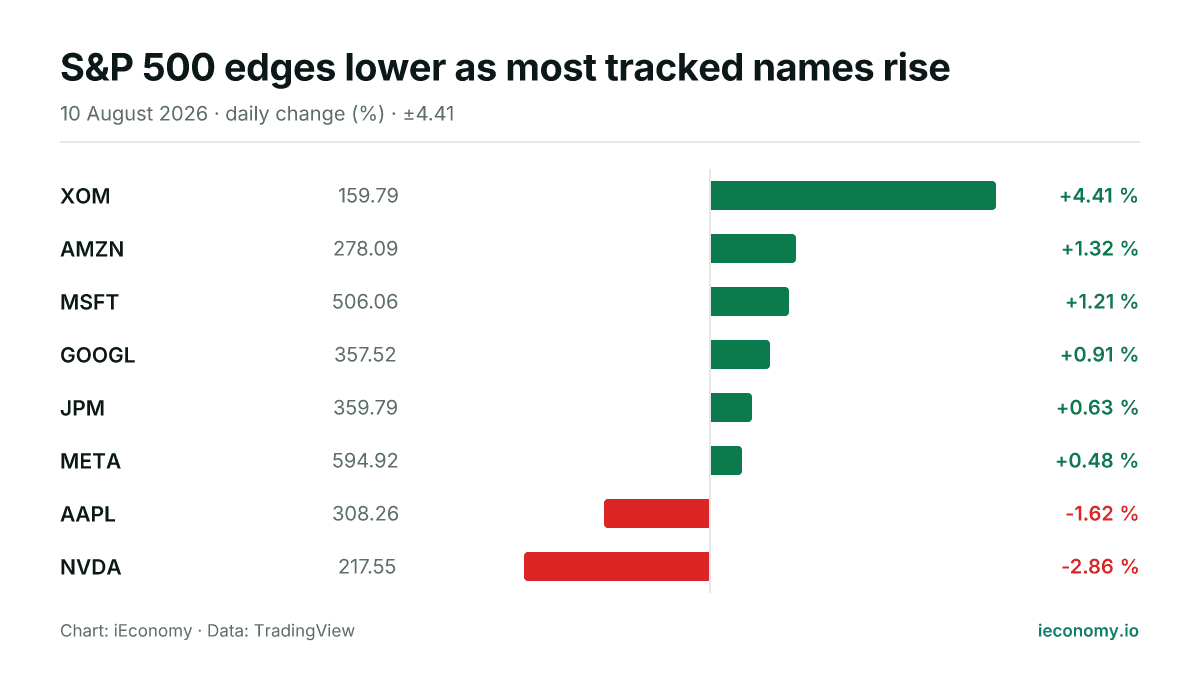
S&P 500 edges lower as most tracked names rise
The S&P 500 closed at 7,753.11 on Monday, down 0.06% as six of the eight tracked constituents finished higher. XOM was the strongest performer, while NVDA was the weakest.
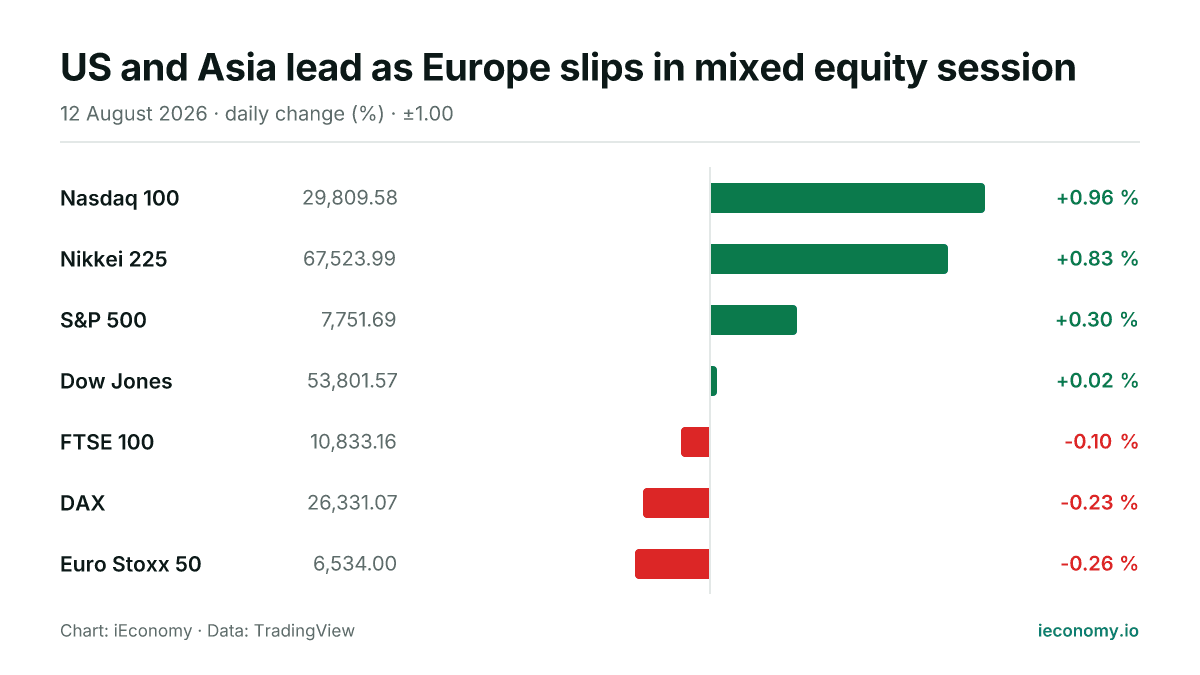
US and Asia lead as Europe slips in mixed equity session
Global shares were mixed on Wednesday, with Wall Street and Japan advancing while major European benchmarks edged lower. The day’s moves were modest in most cases, suggesting a market still trading index by index rather than in one broad direction.