World equities mixed as Asia and Europe outpace US
Asian and European benchmarks edged higher as US indices were mixed in early trading. The moves were modest overall, with the Nikkei 225 leading and the Dow Jones the weakest in the group.
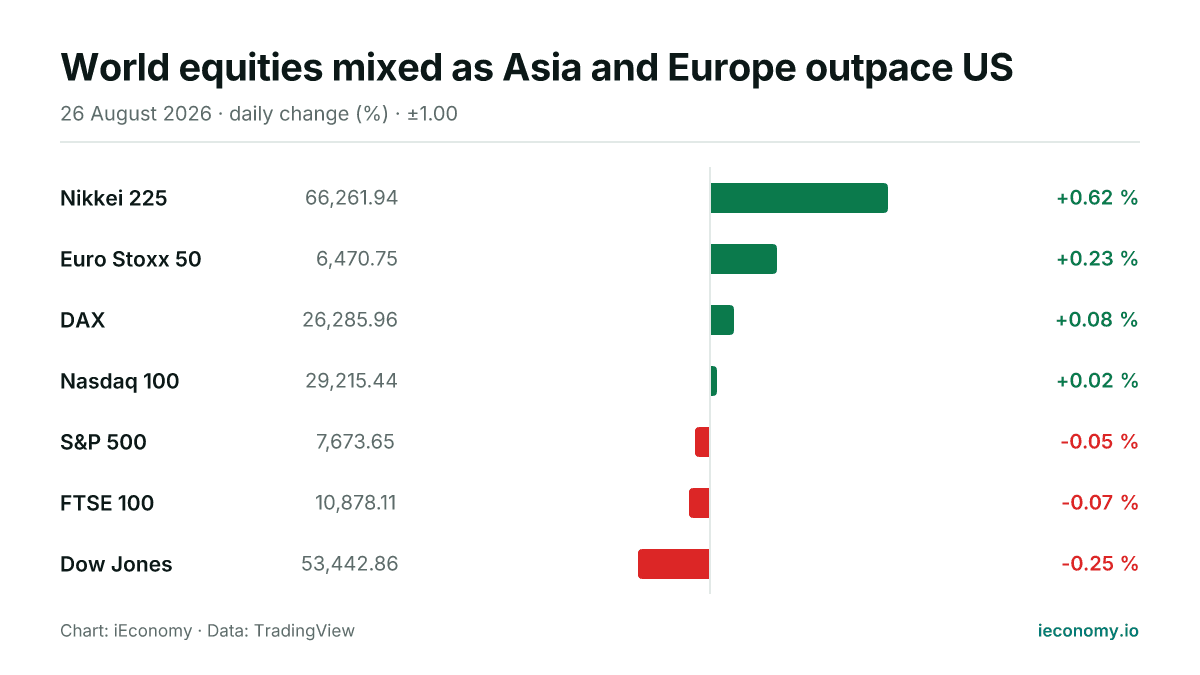
Chart: iEconomy · Data: TradingView
World equity markets were mixed on Wednesday, with four of the seven tracked indices higher and three lower or flat. Asia and Europe broadly outperformed the US, but the day’s moves were modest across the board and did not amount to a clear risk-on or risk-off sweep.
What moved and by how much
The Nikkei 225 led the gainers with a rise of 0.62%, while the Euro Stoxx 50 added 0.23% and the DAX was up 0.08%. In the US, the Nasdaq 100 was marginally higher at 0.02%, but the S&P 500 fell 0.05% and the Dow Jones lost 0.25%.
| Instrument | Last | Change |
|---|---|---|
| Nikkei 225 | 66,261.94 | +0.62 % |
| Euro Stoxx 50 | 6,470.75 | +0.23 % |
| DAX | 26,285.96 | +0.08 % |
| Nasdaq 100 | 29,215.44 | +0.02 % |
| S&P 500 | 7,673.65 | -0.05 % |
| FTSE 100 | 10,878.11 | -0.07 % |
| Dow Jones | 53,442.86 | -0.25 % |
The pattern points to selective strength rather than a broad rally. Small percentage changes at this level usually reflect incremental buying or selling pressure across index constituents, with the more cyclical or tech-heavy benchmarks moving differently from the wider market.
The standouts at each end
At the top of the table, the Nikkei 225 was the clearest outperformer among the tracked benchmarks. Its move was still relatively restrained, which matters because it suggests direction without much sign of disorderly trading.
At the weaker end, the Dow Jones underperformed the pack, while the S&P 500 also slipped slightly. The gap between the strongest and weakest markets was not large, but it was wide enough to show that investors were not bidding all regions and styles in the same way.
What a long-term investor should take from a single day
A single session is mostly about mechanics, not conclusions. When indices move by fractions of a percent, the more useful lesson is that leadership can rotate quickly across regions and sectors even when the overall backdrop looks calm.
For a long-term investor, the main takeaway is that short-term noise can be meaningful for entry points and sentiment, but it should not be confused with a durable trend. Small daily swings also mean portfolio diversification still matters, because different benchmarks can diverge even on the same day.
This article is not investment advice and recommends no asset, level or direction; a single session's move is not evidence of a trend. For background see Markets, Bear Market, BIST 100, and for terms the finance glossary.
Frequently asked questions
Which market was strongest today?
The Nikkei 225 was the strongest of the seven tracked indices, rising 0.62%. It outpaced both European and US benchmarks, although the move was still moderate in absolute terms.
Were US indices broadly weaker?
US performance was mixed rather than uniformly negative. The Nasdaq 100 was slightly higher, while the S&P 500 and Dow Jones were lower, with the Dow showing the larger decline.
How should investors interpret a day like this?
The main point is that market leadership can shift without signalling a lasting change in trend. Daily moves of this size are often driven by rebalancing and sector rotation mechanics, so they are best read alongside longer periods rather than on their own.
Sources
Related News
Global equities rise across US, Europe and Asia
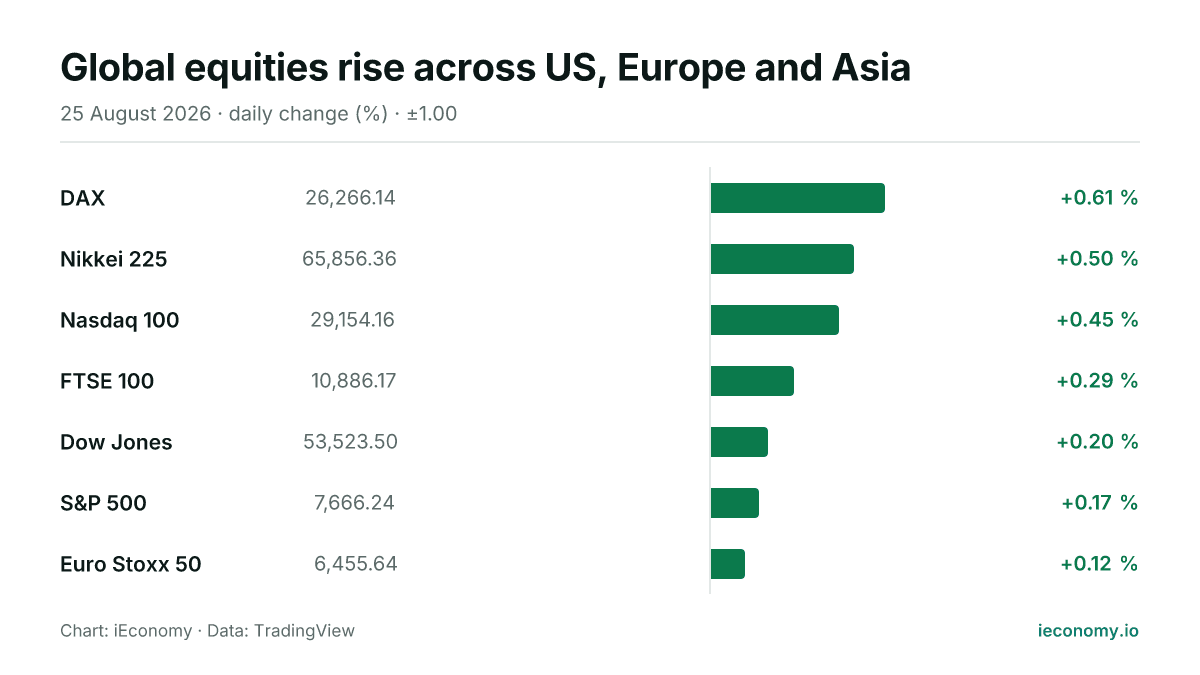
All seven tracked benchmarks were higher on Tuesday, with gains led by Germany’s DAX and Japan’s Nikkei 225. The moves were broadly modest, leaving the day more notable for breadth than for size.
US stocks slip as Asia leads a mixed day
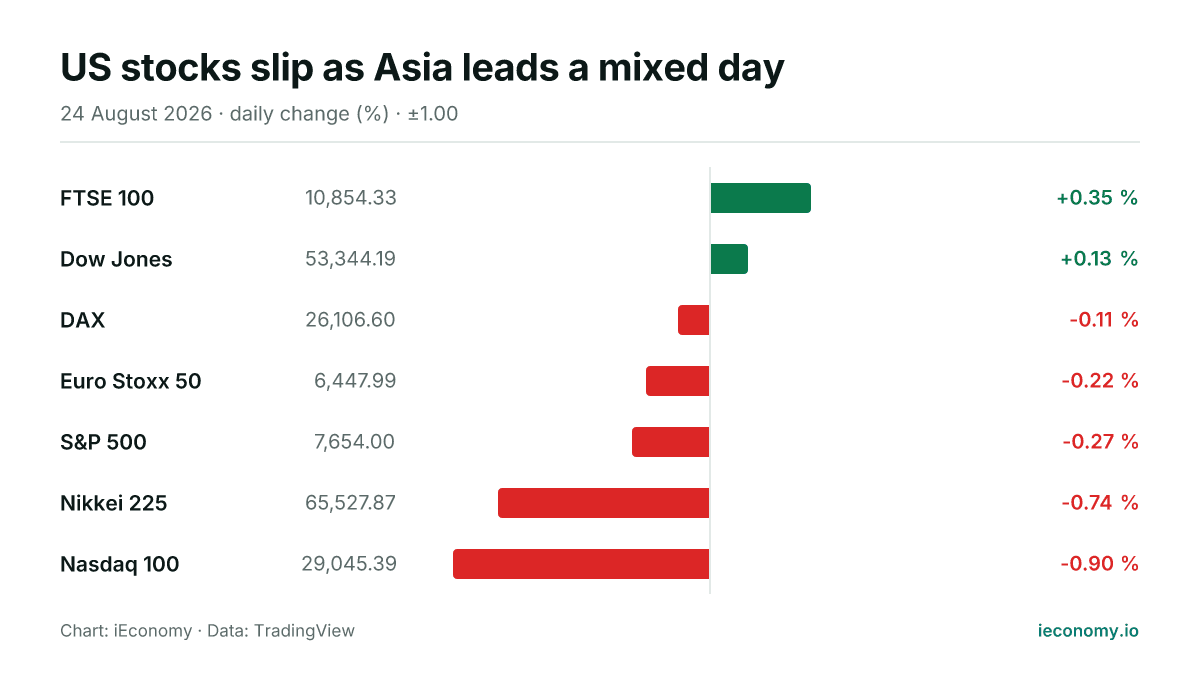
US equities were softer, Europe was broadly lower and Asia fell more sharply, leaving a mixed global tone on Monday. The FTSE 100 and Dow Jones edged higher while the Nikkei 225 and Nasdaq 100 underperformed.
US and European equities advance as Nikkei slips
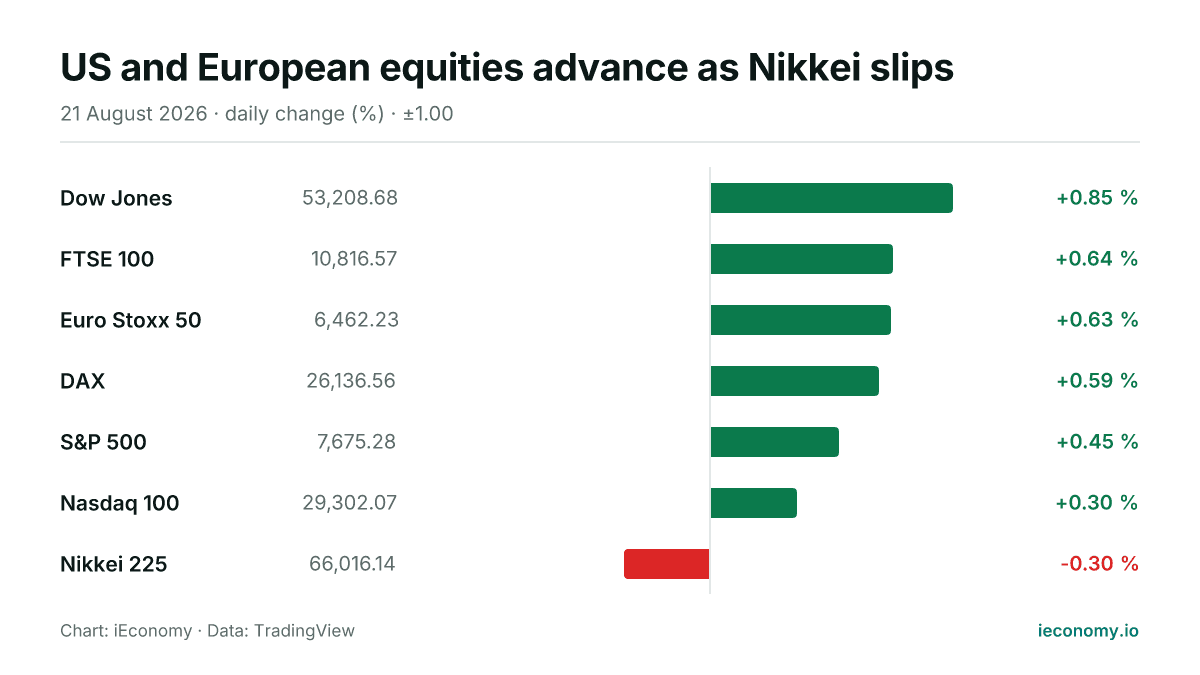
World equity markets were mostly firmer on Friday, with US and European benchmarks higher and Japan's Nikkei 225 lower. The moves were broad but modest, leaving risk appetite positive without being one-directional.
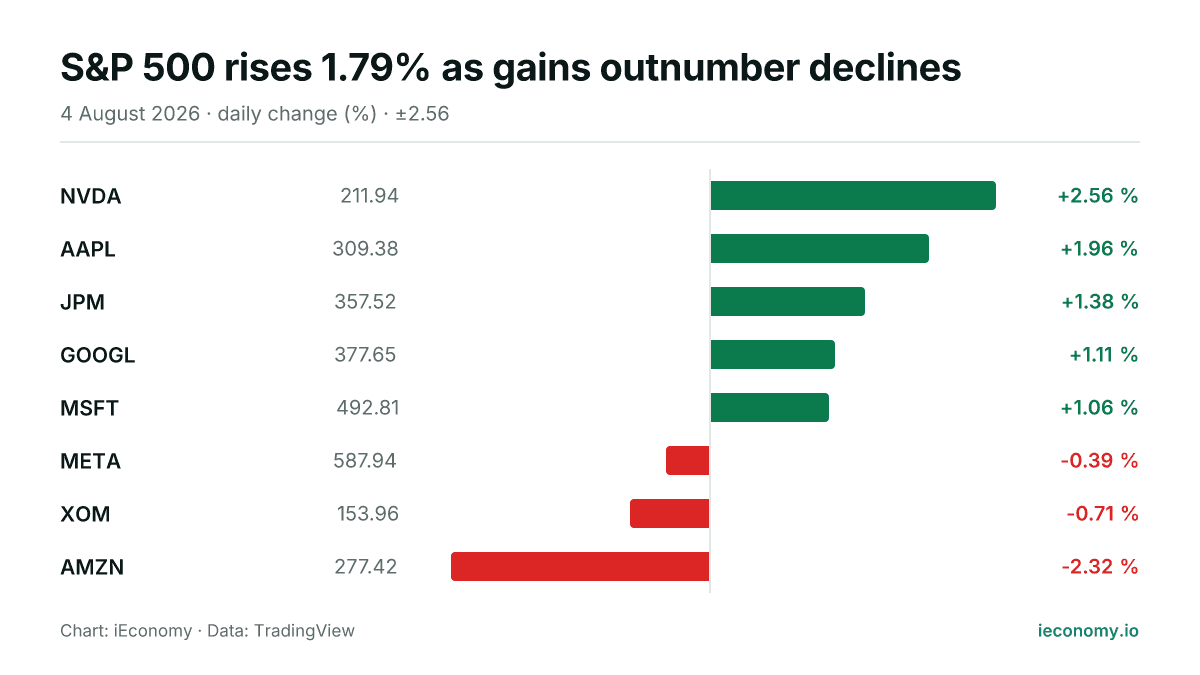
S&P 500 rises 1.79% as gains outnumber declines
The S&P 500 finished Tuesday at 7,736.52, up 1.79%, with five of the eight tracked constituents higher and three lower. NVDA led the day, while AMZN was the weakest performer.
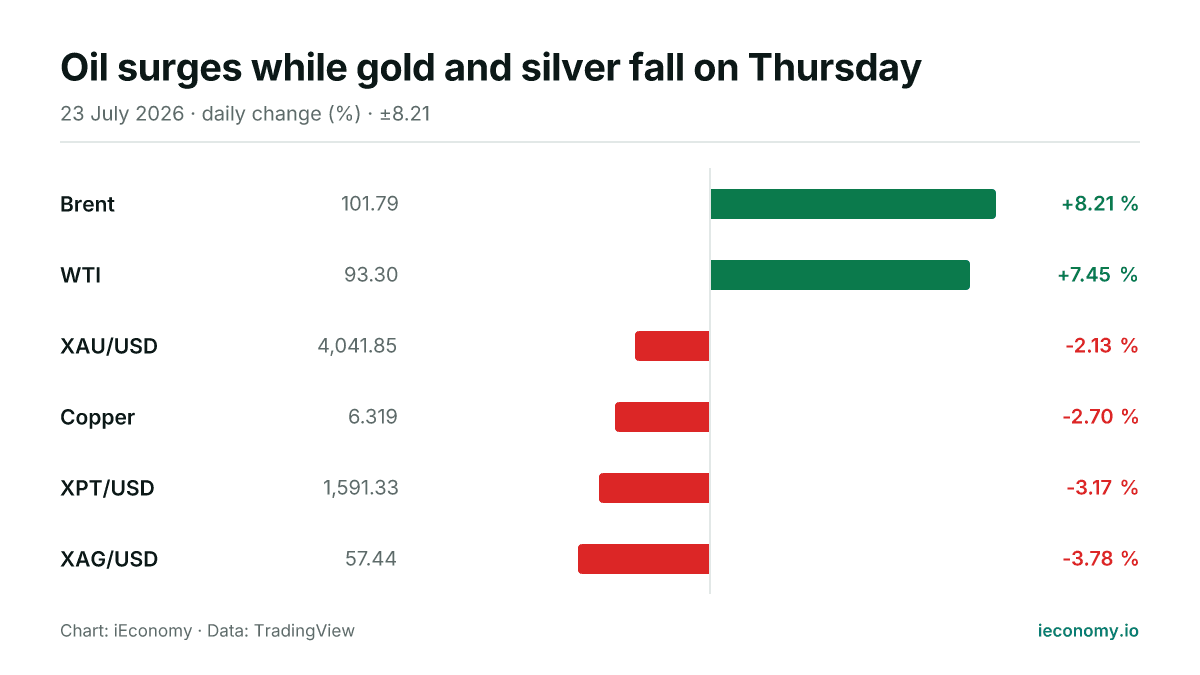
Oil surges while gold and silver fall on Thursday
Crude advanced sharply on the day, while gold and silver moved lower. The moves highlight how commodity prices can shift quickly across asset classes even in a single session.

Oil prices fall as U.S. readies tougher Iran sanctions
Crude futures retreated after last week’s rally as markets awaited fresh U.S. sanctions on Iran and weighed conflicting signals on traffic through the Strait of Hormuz.