Oil surges while gold and silver fall on Thursday
Crude advanced sharply on the day, while gold and silver moved lower. The moves highlight how commodity prices can shift quickly across asset classes even in a single session.
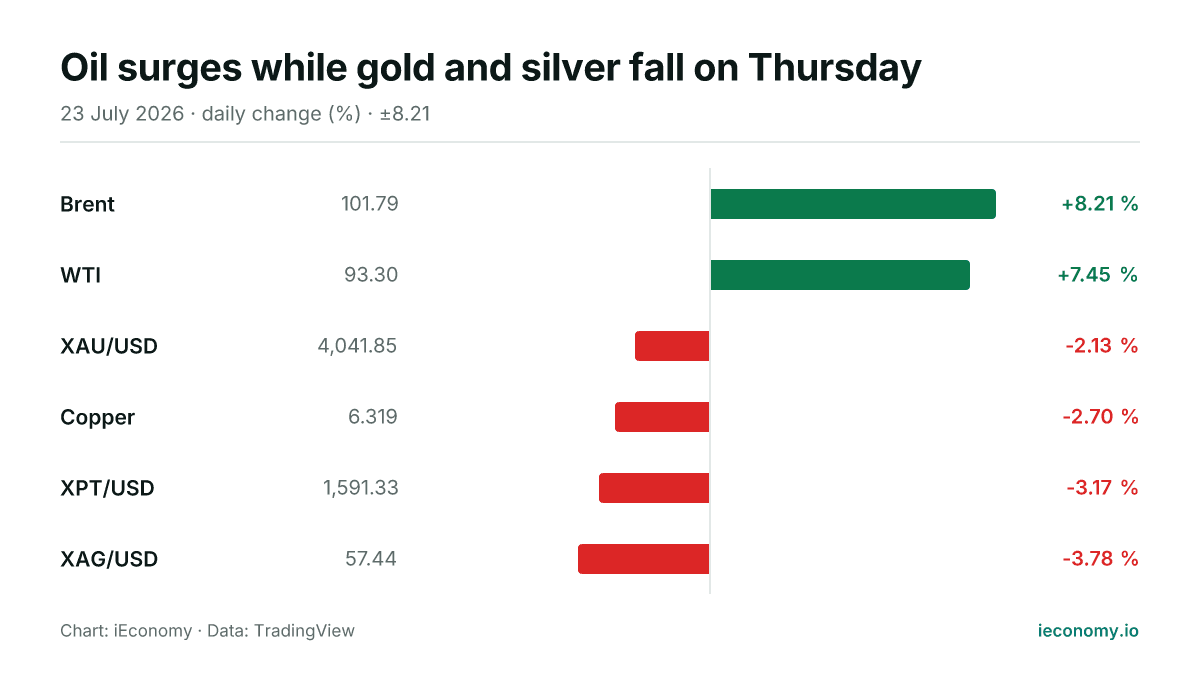
Chart: iEconomy · Data: TradingView
Commodity markets were split on Thursday, 2026-07-23, with crude oil advancing sharply while gold and silver traded lower. Of the six instruments tracked, two were higher and four were lower or flat, underscoring how quickly sentiment can diverge across metals and energy in the same session.
What moved and by how much
Brent rose 8.21% to 101.79 and WTI gained 7.45% to 93.30, making energy the clear outperformer in the digest. By contrast, XAU/USD slipped 2.13% to 4,041.85, while XAG/USD fell 3.78% to 57.44. Copper also eased 2.70%, and XPT/USD declined 3.17%. The mechanics are straightforward: when one part of the commodity complex moves strongly, relative value within the basket can change fast even if the broader theme remains mixed.
| Instrument | Last | Change |
|---|---|---|
| Brent | 101.79 | +8.21 % |
| WTI | 93.30 | +7.45 % |
| XAU/USD | 4,041.85 | -2.13 % |
| Copper | 6.319 | -2.70 % |
| XPT/USD | 1,591.33 | -3.17 % |
| XAG/USD | 57.44 | -3.78 % |
The standouts at each end
Brent was the strongest mover in percentage terms, followed closely by WTI, and both finished materially higher on the day. On the weaker side, silver posted the steepest decline among the metals in the digest, while gold also lost ground. That combination left precious metals under pressure at the same time as crude oil rallied, a reminder that these markets do not necessarily trade in lockstep.
What a long-term investor should take from one day
For longer-term holders, a single session mainly shows how prices can reprice around positioning, liquidity and shifting risk appetite, without proving a durable trend. A one-day move in either direction can be amplified by the mechanics of futures and spot trading, especially when volatility picks up. The key takeaway is to treat the day’s action as information about market behaviour, not as a standalone signal about the medium-term direction of gold, silver or crude oil.
Sources
Related News
Gold and silver slip as crude edges higher
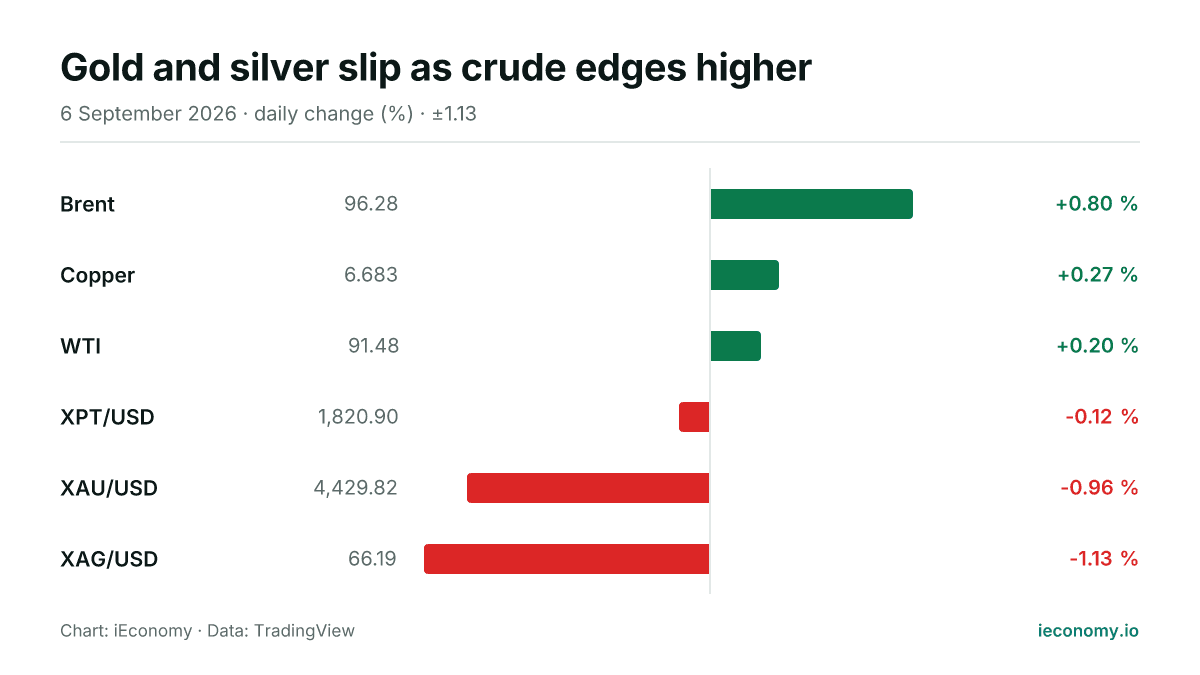
Gold and silver were weaker on Sunday while Brent and WTI posted gains. The session showed a broad split across the metals and oil complex, with one-day moves that matter for positioning but not for long-term conclusions.
Gold and silver slide as crude edges higher
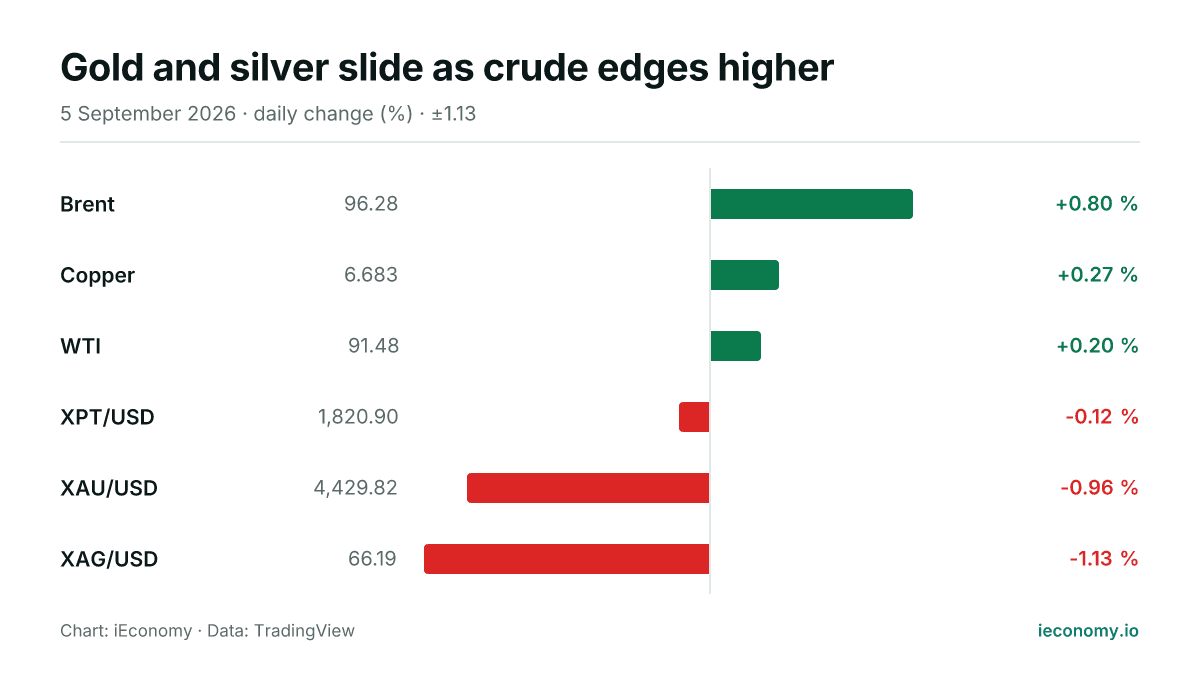
Gold and silver weakened on Saturday while Brent and WTI moved higher, leaving the complex mixed across six tracked contracts. The day’s moves were modest in crude and sharper in precious metals, with risk still tied to intraday trading conditions.
Oil jumps while gold and silver fall on the day
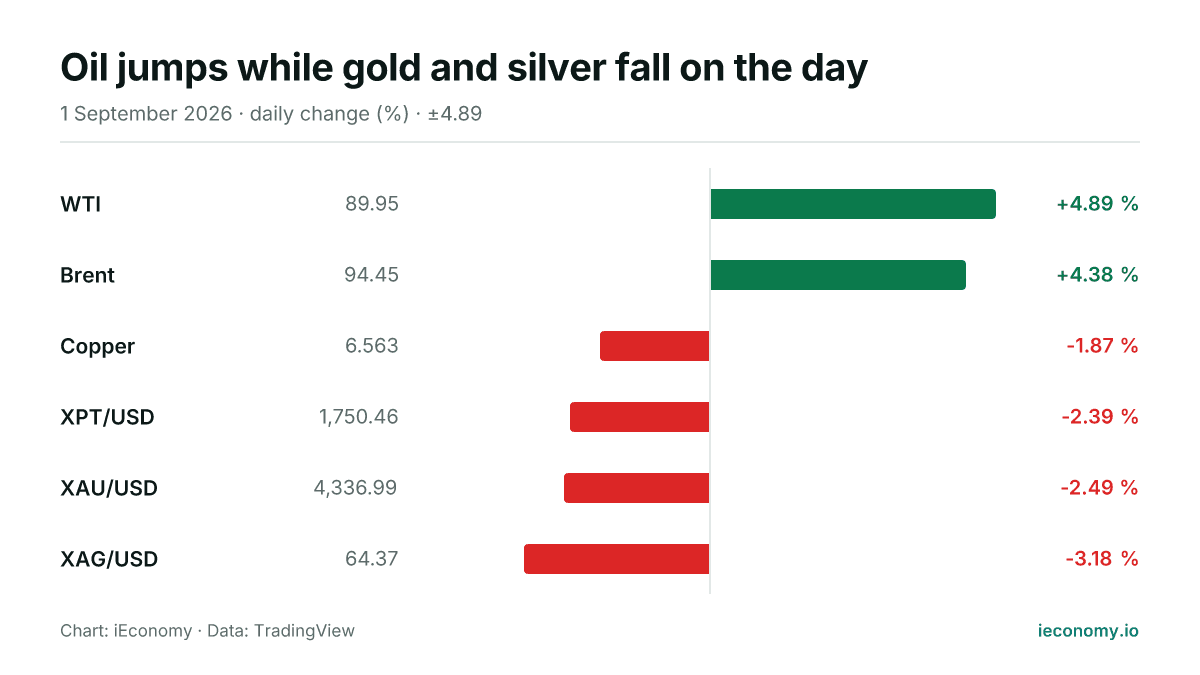
Crude oil rose sharply on Tuesday, while gold and silver retreated and copper also eased. The move left only two of six tracked commodities higher, underscoring a broad split in the day’s price action.
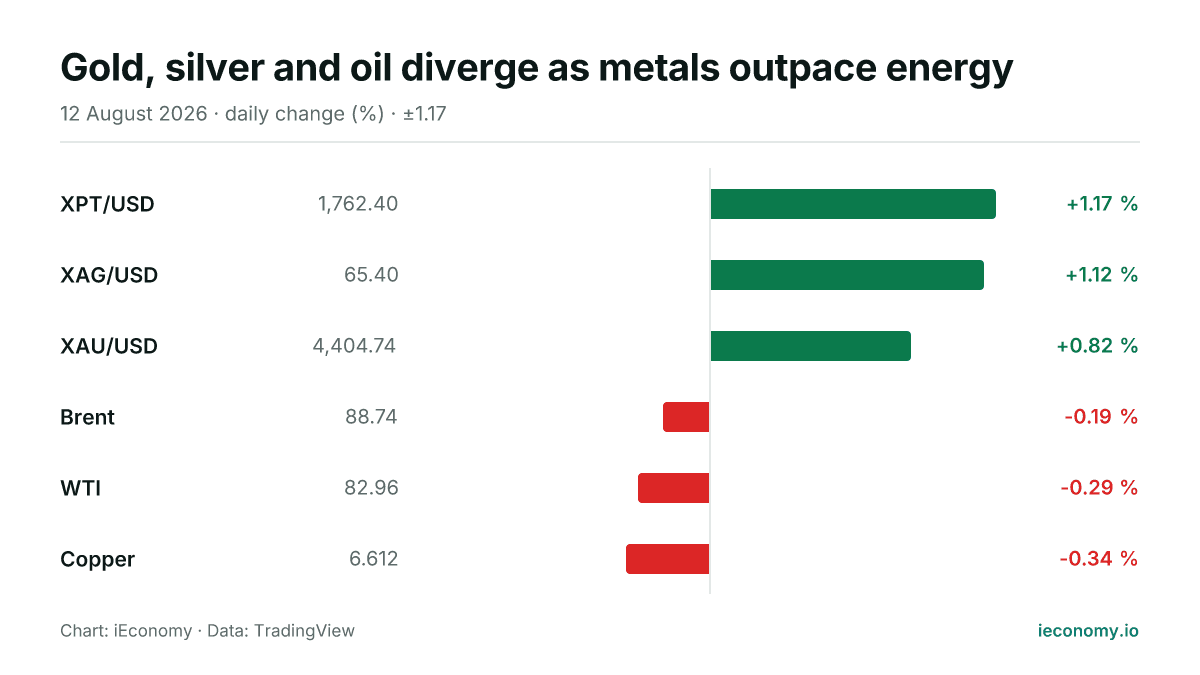
Gold, silver and oil diverge as metals outpace energy
Gold, silver and platinum advanced on Wednesday, while Brent and WTI edged lower alongside copper. The day’s moves left precious metals firmly ahead of crude, with no single session telling the whole story.
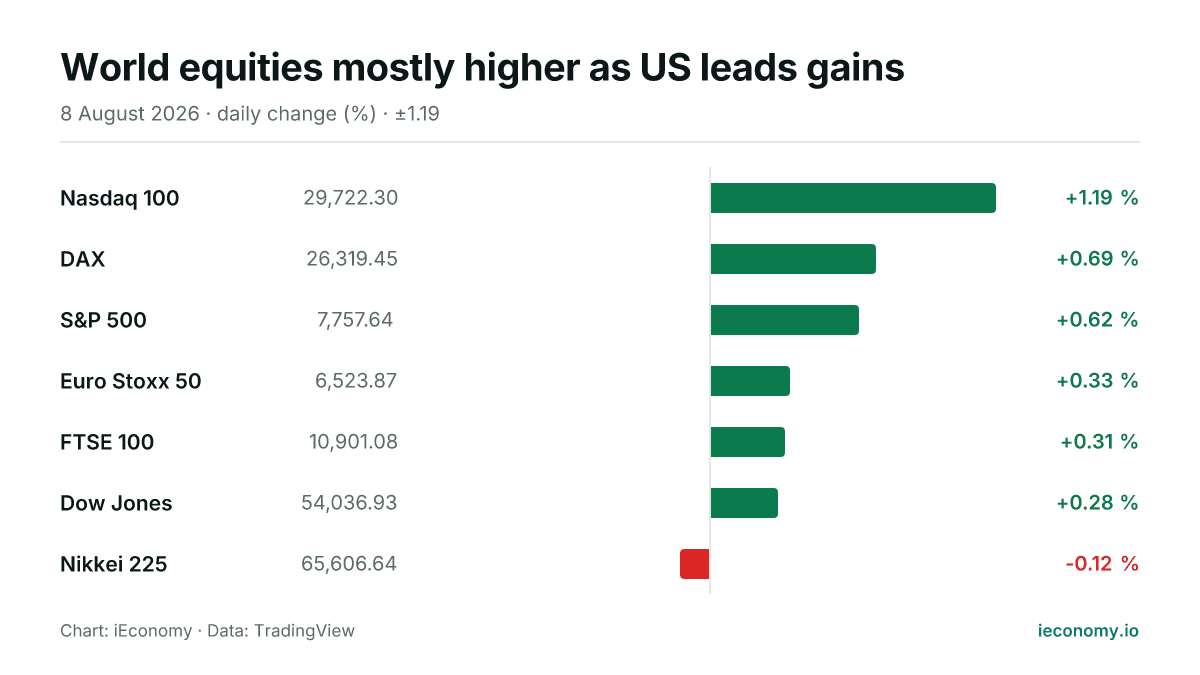
World equities mostly higher as US leads gains
Global stock markets were broadly firmer on Saturday, with six of seven tracked indices in positive territory. The Nasdaq 100 outperformed, while the Nikkei 225 was the only major gauge to edge lower.
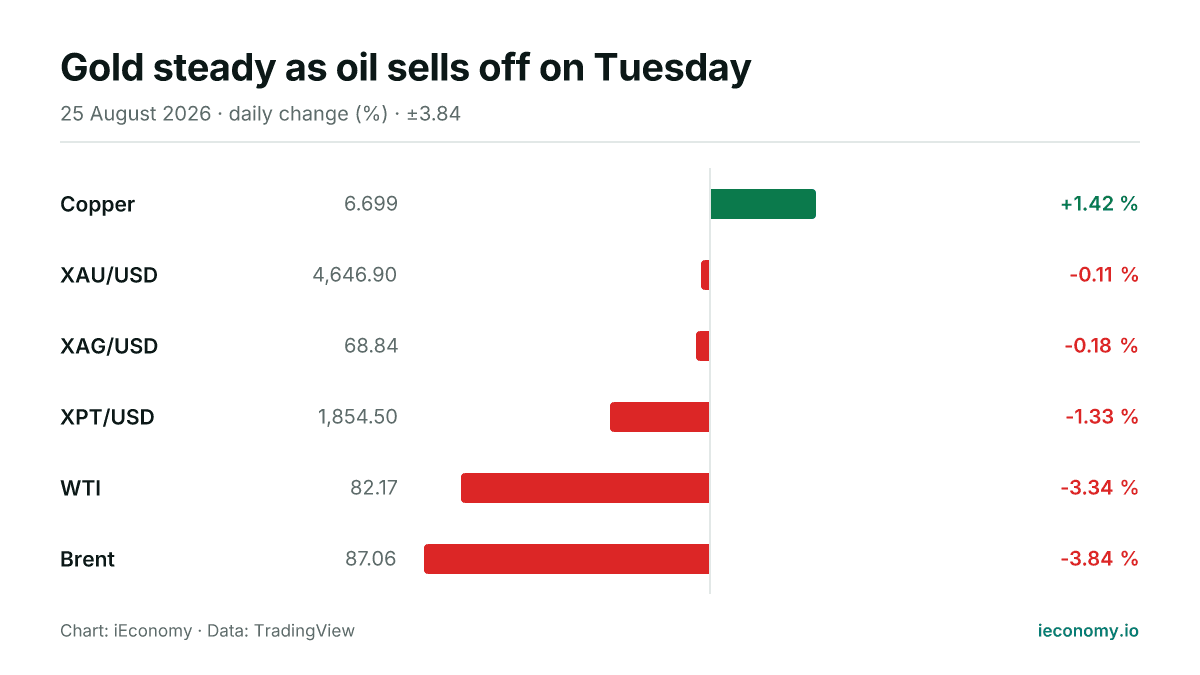
Gold steady as oil sells off on Tuesday
Gold and silver were little changed on Tuesday, while crude oil fell sharply and copper led the small group of gainers. The session left most tracked commodities lower or flat, with one clear outperformer.