First Majestic Silver slips below 200-day average
First Majestic Silver fell below its 200-day moving average on Friday, with the stock trading as low as $19.43 after touching a key technical level at $19.85.

First Majestic Silver Corp. fell below a closely watched technical marker on Friday, after its shares moved under the 200-day moving average of $19.85. The stock traded as low as $19.43 during the session and was down about 3% at the time of the market update.
Technical level in focus
The move puts the silver producer back beneath a trend gauge many traders use to judge longer-term momentum. A break below the 200-day average does not change the business itself, but it often draws attention from market participants who track chart signals alongside fundamentals.
For First Majestic, the session showed weakness in the shares rather than a broad company-specific announcement. The slide came in ordinary trading, and the low of $19.43 marked a clear breach of the average that had stood at $19.85.
What the move signals for traders
Technical breaches like this can matter because they are visible to both momentum traders and risk managers. When a stock slips below a major moving average, it can prompt tighter monitoring of position size, support levels and whether selling pressure is building or fading.
The 200-day moving average is one of the most common reference points in equity trading because it smooths out short-term noise. Stocks holding above it are often viewed as having stronger intermediate-term trends, while those trading below it may be seen as weaker in the near term.
In this case, the move leaves First Majestic in a softer technical position after a day of declines. Investors watching the shares will now likely focus on whether the stock can recover back above the average or whether it continues to trade below that level.
The latest move does not provide a broader fundamental verdict on the company, but it does underline how quickly sentiment can shift around a key chart threshold. For a stock tied to precious metals, that can add another layer of volatility on top of the sector's usual swings.
This article is not investment advice and recommends no asset, level or direction; a single session's move is not evidence of a trend. For background see Markets, Bear Market, BIST 100, and for terms the finance glossary.
Frequently asked questions
What happened to First Majestic Silver shares?
The shares fell below their 200-day moving average on Friday and traded as low as $19.43.
What was the 200-day moving average level?
It was $19.85.
How much were the shares down?
They were trading down about 3% on the day.
Sources
Related News

ASM falls below its 200-day moving average
Avino Silver & Gold Mines slipped beneath its 200-day moving average on Friday, touching an intraday low of $6.43 as the stock traded lower by about 9.5%.
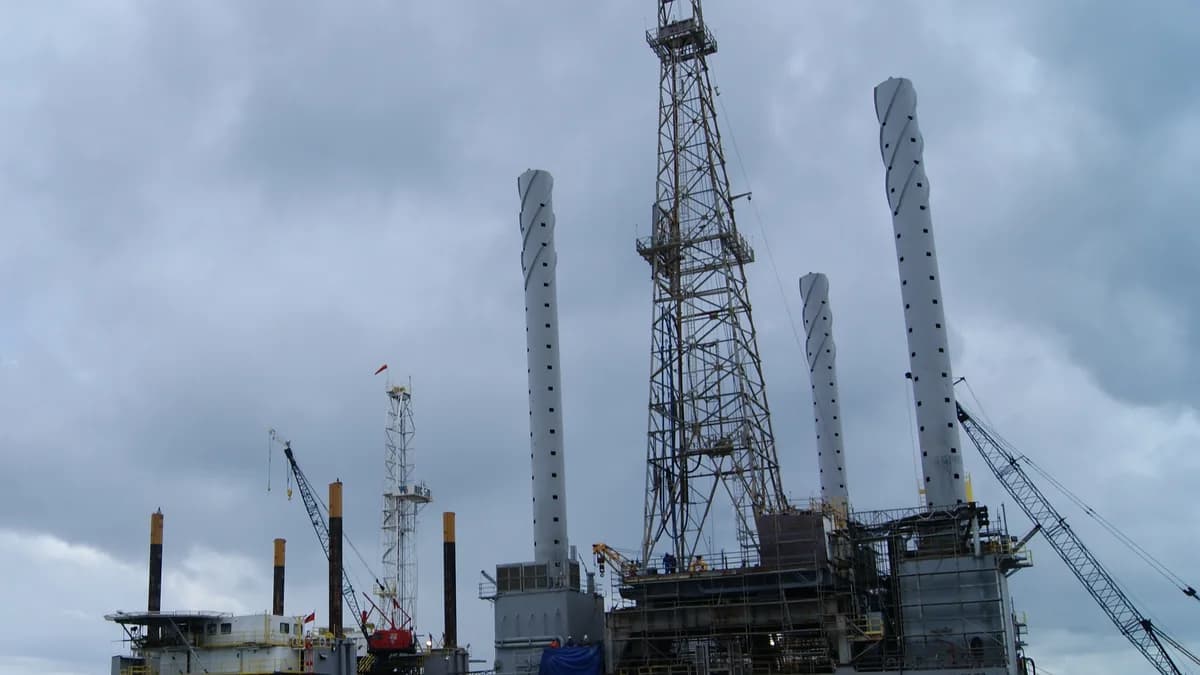
Crude Oil Slumps on Hormuz Easing Bets
Oil prices fell after reports of possible talks aimed at cooling the Gulf crisis and traders locked in gains from a sharp weekly rally, with WTI sliding below $100 a barrel.

S&P 500 rises 0.86% to 7,656.98 as 7 of 8 stocks advance
The S&P 500 finished higher on Friday, with a broad majority of the tracked constituents in positive territory. AMZN led the group, while NVDA was the only decliner among the eight names monitored.
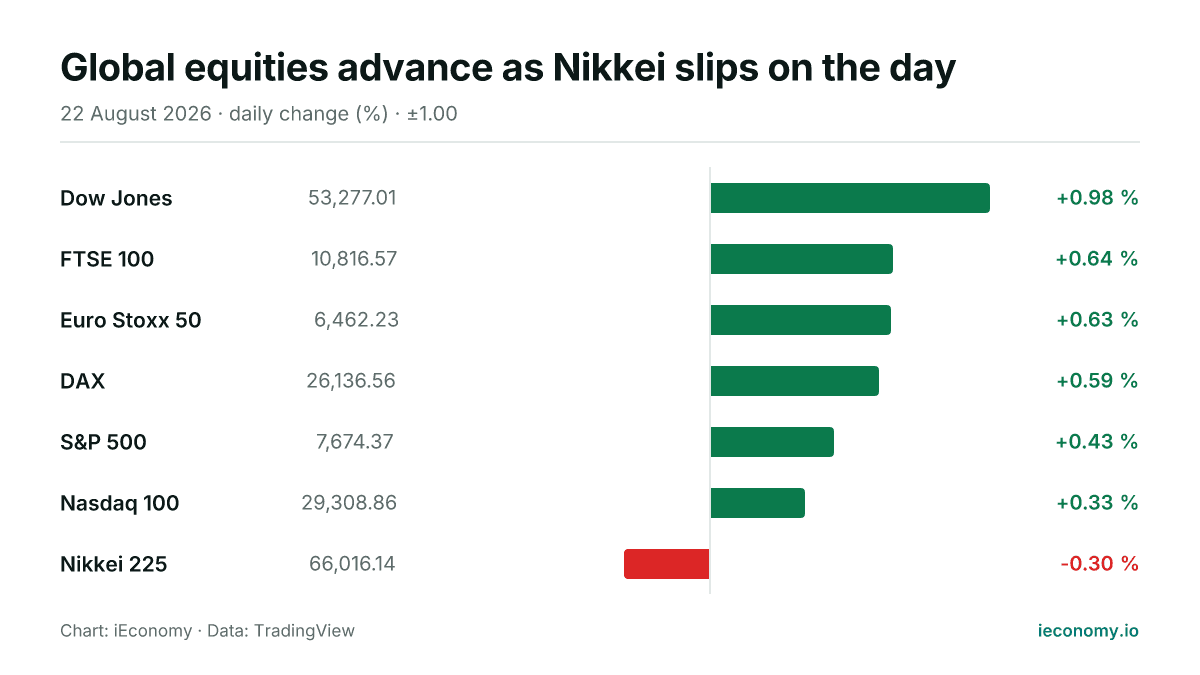
Global equities advance as Nikkei slips on the day
Most major US and European indices moved higher on Saturday, with the Dow Jones leading the gains. In Asia, the Nikkei 225 was the only decliner among the benchmarks tracked.
AngloGold Ashanti Shares Move Above 200-Day Average
AngloGold Ashanti shares traded above their 200-day moving average, with the stock also rising sharply in Thursday and Friday trading sessions.

Alamos Gold Breaks Above 200-Day Moving Average
Shares of Alamos Gold Inc. (AGI) crossed above their key 200-day moving average of $38.91 on Tuesday, trading as high as $39.10 and signaling potential technical strength.