Global equities slip across US, Europe and Japan
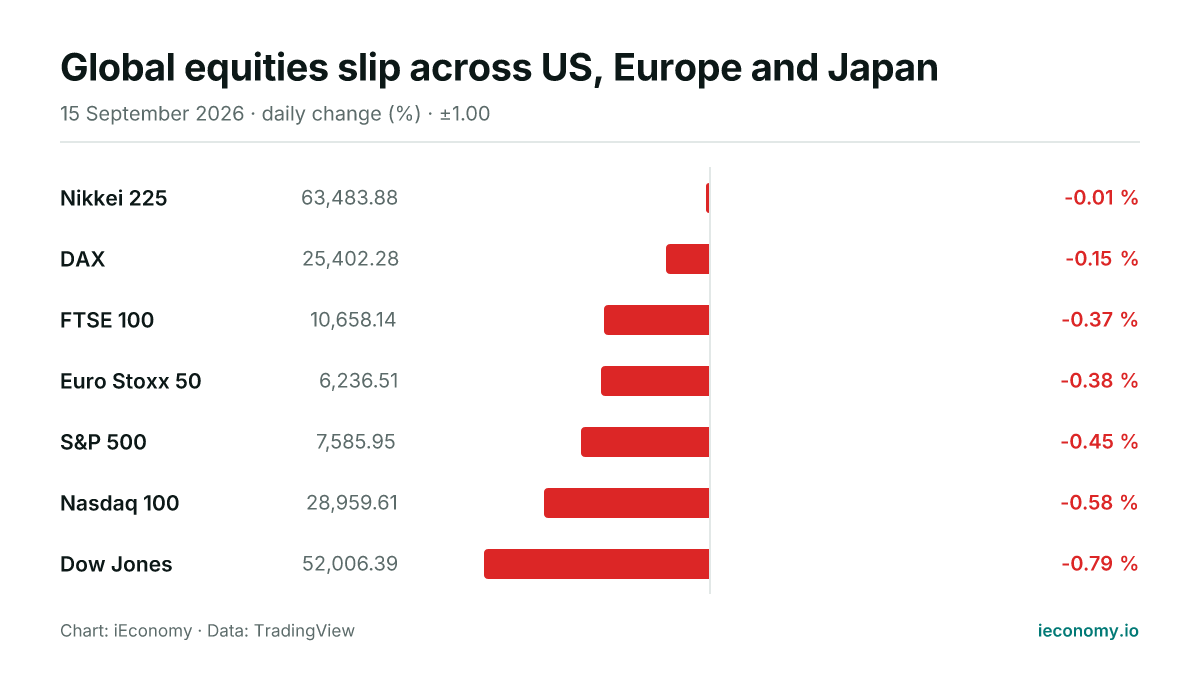
All seven tracked equity benchmarks were lower or flat on Tuesday, with declines led by US stocks and only a near-flat move in Japan. The day left no region in positive territory.

Alavisan / Wikimedia Commons (cc0)
Global equity markets were broadly softer on Tuesday, with all seven tracked benchmarks lower or flat. The heaviest declines came from the US, while Europe also lost ground and Japan was little changed.
What moved and by how much
The S&P 500 fell 0.45%, the Nasdaq 100 declined 0.58% and the Dow Jones lost 0.79%, leaving US equities the weakest cluster in the digest. In Europe, the Euro Stoxx 50 slipped 0.38%, the FTSE 100 fell 0.37% and the DAX eased 0.15%.
| Instrument | Last | Change |
|---|---|---|
| Nikkei 225 | 63,483.88 | -0.01 % |
| DAX | 25,402.28 | -0.15 % |
| FTSE 100 | 10,658.14 | -0.37 % |
| Euro Stoxx 50 | 6,236.51 | -0.38 % |
| S&P 500 | 7,585.95 | -0.45 % |
| Nasdaq 100 | 28,959.61 | -0.58 % |
| Dow Jones | 52,006.39 | -0.79 % |
Asia was steadier but still negative, with the Nikkei 225 down 0.01%. The picture across the session was therefore one of modest but widespread selling, rather than a single sharp regional break.
The standouts at each end
The smallest move was in the Nikkei 225, which was almost unchanged and finished just below flat. At the other end, the Dow Jones posted the largest decline among the tracked benchmarks, down 0.79%.
Within Europe, the DAX outperformed its regional peers by falling less than the FTSE 100 and Euro Stoxx 50. That relative ordering matters because index composition can amplify or dampen the same day’s pressure across sectors and geographies.
What a long-term investor should take from one day
A single session like this is best read as a snapshot of positioning and risk appetite, not a thesis in itself. When all major regions are down together, the mechanics usually point to broad de-risking, index rebalancing, or a general pullback in demand for equities, without requiring a single identifiable trigger.
For long-term investors, the main takeaway is that even large-cap indices can move together in the same direction over short horizons. The absence of any gain among the seven tracked markets also underlines that diversification reduces, but does not eliminate, day-to-day volatility.
This article is not investment advice and recommends no asset, level or direction; a single session's move is not evidence of a trend. For background see Markets, Bear Market, BIST 100, and for terms the finance glossary.
Frequently asked questions
Did any of the tracked indices rise on Tuesday?
No. All seven tracked benchmarks were lower or flat, and none finished in positive territory. That makes the session a broad negative day rather than a mixed one.
Which market was weakest?
The Dow Jones had the largest decline in the digest, falling 0.79%. The S&P 500 and Nasdaq 100 also lost ground, showing that the weakness extended across the US large-cap complex.
Why should investors care about a one-day move?
One day does not define a trend, but it can show how correlations behave when risk appetite softens. For portfolio holders, the value lies in understanding how quickly broad market sentiment can affect different regions and index styles at the same time.
Sources
Related News
World equities mixed as Europe edges up, US slips
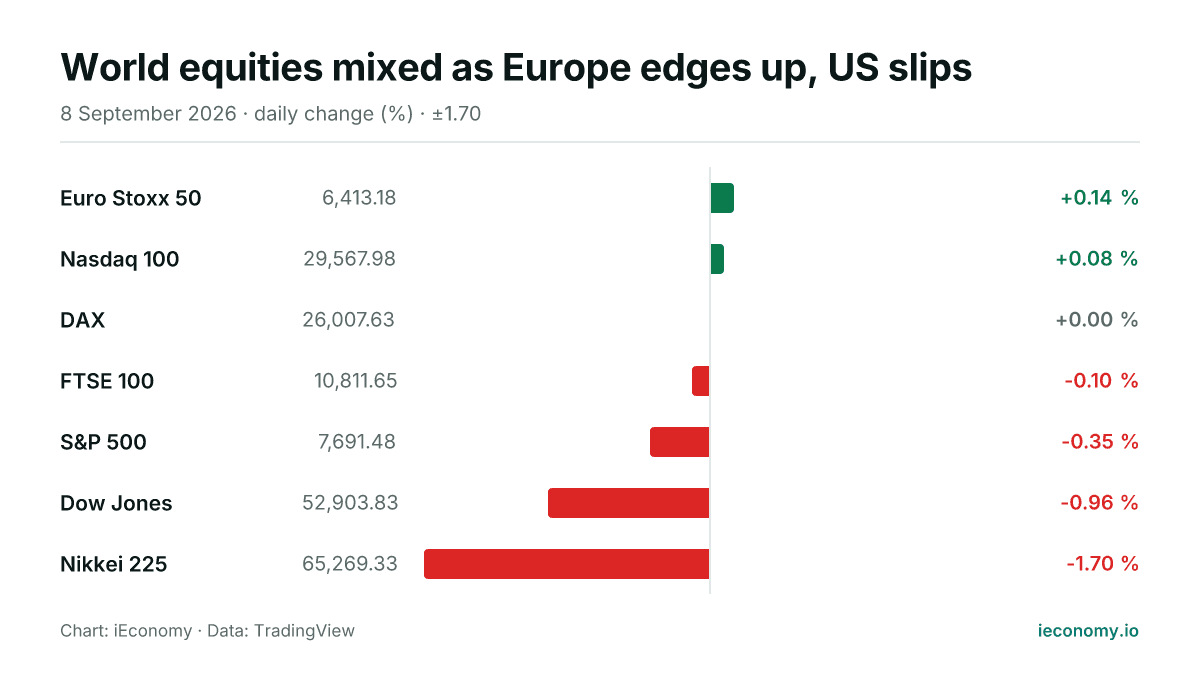
European shares were modestly firmer, US indices were mixed to lower, and Tokyo lagged. The day’s moves were small in much of Europe but sharper in the US and Japan, showing uneven risk appetite.

World equities edge lower as Europe lags Asian trade
US stock benchmarks were lower in early trade while Europe and Asia also weakened, leaving only the FTSE 100 in positive territory. The move was broad rather than dramatic, with one modest gain against six declines.

US and Europe rise as Nikkei lags on Sunday
Most major equity benchmarks advanced on Sunday, with gains spread across the US and Europe. Asia was mixed, and the Nikkei 225 stood out on the downside.
Oil leads commodity gains as gold edges higher
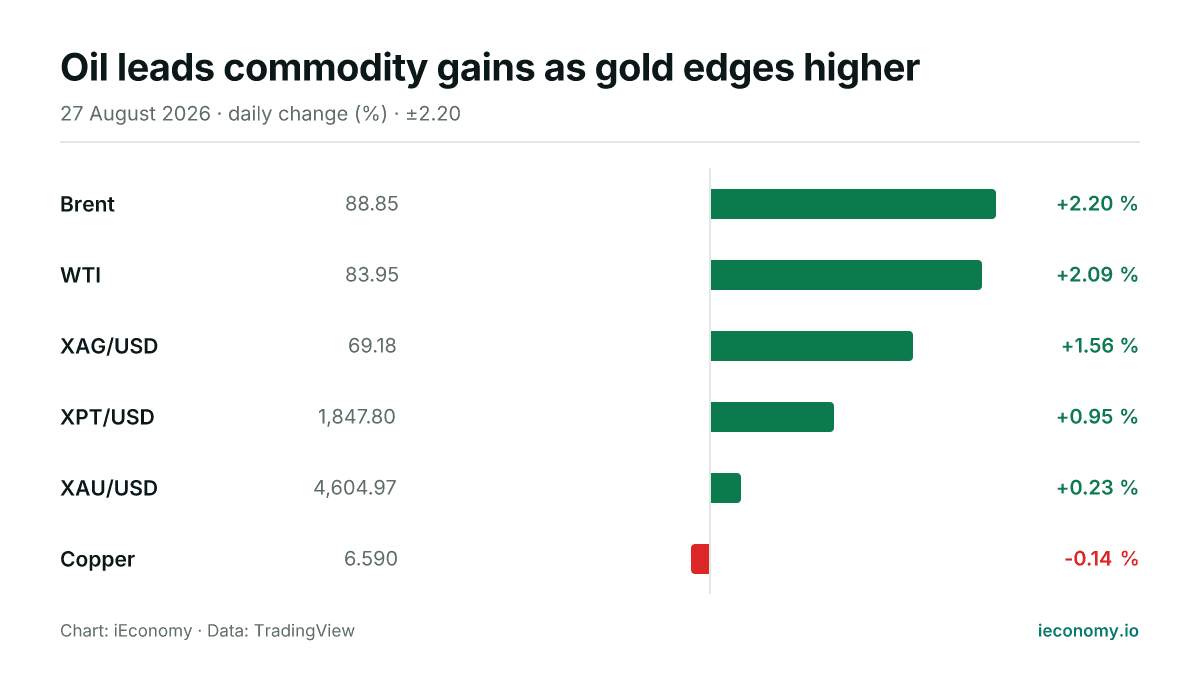
Crude oil outpaced the broader commodity board on Thursday, while silver and platinum also advanced. Gold rose more modestly and copper was the only tracked market to finish lower.
Gold edges higher as silver gains; oil drops sharply
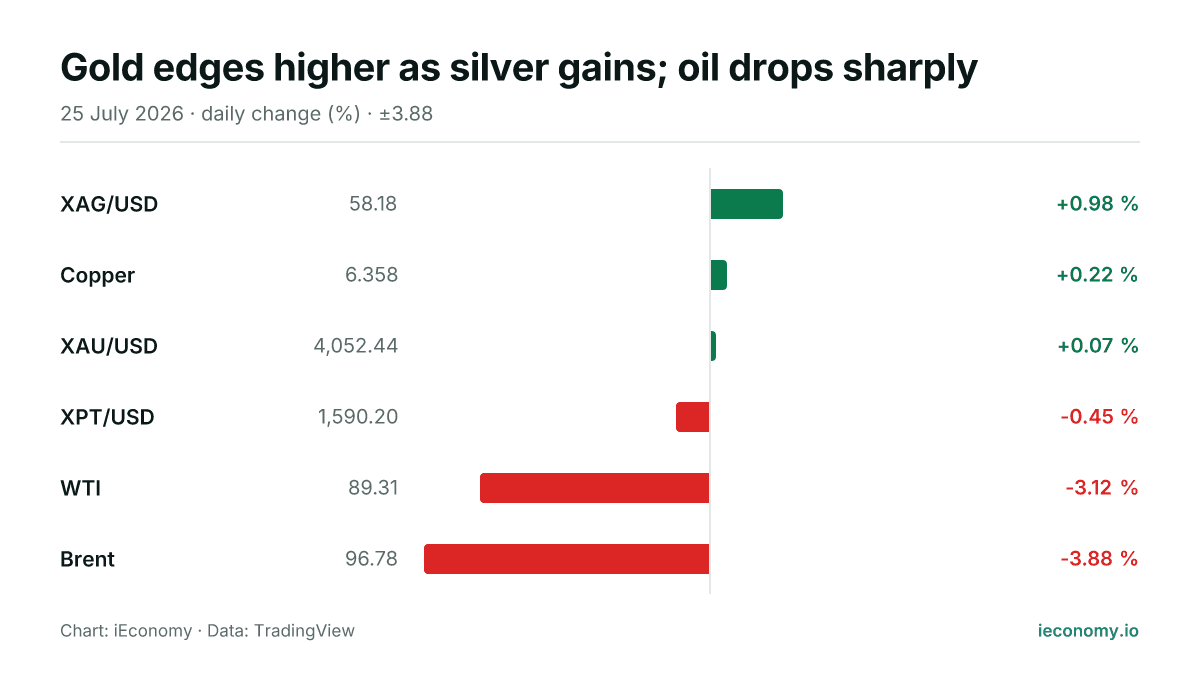
Precious metals were mixed on Saturday, with silver outpacing gold and platinum slipping. Crude oil was notably weaker, while copper posted a small gain, leaving the day split between modest metals strength and broad energy pressure.
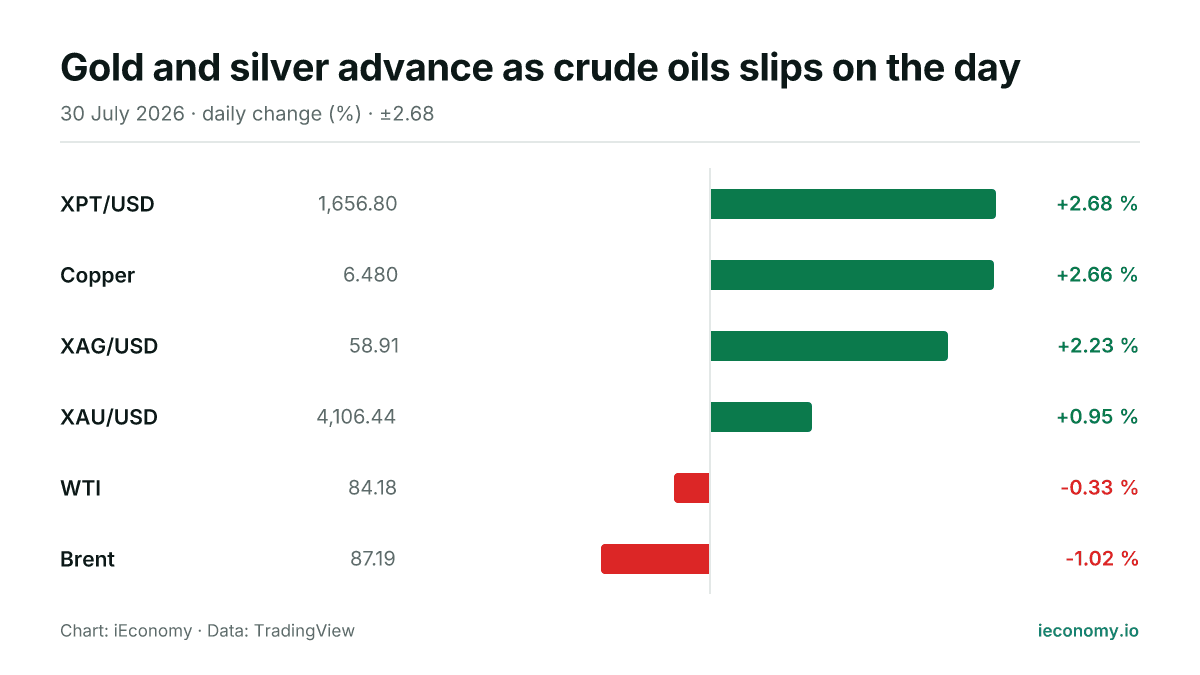
Gold and silver advance as crude oils slips on the day
Precious metals were firmer on Thursday, led by a sharper gain in silver, while crude oil traded lower. The session left the group mixed overall, with 4 of 6 tracked markets higher and 2 lower.