Gold, silver and oil slip as copper edges higher
On Friday, gold and silver led losses in the tracked commodity set while crude oil also eased and copper was the only gainer. The move left five of six instruments lower or flat, with the heaviest declines in precious metals.
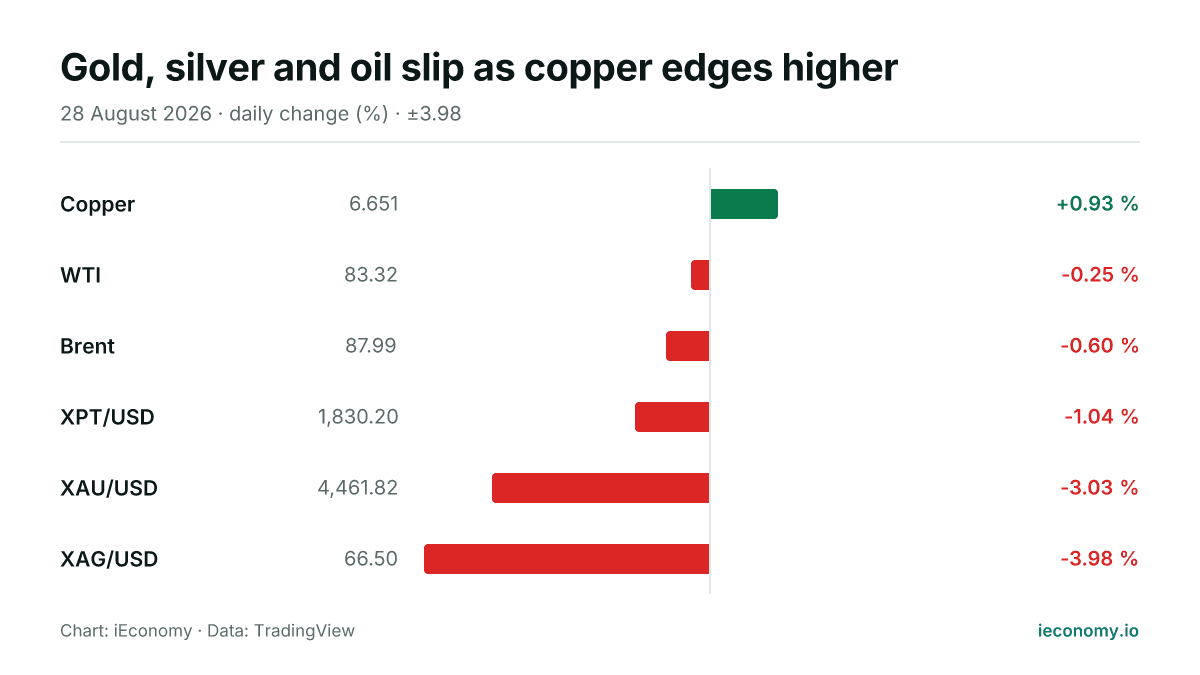
Chart: iEconomy · Data: TradingView
Commodity markets were mixed on Friday, with one instrument higher and five lower or flat in the tracked set. Gold and silver posted the sharpest falls, crude oil eased, and copper was the only gainer, leaving precious metals as the clear weak spot in the group.
What moved and by how much
WTI fell 0.25% to 83.32 and Brent declined 0.60% to 87.99, a smaller setback than the losses in the metals complex. Those moves show a market that is still active, but where selling pressure was more pronounced in bullion than in energy.
| Instrument | Last | Change |
|---|---|---|
| Copper | 6.651 | +0.93 % |
| WTI | 83.32 | -0.25 % |
| Brent | 87.99 | -0.60 % |
| XPT/USD | 1,830.20 | -1.04 % |
| XAU/USD | 4,461.82 | -3.03 % |
| XAG/USD | 66.50 | -3.98 % |
XAU/USD dropped 3.03% to 4,461.82, while XAG/USD fell 3.98% to 66.50. XPT/USD also weakened, losing 1.04% to 1,830.20, so the day’s price action was broad rather than isolated to a single metal.
The standouts at each end
Copper was the only instrument in the digest to finish higher, rising 0.93% to 6.651. That makes it the relative standout, even though the move was modest compared with the declines elsewhere.
At the other end, silver was the weakest performer, followed by gold. In percentage terms, the gap between the lone riser and the weakest metal was wide enough to show clear divergence within commodities, even without any change in the broader daily backdrop.
What a long-term investor should take from one day
A single session mainly tells investors about short-term price discovery and positioning. When a market moves in a coordinated way, as precious metals did here, it can reflect mechanical selling, profit-taking or hedging flows, but the digest does not identify a specific trigger.
The more important lesson is that diversification within commodities does not eliminate volatility. Gold, silver and oil can all move on the same day, yet not by the same amount or direction, so exposure needs to be understood instrument by instrument rather than as one uniform asset class.
This article is not investment advice and recommends no asset, level or direction; a single session's move is not evidence of a trend. For background see Markets, Bear Market, BIST 100, and for terms the finance glossary.
Frequently asked questions
Which commodity was strongest on Friday?
Copper was the only instrument in the digest to rise, gaining 0.93% to 6.651. That made it the relative outperformer in a session dominated by declines elsewhere.
Which markets were weakest?
Silver recorded the largest fall in the set, dropping 3.98% to 66.50, while gold also declined sharply at 3.03%. Those moves made precious metals the clear laggards on the day.
What does this mean for investors?
It shows that even within commodities, price moves can be uneven and driven by market mechanics rather than one simple theme. For investors, the key takeaway is to watch each contract on its own terms and avoid assuming gold, silver and oil will always move together.
Sources
Related News
Oil leads commodity gains as gold edges higher
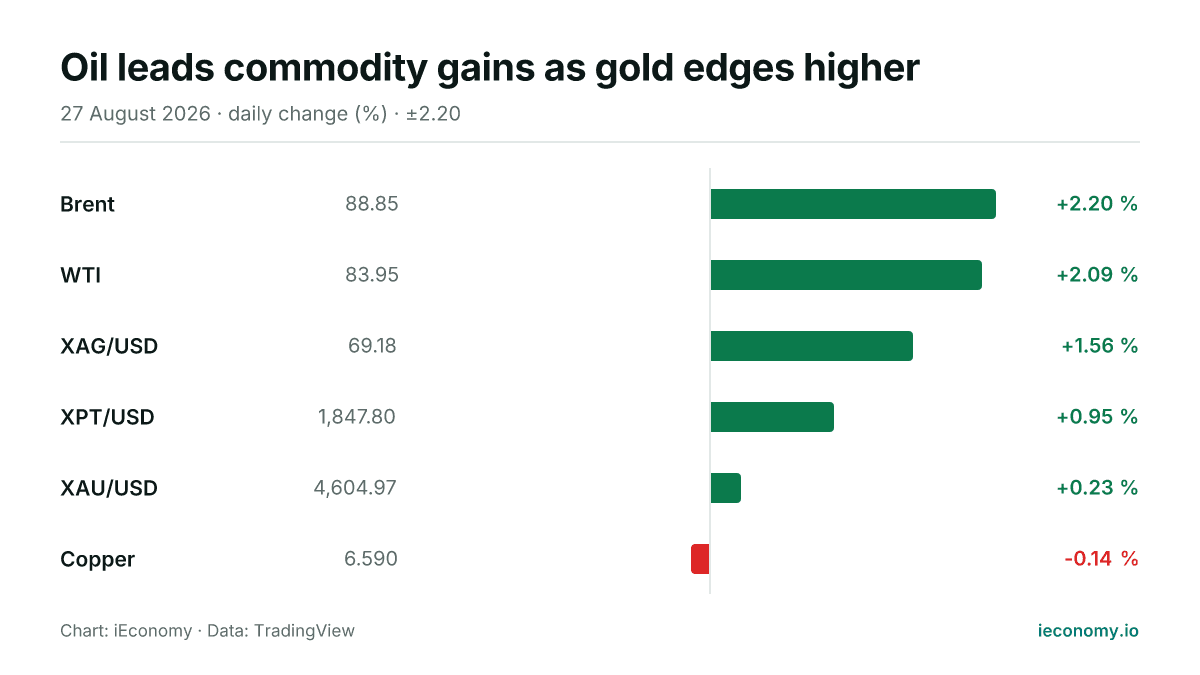
Crude oil outpaced the broader commodity board on Thursday, while silver and platinum also advanced. Gold rose more modestly and copper was the only tracked market to finish lower.
Gold firms while silver and oil fall sharply
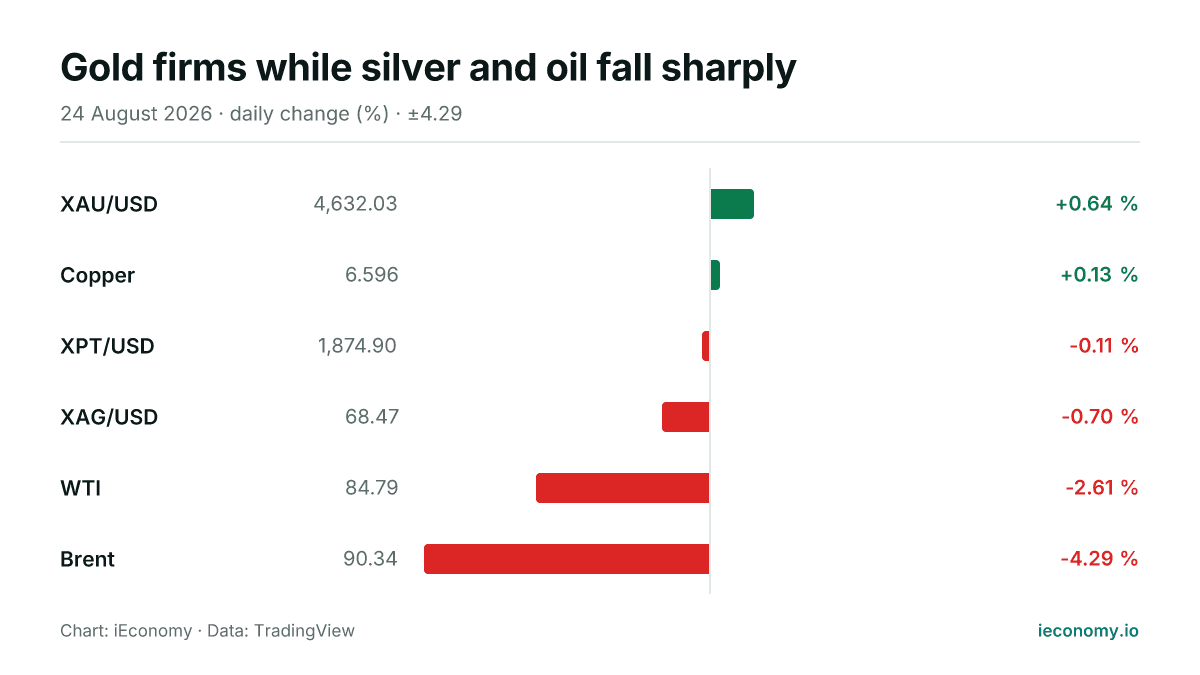
Gold edged higher on Monday as silver and crude oil weakened, leaving a mixed but broadly softer commodity tape. Brent and WTI posted the steepest declines, while gold remained the clearest gainer in the digest.
Gold leads metals rally; oil edges higher
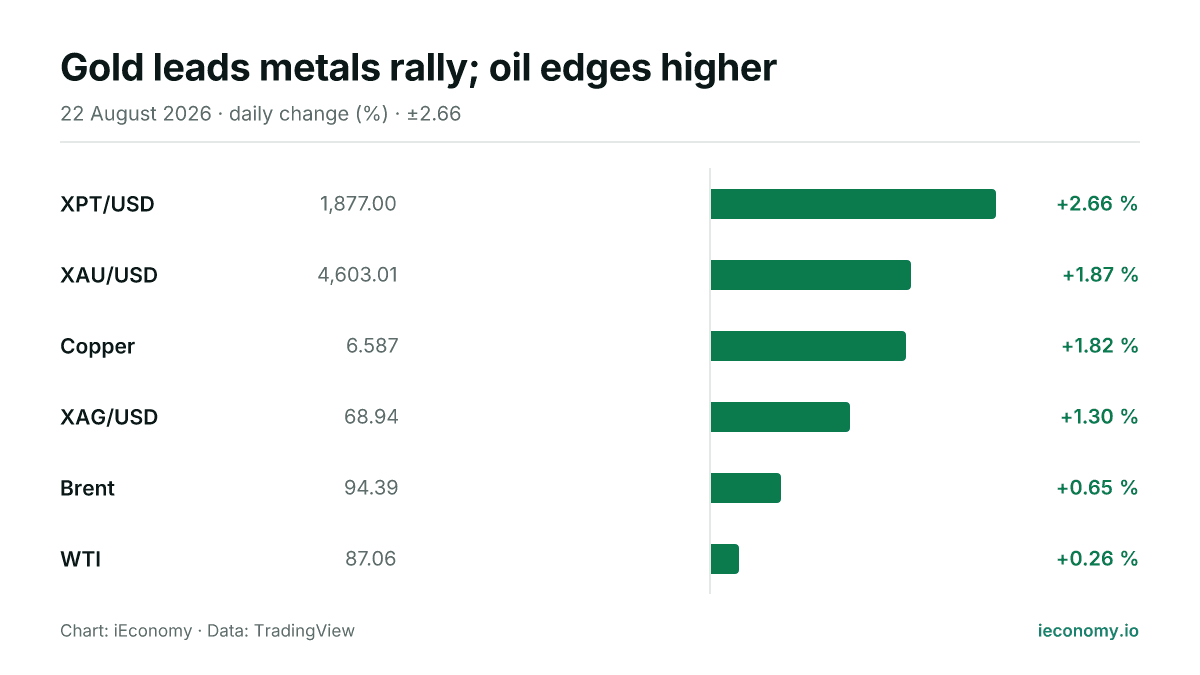
Gold and silver advanced alongside crude oil in a broad commodity move on Saturday, with all six tracked instruments higher. Gold led the precious-metals complex, while Brent and WTI posted more modest gains.
Gold and silver fall as crude oil extends gains on Friday
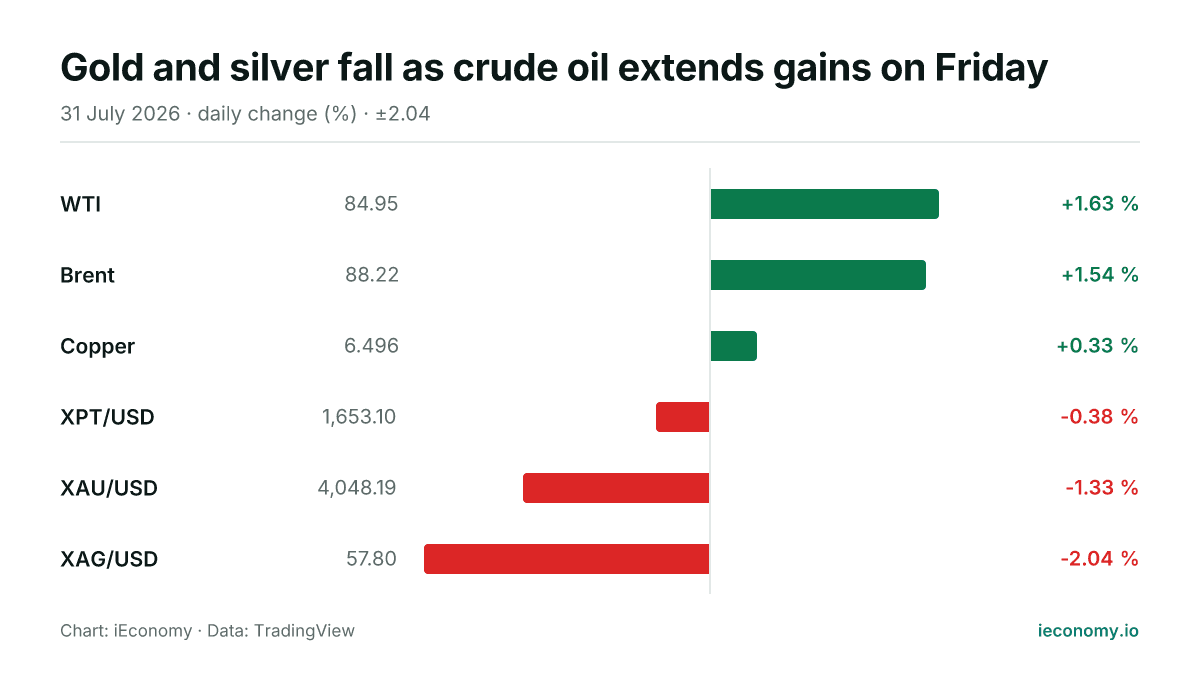
Gold and silver were lower while crude oil moved higher on 2026-07-31, with copper also slightly firmer. The day left a mixed commodity tape, led by strength in energy and weakness in precious metals.
Global shares mixed as Tokyo gains, Wall Street slips
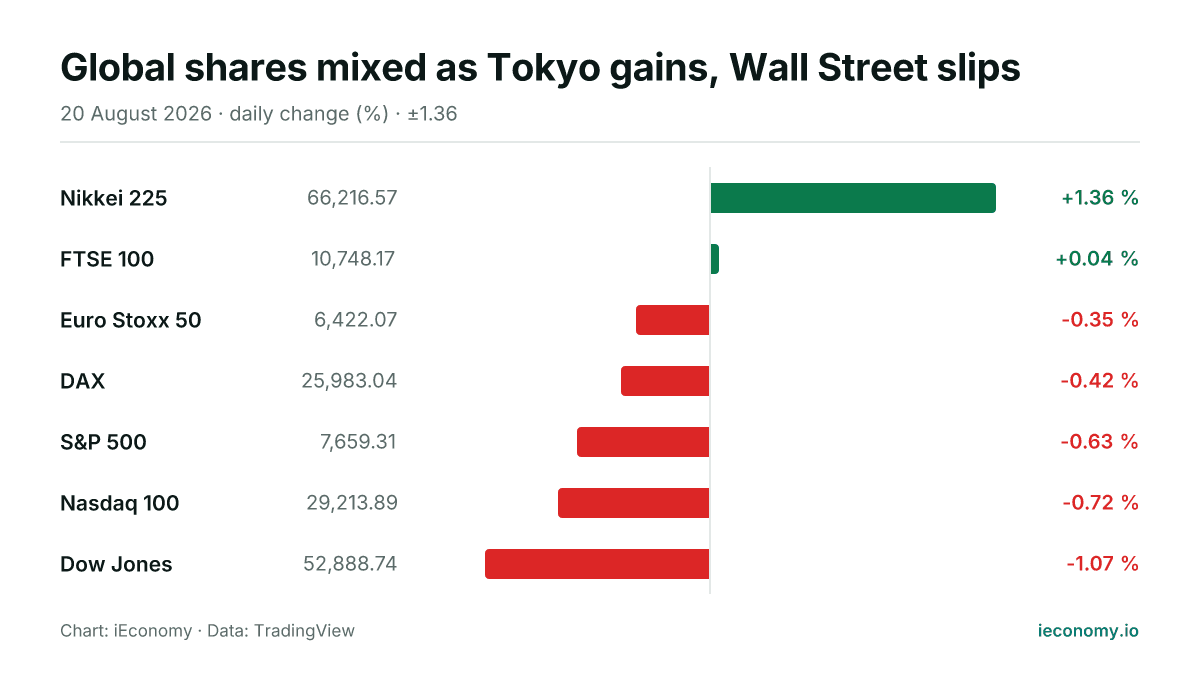
Asian equities were firmer and Europe was little changed to lower, while US indices traded lower. The day’s pattern showed rotation rather than a broad-risk selloff, with only two of seven benchmarks advancing.
Gold and silver jump as oil extends gains, copper slips
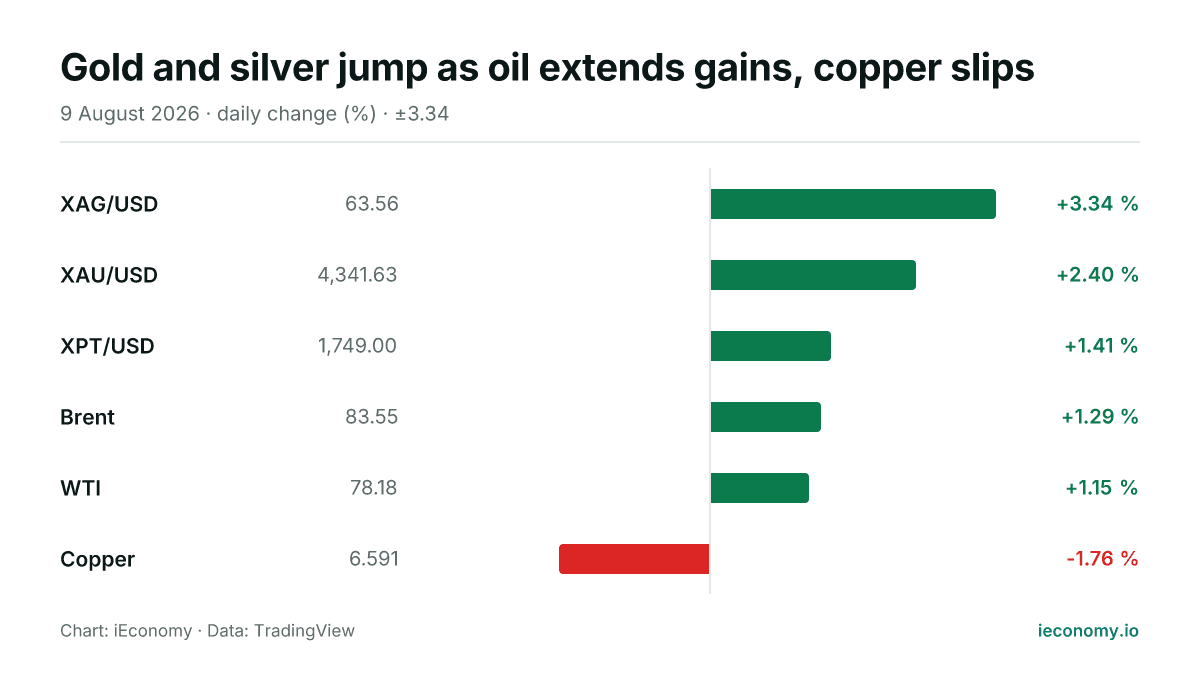
Precious metals and crude were mostly higher on Sunday, with silver leading the advances and copper the only decliner. The moves were broad but uneven, leaving a mixed snapshot for commodity traders and investors.