S&P 500 rises 0.72% to 7,730.99 as Nvidia leads
The S&P 500 advanced on Thursday, with a narrow majority of tracked constituents higher. Nvidia was the strongest performer, while Amazon lagged the group.
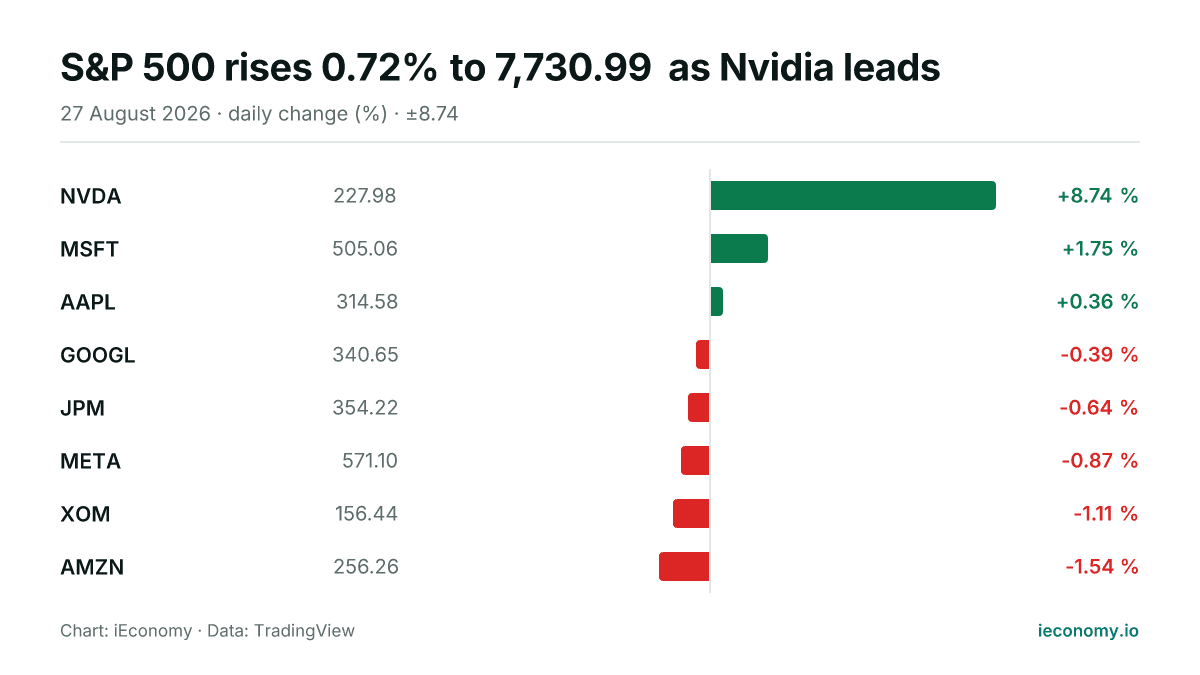
Chart: iEconomy · Data: TradingView
The S&P 500 finished Thursday at 7,730.99, up 0.72% on the day. Among eight tracked constituents, three were higher and five were lower, pointing to a mixed session beneath the index gain.
Index move and breadth
The headline advance masked uneven participation. A rise in the benchmark can coexist with more decliners than gainers when heavier index constituents offset weakness elsewhere, which is why breadth matters alongside the level itself.
| Stock | Last | Change |
|---|---|---|
| NVDA | 227.98 | +8.74 % |
| MSFT | 505.06 | +1.75 % |
| AAPL | 314.58 | +0.36 % |
| GOOGL | 340.65 | -0.39 % |
| JPM | 354.22 | -0.64 % |
| META | 571.10 | -0.87 % |
| XOM | 156.44 | -1.11 % |
| AMZN | 256.26 | -1.54 % |
In this session, the split was modestly negative in the tracked group, even as the index climbed. That combination suggests the index was supported by a limited set of stronger names rather than a broad uniform move across the sample.
Standout performers
Nvidia was the strongest performer in the group, ending at 227.98 after an 8.74% gain. Such an outsized move in one large constituent can have an outsized effect on the index, depending on its weighting and the rest of the tape.
Amazon was the weakest, falling 1.54% to 256.26. A decline in a major stock does not necessarily reverse the broader index trend if other constituents are firmer, but it does reinforce the uneven character of the session.
What a long-term investor should take from it
One session is a snapshot, not a verdict. For long-term investors, the useful lesson is mechanical: index performance reflects both price moves and weighting, while breadth shows how widely that move was shared.
Short-term dispersion is normal in large-cap equity markets. A strong day for the index can still include laggards, and a weak breadth reading does not automatically negate the broader trend; it simply shows where participation was concentrated.
Sources
Related News
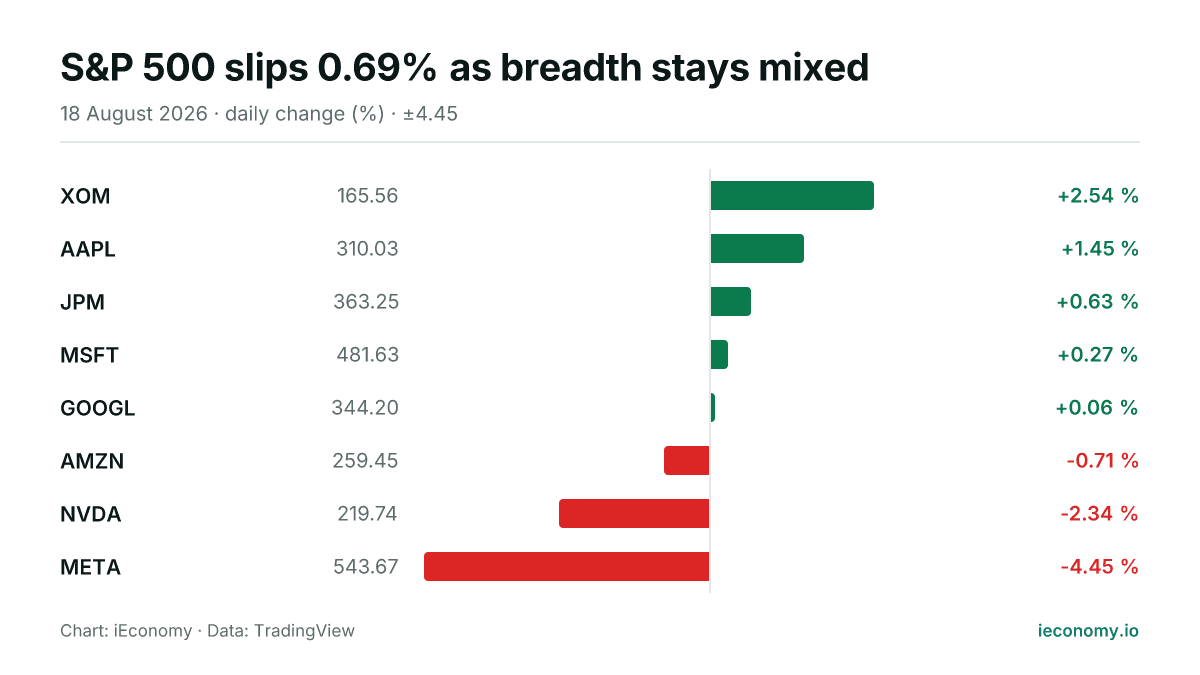
S&P 500 slips 0.69% as breadth stays mixed
The S&P 500 finished Tuesday at 7,691.76, down 0.69% on the session. Among the eight tracked constituents, five advanced and three declined, with XOM the strongest and META the weakest.
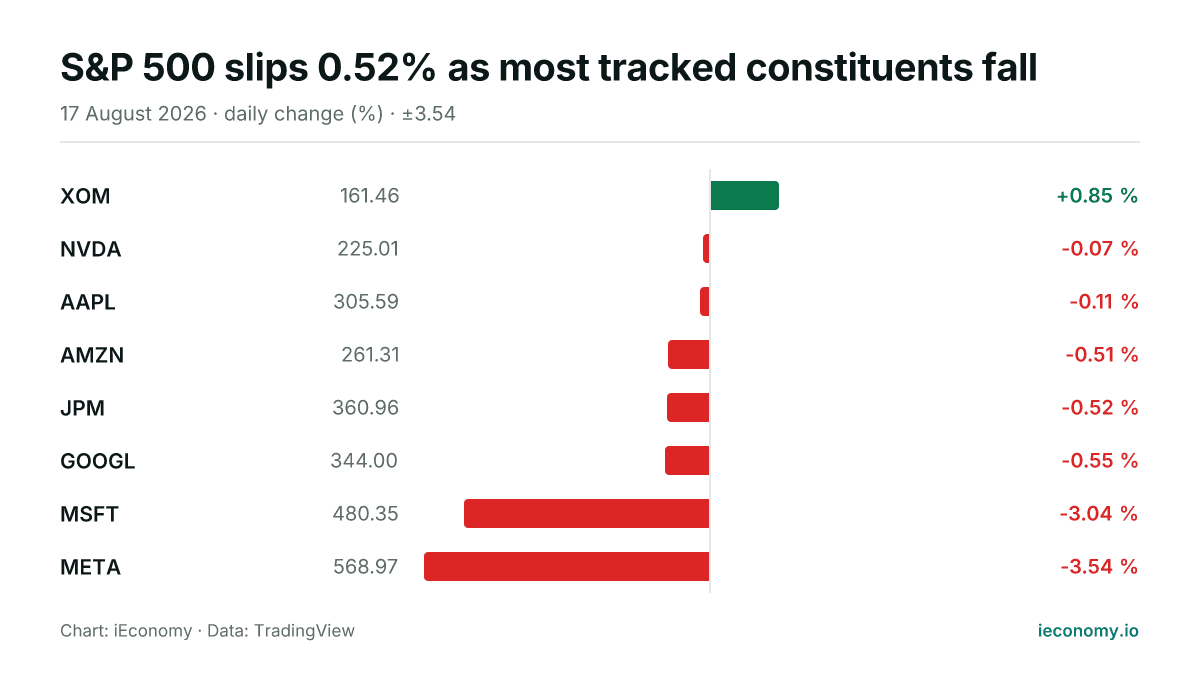
S&P 500 slips 0.52% as most tracked constituents fall
The S&P 500 ended Monday at 7,745.06, down 0.52%, with seven of eight tracked constituents lower. Exxon Mobil was the only gainer, while Meta posted the steepest decline.
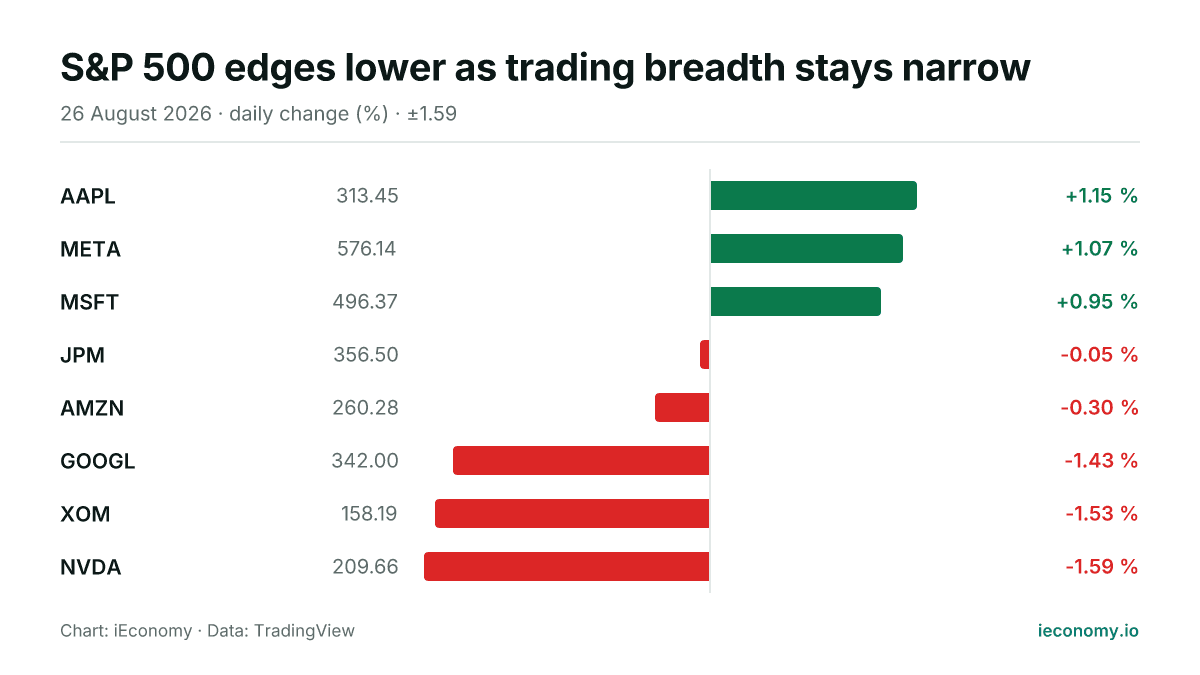
S&P 500 edges lower as trading breadth stays narrow
The S&P 500 ended Wednesday at 7,675.70, down 0.02% as five of the eight tracked constituents fell and three rose. Apple was the strongest performer, while Nvidia was the weakest.
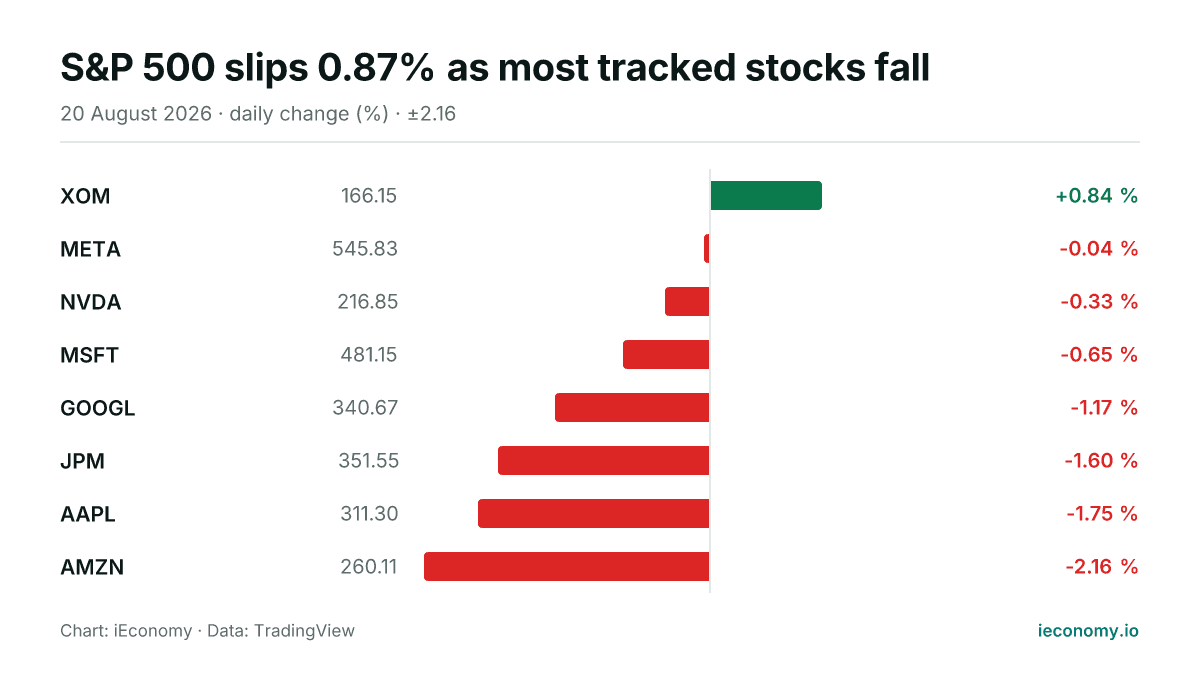
S&P 500 slips 0.87% as most tracked stocks fall
The S&P 500 ended Thursday at 7,641.16, down 0.87% on the session. Among the eight tracked constituents, one finished higher and seven were lower, with AMZN the weakest and XOM the strongest.
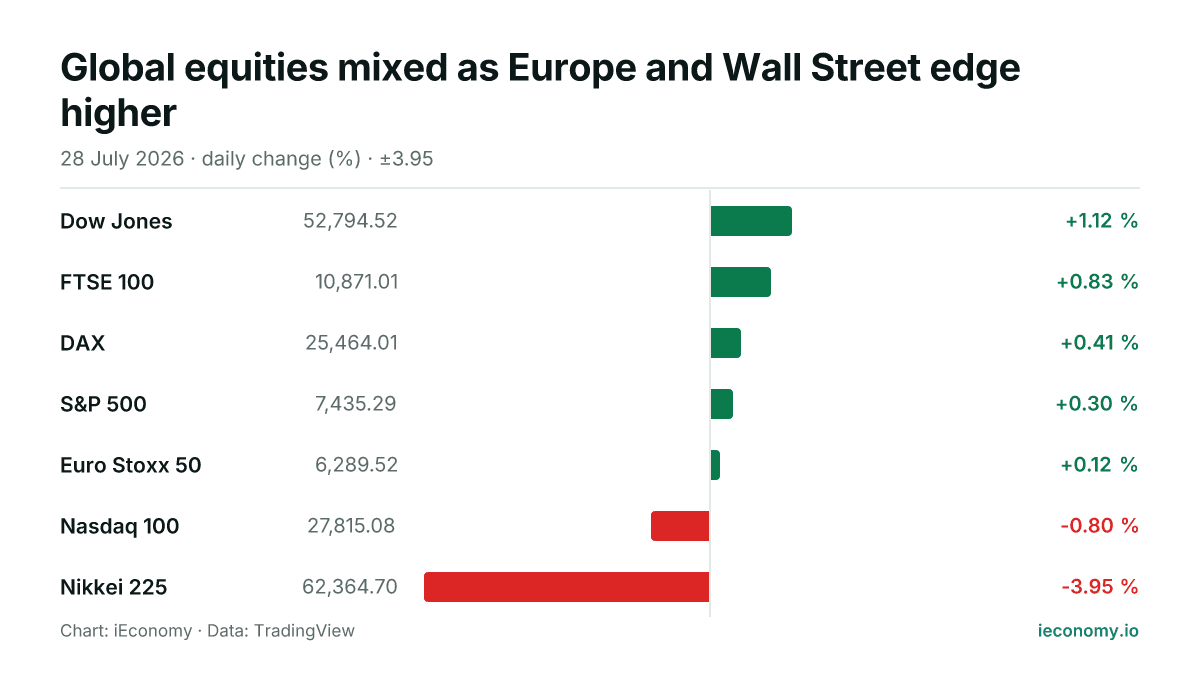
Global equities mixed as Europe and Wall Street edge higher
US and European indices mostly advanced on Tuesday, while Tokyo’s Nikkei 225 fell sharply. The day left a split picture across regions rather than a broad risk-off or risk-on move.
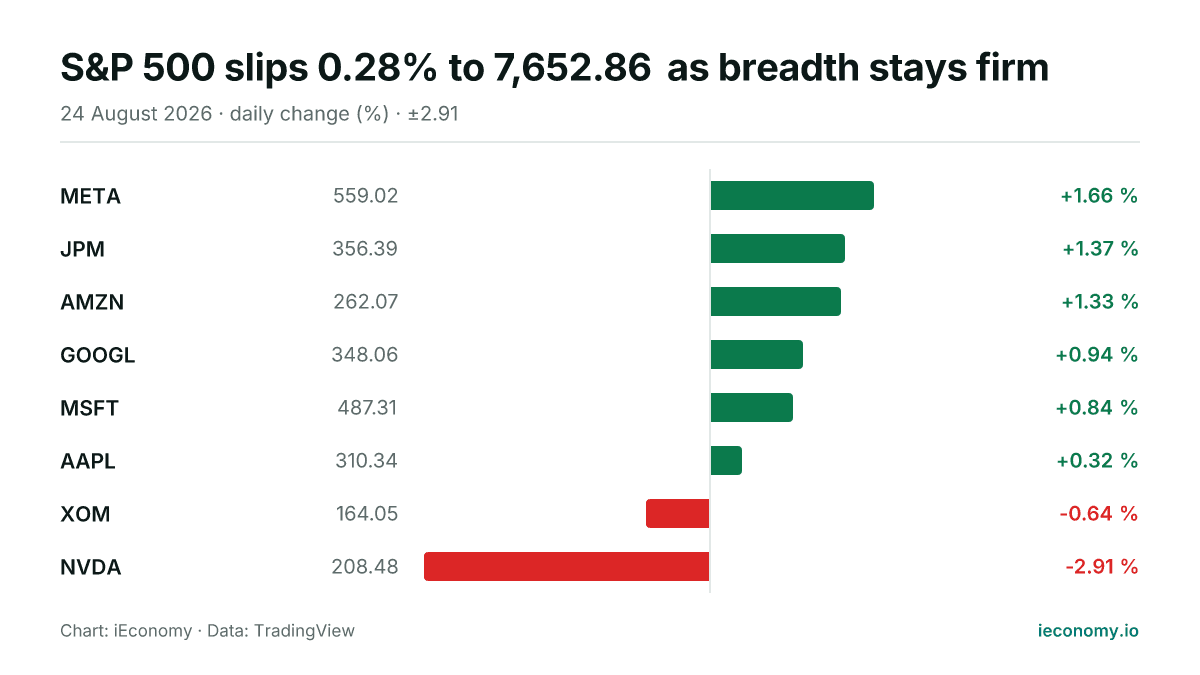
S&P 500 slips 0.28% to 7,652.86 as breadth stays firm
The S&P 500 edged lower on Monday, finishing at 7,652.86 after a modest decline of 0.28%. Among the eight tracked constituents, six rose and two fell, with META the strongest and NVDA the weakest.