Analysis: What a Steepening Yield Curve Is Telling Investors
A months-long shift in the shape of the Treasury curve has strategists debating its implications for growth and risk assets.

The US Treasury yield curve has steepened noticeably over the past several months, a shift that strategists say carries meaningful implications for how investors should think about the growth and inflation outlook heading into next year.
The gap between two-year and ten-year Treasury yields has widened from near-flat levels earlier this year to its widest spread in more than two years, according to figures tracked by the desk.
Historically, a steepening curve following a period of inversion has been interpreted in two very different ways: as a healthy normalization reflecting improving growth expectations, or as an early warning sign that a slowdown is approaching, since curves have often steepened just before past recessions as the market prices in future rate cuts.
Distinguishing a bull steepener from a bear steepener
Analysts on the desk emphasize that the type of steepening matters considerably. A bull steepener, driven by falling short-term yields as the market anticipates rate cuts, tends to be more consistent with a soft-landing narrative. A bear steepener, driven instead by rising long-term yields on inflation or fiscal concerns, often signals a more troubling macro backdrop.
The current move appears to be a mix of both dynamics, with short-term yields falling on rate-cut expectations while longer-dated yields have stayed relatively elevated, partly reflecting concerns about government debt issuance levels.
Equity sector performance has shown some sensitivity to the shift, with financial stocks — which often benefit from a steeper curve through improved net interest margins — outperforming more rate-sensitive growth sectors over the period.
Fixed-income strategists note that a sustained steepening trend could also influence mortgage rates and corporate borrowing costs at the long end, with potential knock-on effects for housing activity and capital expenditure decisions.
The desk's overall takeaway is that while the steepening curve is not by itself a definitive signal, its composition and persistence over the coming months should be watched closely as a gauge of shifting growth and inflation expectations.
Related News

Analysis: Gold's Rally Against Real Yields Tests History
Bullion has climbed even as real interest rates stayed elevated, challenging a correlation that has long anchored gold price models.

Analysis: Is the Soft-Landing Narrative Still Intact?
Mixed economic signals over the past month have strategists revisiting whether the US economy can avoid recession.
Analysis: Sector Rotation Tilts Toward Value as Growth Trade Cools
A multi-week shift in market leadership has strategists debating whether cyclical and value stocks can sustain their outperformance.
Analysis: Credit Spreads Flash a Calm Signal Despite Growth Worries
Corporate bond spreads remain historically tight even as equity investors debate the odds of an economic slowdown.
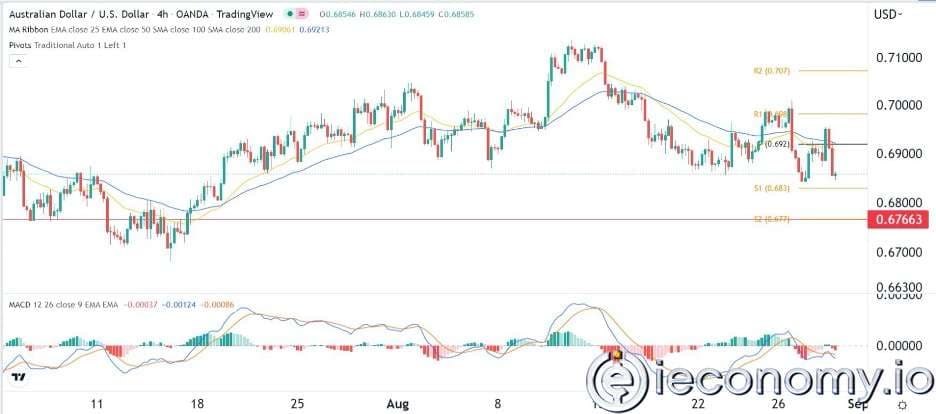
Forex Signal For AUD/USD: Head-Shoulder Pattern Curves Point To 0,6770
Forex Signal For AUD/USD: Head-Shoulder Pattern Curves Point To 0,6770 Forex Signal For AUD/USD: Head-Shoulder Pattern Curves Point To 0,6770
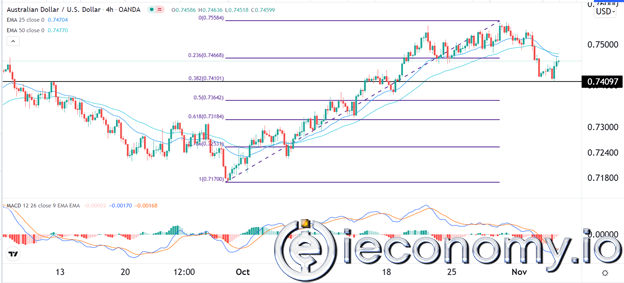
Forex Signal For BTC/USD: Triangle Pattern Hints at Breakout.
Forex Signal For BTC/USD: Triangle Pattern Hints at Breakout. Forex Signal For BTC/USD: Triangle Pattern Hints at Breakout.