World equities mixed as Europe rallies and Asia leads losses
European benchmarks advanced while US indexes were broadly firmer and Asia finished lower, with the Nasdaq 100 and Nikkei 225 lagging. The day left 5 of 7 tracked indices higher, but the dispersion was wide.
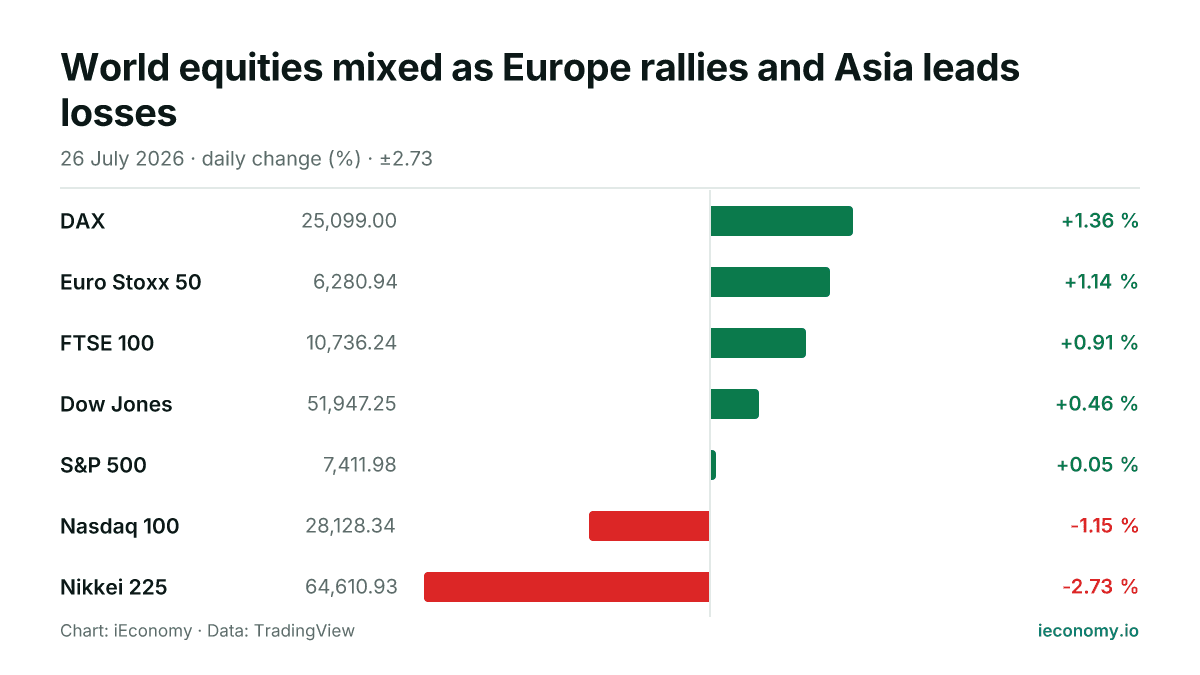
Chart: iEconomy · Data: TradingView
World equity markets showed a split session on Sunday, with Europe posting the strongest gains, US benchmarks mostly edging higher and Asian equities weaker. Of the 7 indices tracked, 5 were higher and 2 were lower, but the cross-market gap was notable: the DAX and Euro Stoxx 50 both advanced more than 1%, while the Nasdaq 100 and Nikkei 225 declined.
What moved and by how much
In Europe, the DAX rose 1.36% to 25,099.00 and the Euro Stoxx 50 added 1.14% to 6,280.94. The FTSE 100 gained 0.91% to 10,736.24. In the US, the Dow Jones was up 0.46% at 51,947.25 and the S&P 500 edged 0.05% higher to 7,411.98, while the Nasdaq 100 fell 1.15% to 28,128.34. In Asia, the Nikkei 225 dropped 2.73% to 64,610.93.
| Instrument | Last | Change |
|---|---|---|
| DAX | 25,099.00 | +1.36 % |
| Euro Stoxx 50 | 6,280.94 | +1.14 % |
| FTSE 100 | 10,736.24 | +0.91 % |
| Dow Jones | 51,947.25 | +0.46 % |
| S&P 500 | 7,411.98 | +0.05 % |
| Nasdaq 100 | 28,128.34 | -1.15 % |
| Nikkei 225 | 64,610.93 | -2.73 % |
The standouts at each end
The strongest move in the tracked set was the DAX, and the weakest was the Nikkei 225. The contrast matters because it shows this was not a single-direction day for global risk sentiment: broader European benchmarks were bid, US large-cap benchmarks were steadier, and the Nasdaq 100’s decline pointed to a softer move in growth-heavy stocks. The mechanics are simple enough: index levels reflect the weighted performance of their constituents, so a handful of large moves can shape the headline even when the broader tape is mixed.
What a long-term investor should take from it
A single session can be useful for gauging breadth and rotation, but it should not be overread. On days like this, the main lesson is that regional and style differences can dominate the headline picture even when the overall tally looks positive. For long-term investors, the practical takeaway is to focus on diversification and on how index composition affects day-to-day swings, especially when one major benchmark is falling while others rise.
Sources
Related News
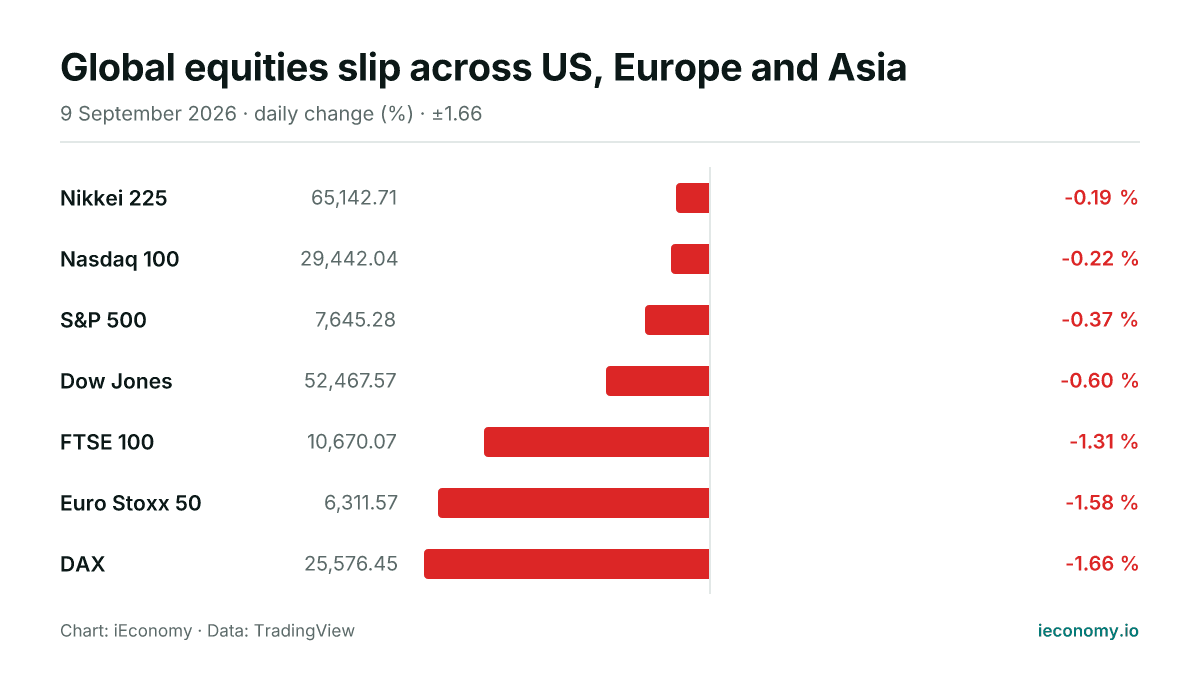
Global equities slip across US, Europe and Asia
All seven tracked indices were lower or flat on Wednesday, with Europe leading the declines and the Dow among the weakest in the US. The session was broadly risk-off, but only the price action itself is visible here.
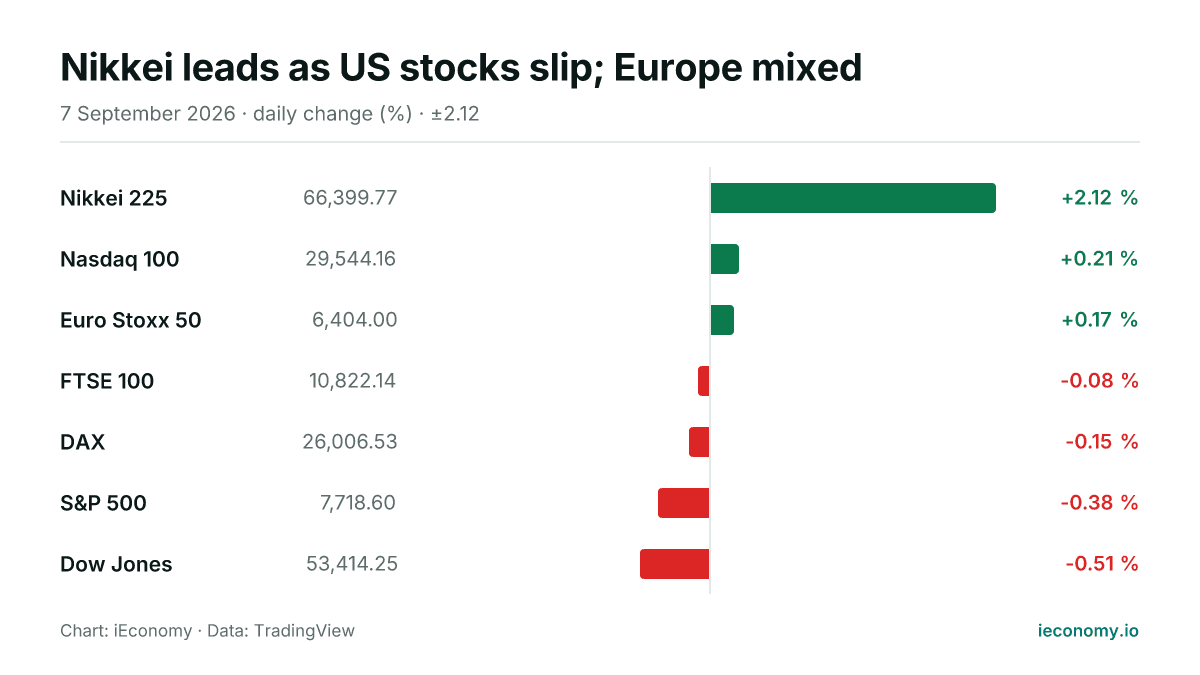
Nikkei leads as US stocks slip; Europe mixed
Asian equities outperformed on Monday, with the Nikkei 225 rising sharply while US benchmarks traded lower and Europe was mixed. The day’s moves were modest in most markets, but the gap between Japan and Wall Street stood out.
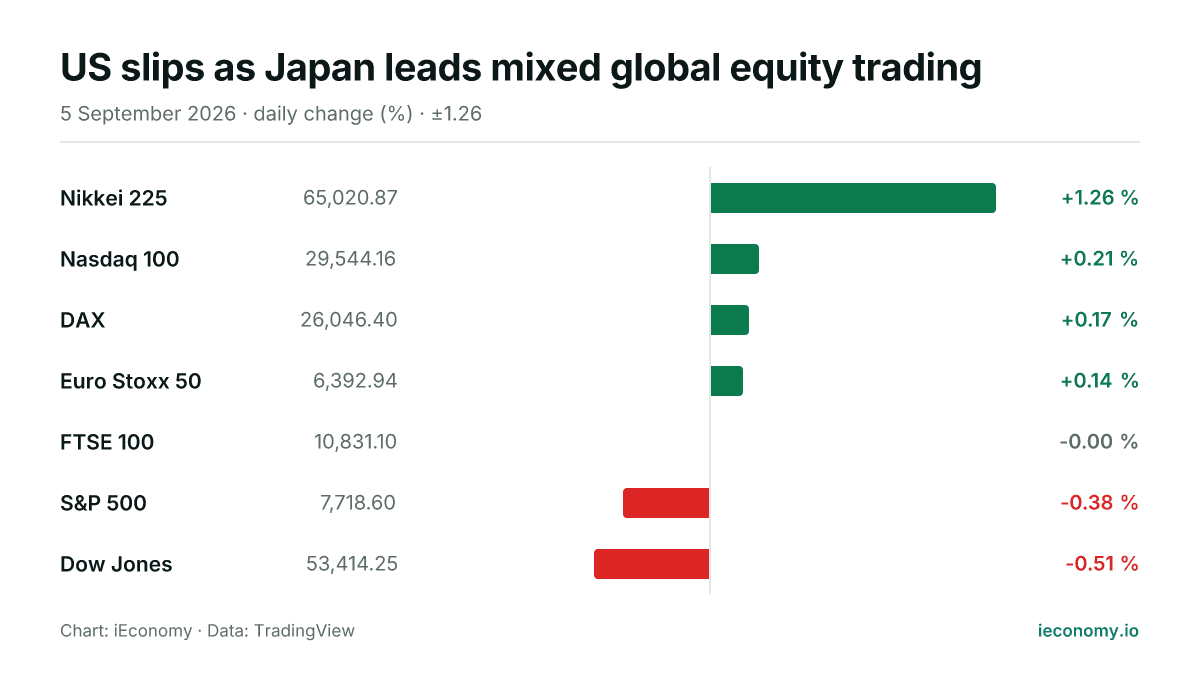
US slips as Japan leads mixed global equity trading
World equities were mixed on 2026-09-05, with Japan leading gains and US benchmarks mostly weaker. Europe edged higher, while the FTSE 100 was flat as the Dow and S&P 500 lagged.
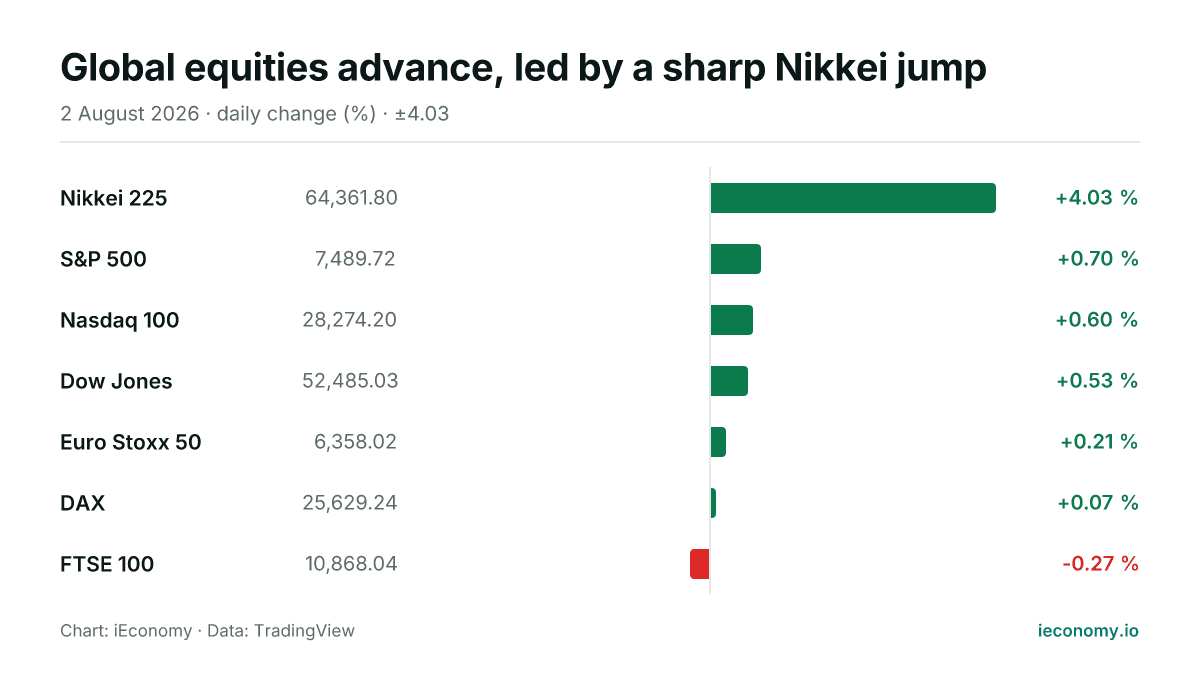
Global equities advance, led by a sharp Nikkei jump
Most major equity benchmarks were higher on the day, with Japan’s Nikkei 225 the clear outlier on the upside. In Europe, gains were modest and London lagged slightly.
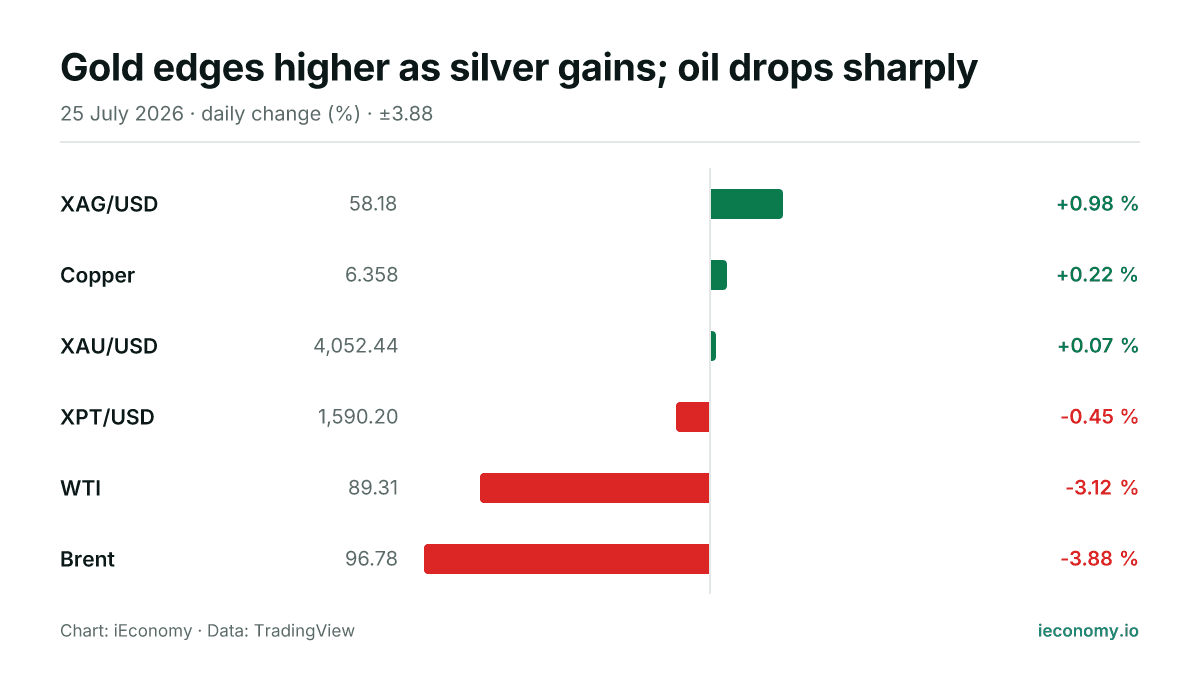
Gold edges higher as silver gains; oil drops sharply
Precious metals were mixed on Saturday, with silver outpacing gold and platinum slipping. Crude oil was notably weaker, while copper posted a small gain, leaving the day split between modest metals strength and broad energy pressure.
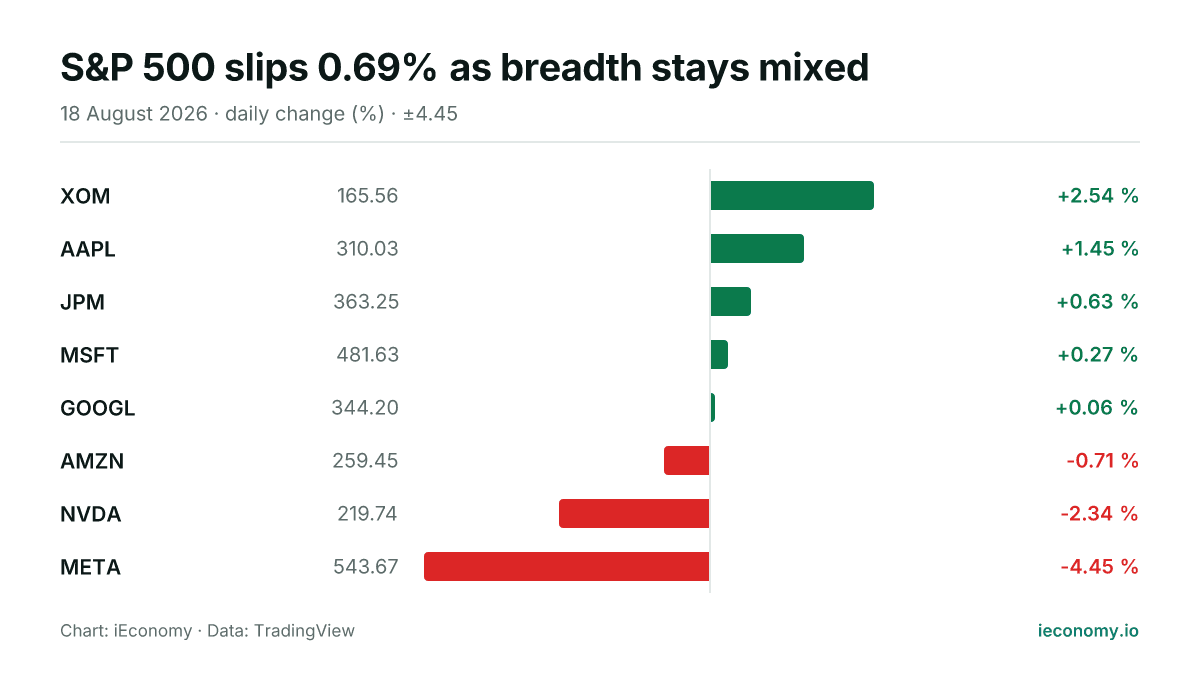
S&P 500 slips 0.69% as breadth stays mixed
The S&P 500 finished Tuesday at 7,691.76, down 0.69% on the session. Among the eight tracked constituents, five advanced and three declined, with XOM the strongest and META the weakest.