Global equities slip across US, Europe and Asia
All seven tracked indices were lower or flat on Wednesday, with Europe leading the declines and the Dow among the weakest in the US. The session was broadly risk-off, but only the price action itself is visible here.
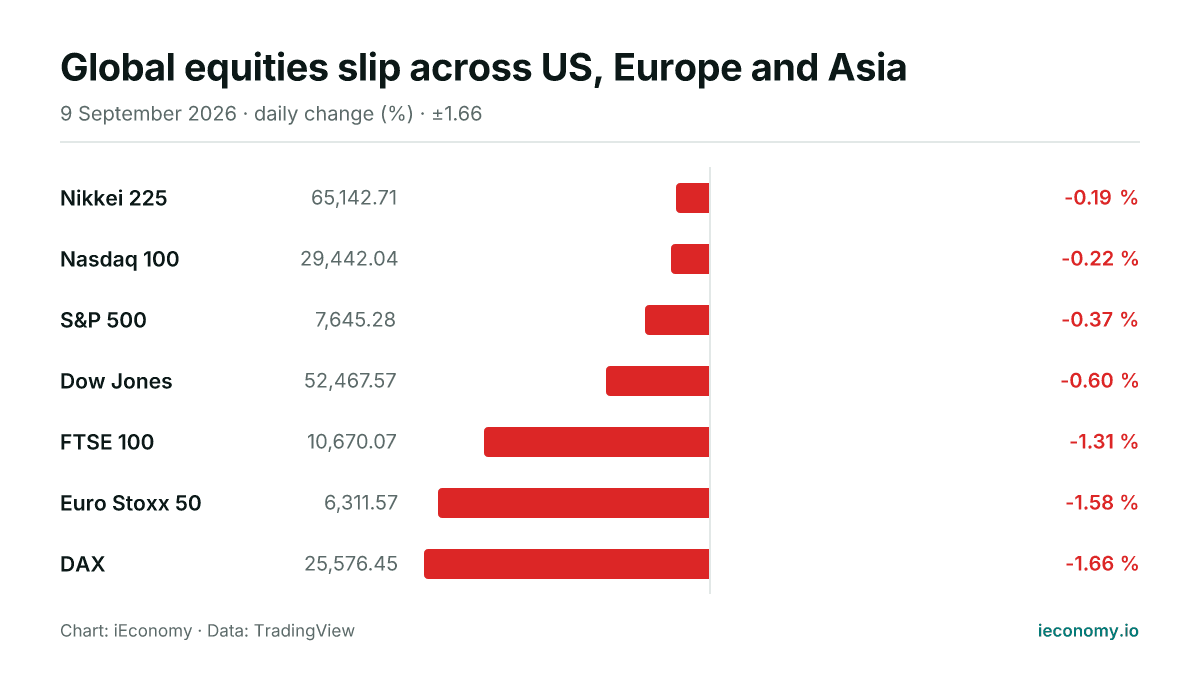
Chart: iEconomy · Data: TradingView
Global equity benchmarks were lower or unchanged on Wednesday, with all seven tracked indices in negative territory. Europe fell furthest, while losses in the US were more contained and Japan’s Nikkei 225 edged down only slightly.
What moved and by how much
In the US, the Nasdaq 100 fell 0.22%, the S&P 500 lost 0.37% and the Dow Jones dropped 0.60%. The moves suggest a broad but orderly pullback rather than a single-index shock, with the more cyclical Dow underperforming the Nasdaq on the day.
| Instrument | Last | Change |
|---|---|---|
| Nikkei 225 | 65,142.71 | -0.19 % |
| Nasdaq 100 | 29,442.04 | -0.22 % |
| S&P 500 | 7,645.28 | -0.37 % |
| Dow Jones | 52,467.57 | -0.60 % |
| FTSE 100 | 10,670.07 | -1.31 % |
| Euro Stoxx 50 | 6,311.57 | -1.58 % |
| DAX | 25,576.45 | -1.66 % |
Europe was weaker across the board. The FTSE 100 declined 1.31%, the Euro Stoxx 50 fell 1.58% and the DAX slid 1.66%, making German equities the weakest of the three major European benchmarks tracked here. That is enough to weigh on the region’s relative performance against the US and Asia.
In Asia, the Nikkei 225 eased 0.19%, leaving it the least moved index in this set. That smaller decline stands out against the sharper European fall, showing that the day’s pressure was not uniform across regions even though the direction was consistently lower.
The standouts at each end
The biggest loser in the group was the DAX, which finished down 1.66%. At the other end of the range, the Nikkei 225 was the smallest decliner at 0.19%, so the gap between the weakest and strongest markets was wide even without any gainers.
Among the US benchmarks, the Dow Jones was the laggard and the Nasdaq 100 held up best. That pattern matters because index composition changes how markets respond to broad selling: heavier industrial and value exposure can make one benchmark move differently from a more technology-heavy one.
Because all seven indices were flat or lower, there was no internal cross-market lead from rising equities to offset the weakness elsewhere. For readers tracking relative performance, the message is that Europe carried the sharpest downside, while Asia was comparatively resilient.
What a long-term investor should take from one day
One day’s move is useful mainly as a measure of breadth and intensity. When every major region is lower, the mechanics point to a synchronized de-risking rather than a narrow sector rotation, but the data here do not identify the cause.
For a long-term investor, the practical lesson is to separate session noise from portfolio structure. Short-term index swings can change relative valuations and sentiment, yet they do not by themselves alter the underlying case for diversification, discipline and position sizing.
The day also shows how index design can shape headline performance. A benchmark with different sector weights can fall more or less than another even when the wider market tone is the same, so comparing regions requires attention to composition as much as to the percentage move.
This article is not investment advice and recommends no asset, level or direction; a single session's move is not evidence of a trend. For background see Markets, Bear Market, BIST 100, and for terms the finance glossary.
Frequently asked questions
Which region was weakest on Wednesday?
Europe was the weakest region in the set, with the FTSE 100, Euro Stoxx 50 and DAX all falling by more than the US and Asian benchmarks. The DAX had the largest decline among all seven tracked indices.
Did any of the tracked indices rise?
No. The digest shows 0 higher and 7 lower or flat, and every tracked benchmark finished lower on the day. That means the session was uniformly negative across the sample.
What is the main takeaway for investors?
The main takeaway is that one broad down day can reflect general market pressure without identifying a specific catalyst. For investors, the useful focus is on breadth, regional relative strength and how different index compositions respond to the same trading environment.
Sources
Related News
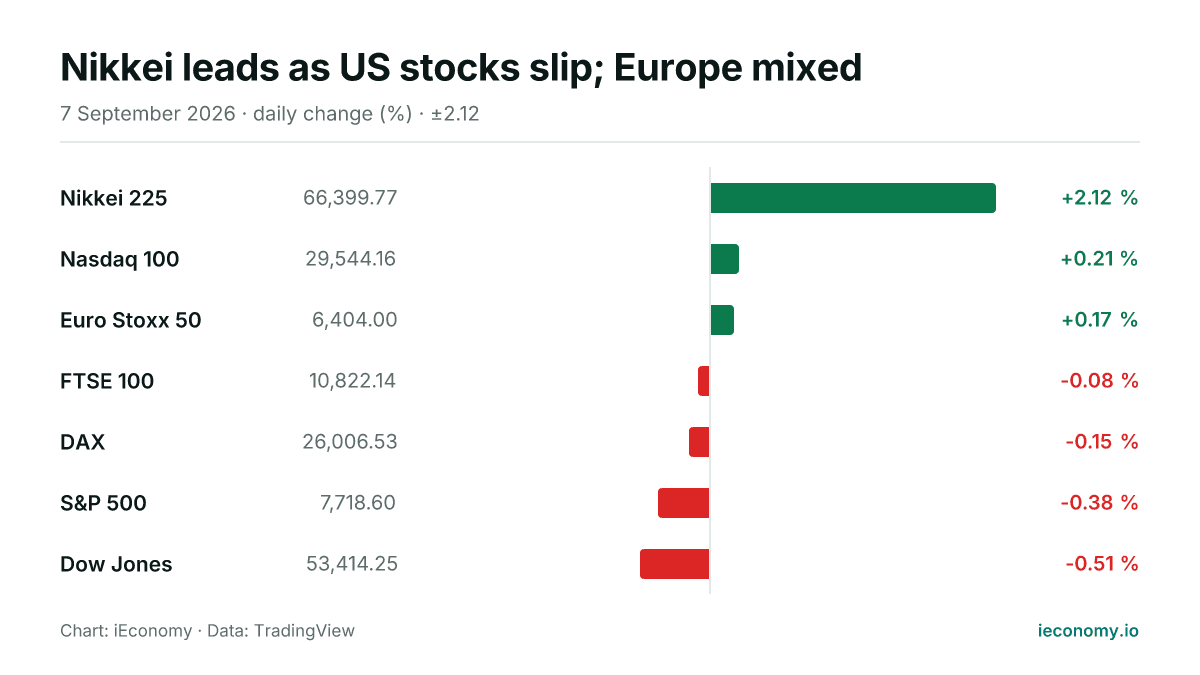
Nikkei leads as US stocks slip; Europe mixed
Asian equities outperformed on Monday, with the Nikkei 225 rising sharply while US benchmarks traded lower and Europe was mixed. The day’s moves were modest in most markets, but the gap between Japan and Wall Street stood out.
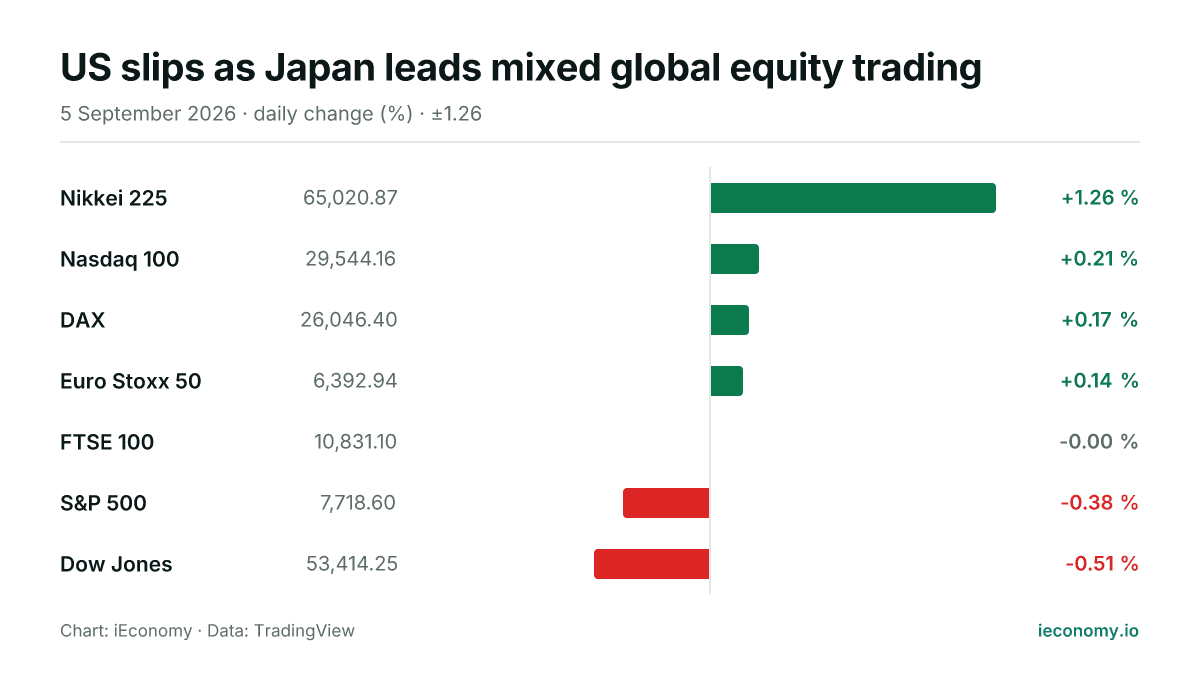
US slips as Japan leads mixed global equity trading
World equities were mixed on 2026-09-05, with Japan leading gains and US benchmarks mostly weaker. Europe edged higher, while the FTSE 100 was flat as the Dow and S&P 500 lagged.
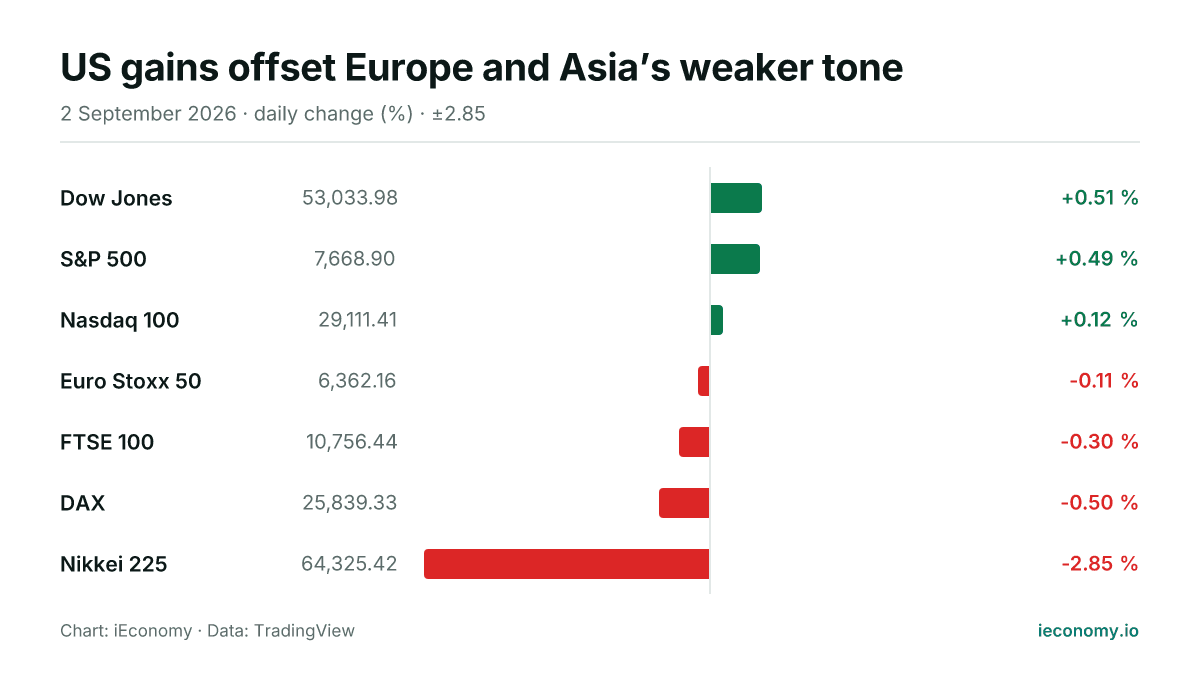
US gains offset Europe and Asia’s weaker tone
US equities advanced modestly while European benchmarks edged lower and Japan’s Nikkei 225 fell sharply. The day left three of seven tracked indices higher, with the strongest move still concentrated in Tokyo.

Asian Equities Hit Multi-Decade Highs as BOJ Policy Path Diverges
Regional benchmarks extended a strong run as investors weighed a stronger corporate earnings backdrop against shifting central bank policy.
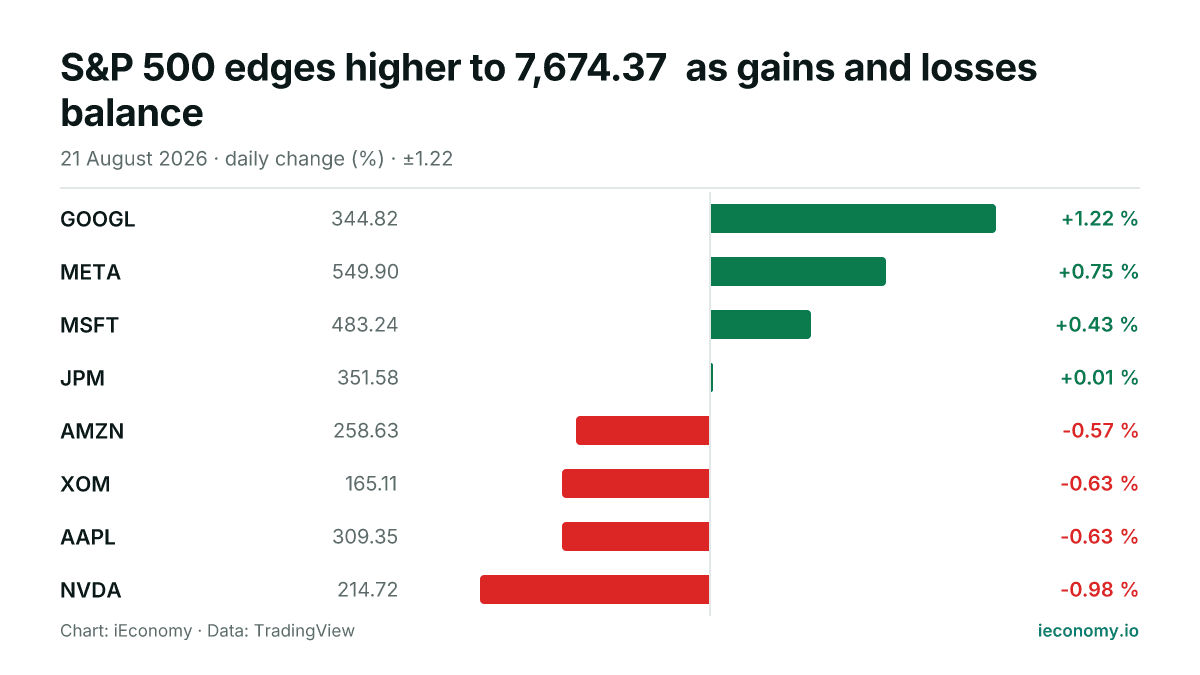
S&P 500 edges higher to 7,674.37 as gains and losses balance
The S&P 500 rose 0.43% to 7,674.37 on Friday. Among the eight tracked constituents, four finished higher and four lower, with GOOGL the strongest and NVDA the weakest.
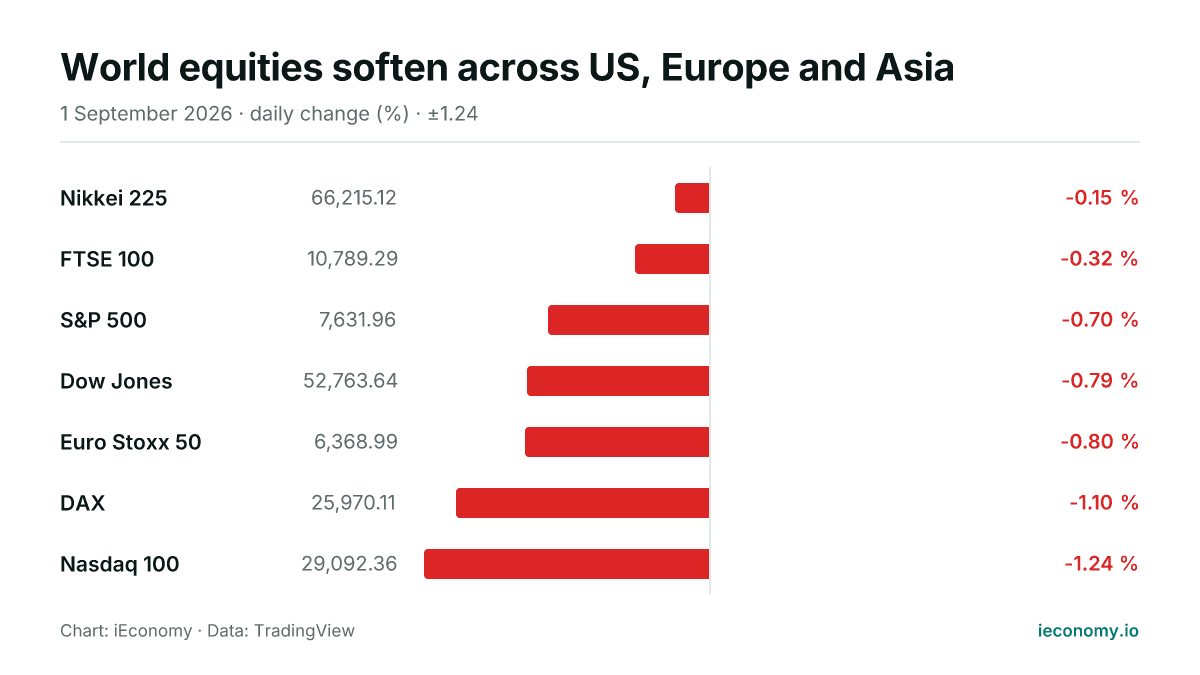
World equities soften across US, Europe and Asia
All seven tracked equity benchmarks were lower or flat on Tuesday, with US growth shares lagging and Europe also under pressure. The move was broad rather than concentrated, leaving no market in positive territory.