US slips as Japan leads mixed global equity trading
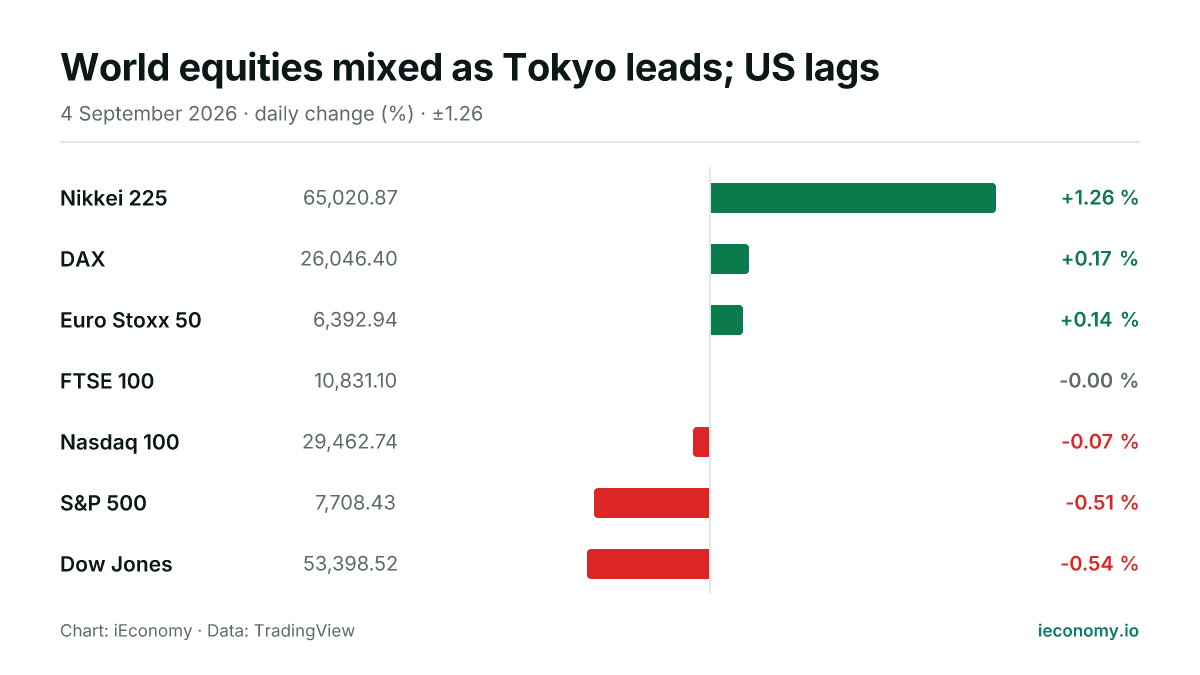
World equities were mixed on 2026-09-05, with Japan leading gains and US benchmarks mostly weaker. Europe edged higher, while the FTSE 100 was flat as the Dow and S&P 500 lagged.
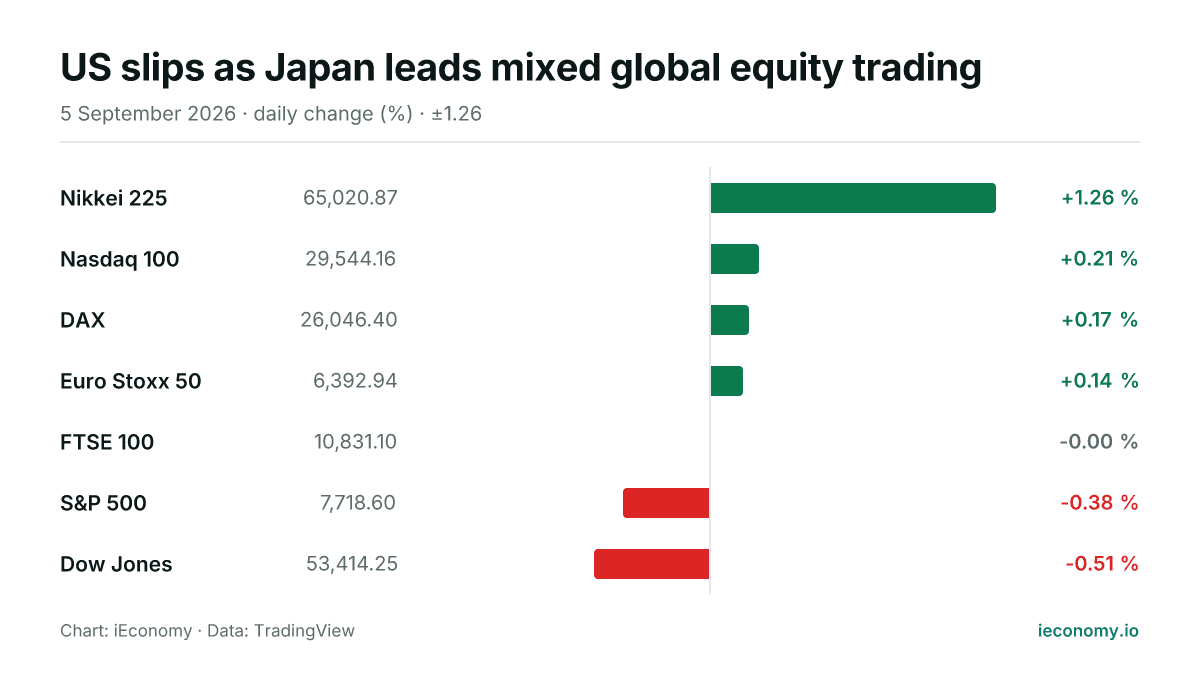
Chart: iEconomy · Data: TradingView
World equity trading was mixed on 2026-09-05, with four of the seven tracked benchmarks higher and three lower or flat. Japan led the session, while US gauges were the main laggards and Europe was modestly firmer.
What moved and by how much
The Nikkei 225 outpaced the rest of the group, rising 1.26% to 65,020.87. In the US, the Nasdaq 100 added 0.21% to 29,544.16, while the S&P 500 fell 0.38% and the Dow Jones lost 0.51%.
| Instrument | Last | Change |
|---|---|---|
| Nikkei 225 | 65,020.87 | +1.26 % |
| Nasdaq 100 | 29,544.16 | +0.21 % |
| DAX | 26,046.40 | +0.17 % |
| Euro Stoxx 50 | 6,392.94 | +0.14 % |
| FTSE 100 | 10,831.10 | -0.00 % |
| S&P 500 | 7,718.60 | -0.38 % |
| Dow Jones | 53,414.25 | -0.51 % |
European indices were marginally stronger. The DAX gained 0.17% to 26,046.40 and the Euro Stoxx 50 advanced 0.14% to 6,392.94. The FTSE 100 was effectively unchanged, down 0.00% on the day.
The standouts at each end
At the top of the table, the Nikkei 225 was the clearest outperformer by a wide margin. Its gain was notably larger than the modest moves seen across the US and Europe, which suggests a broader regional lead rather than a uniform global advance.
At the other end, the Dow Jones was the weakest of the tracked benchmarks, followed by the S&P 500. The difference matters because index composition affects the day’s shape: one benchmark can be held back by its sector mix even when another, such as the Nasdaq 100, is firmer.
The narrow spread in Europe showed a calmer tone. Small gains in the DAX and Euro Stoxx 50, alongside a flat FTSE 100, point to limited directional conviction rather than a decisive market-wide move.
What a long-term investor should take from one day
One session tells you more about relative performance than about any lasting trend. For a diversified investor, the useful takeaway is that leadership can rotate quickly between regions and index types, leaving broad portfolios with only modest net change.
Day-to-day index moves are mechanical snapshots of price formation, not a full investment thesis. They reflect how buyers and sellers are positioned at a moment in time, and they can be driven by index composition, trading flows and varying sensitivity to the same global backdrop.
That is why a single flat or negative reading does not by itself alter the longer horizon. The main risk in reading too much into one day is mistaking short-term volatility for a durable shift in market direction.
This article is not investment advice and recommends no asset, level or direction; a single session's move is not evidence of a trend. For background see Markets, Bear Market, BIST 100, and for terms the finance glossary.
Frequently asked questions
Which region led the day?
Japan led the tracked markets, with the Nikkei 225 rising 1.26%. Europe was modestly positive, while US benchmarks were mixed to lower.
Did any benchmark stand out on the downside?
The Dow Jones was the weakest of the seven, down 0.51%, and the S&P 500 also finished lower. The FTSE 100 was essentially flat.
How should investors interpret a mixed session like this?
A mixed day usually signals rotation rather than a single global move. Long-term investors are generally better served by focusing on diversification and on whether such moves repeat across multiple sessions, rather than on one day’s direction.
Sources
Related News
US gains offset Europe and Asia’s weaker tone
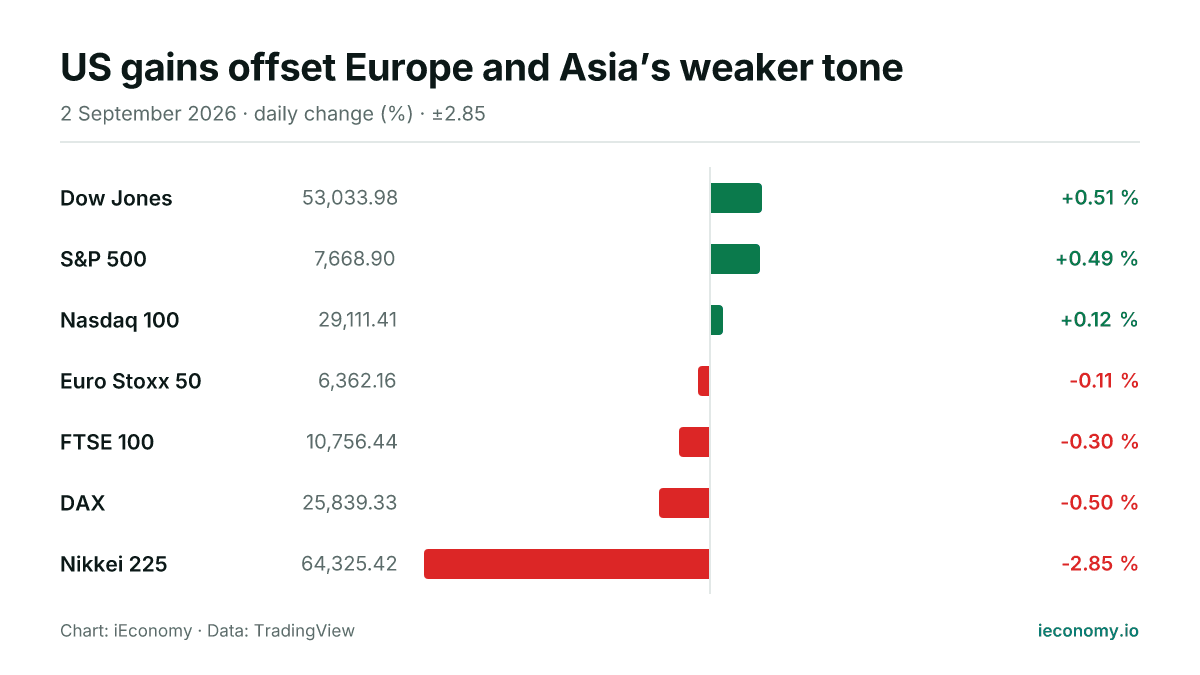
US equities advanced modestly while European benchmarks edged lower and Japan’s Nikkei 225 fell sharply. The day left three of seven tracked indices higher, with the strongest move still concentrated in Tokyo.
World equities soften across US, Europe and Asia
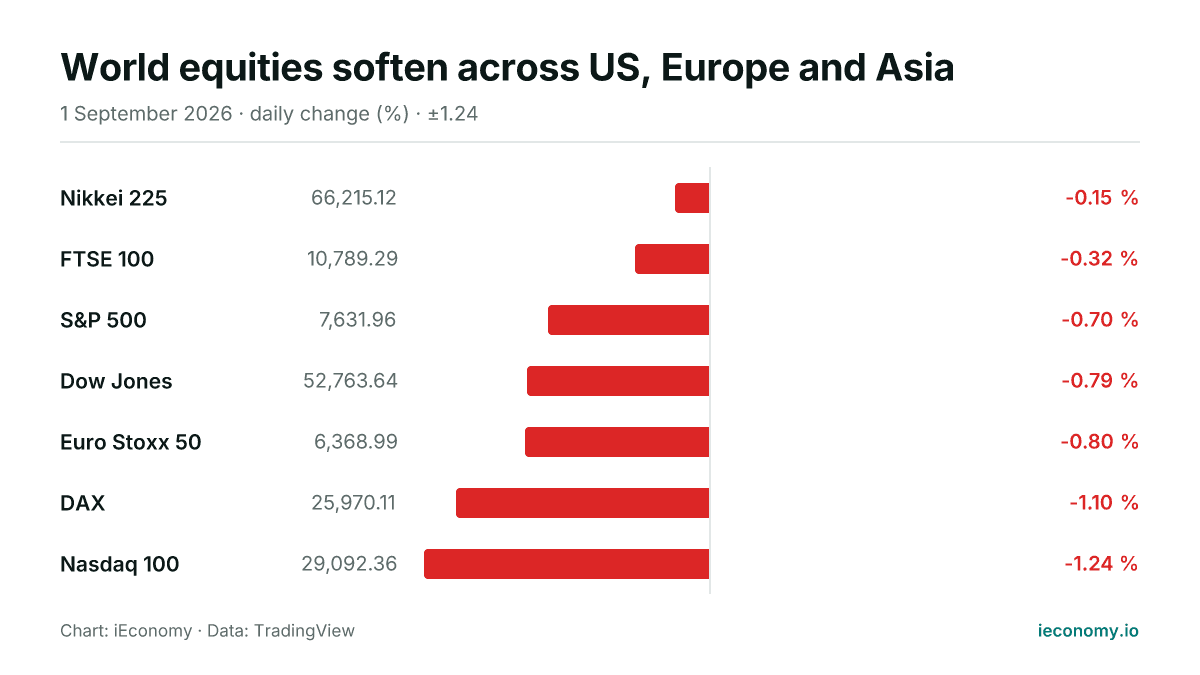
All seven tracked equity benchmarks were lower or flat on Tuesday, with US growth shares lagging and Europe also under pressure. The move was broad rather than concentrated, leaving no market in positive territory.
World equities mixed as Europe leads Saturday gains
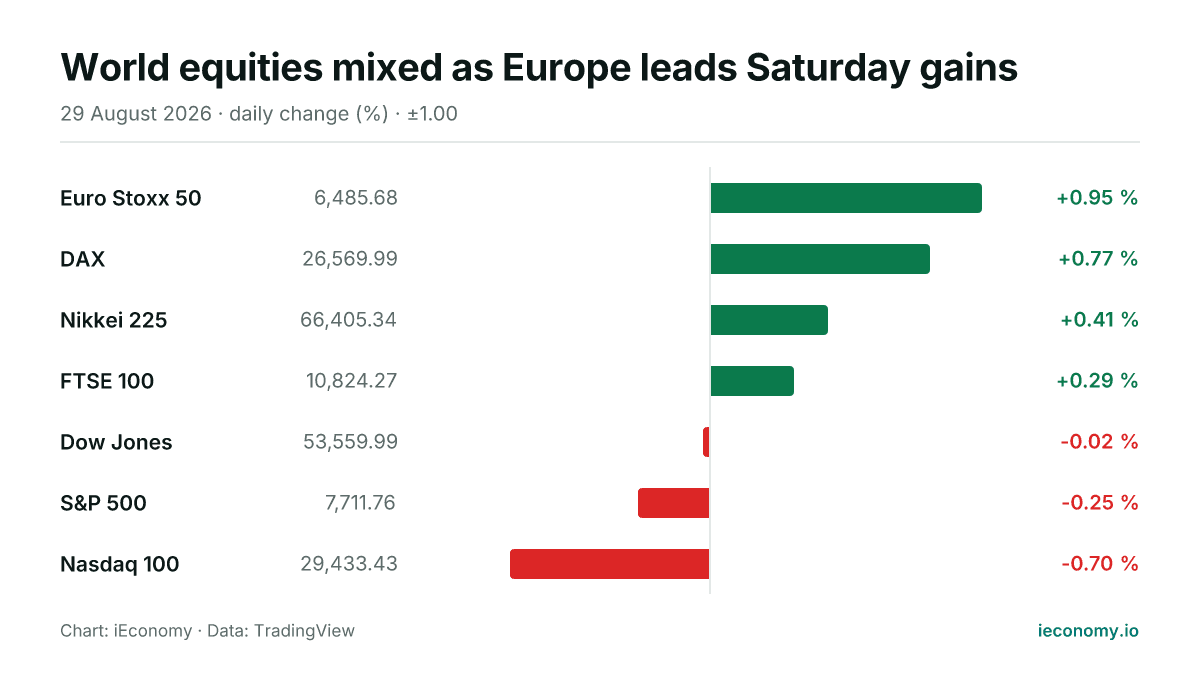
European benchmarks outperformed on Saturday, with the Euro Stoxx 50 and DAX posting the strongest advances. US indices were softer, while Asian equities were also firmer, led by the Nikkei 225.
World equities rise, led by Nikkei 225 jump on Friday
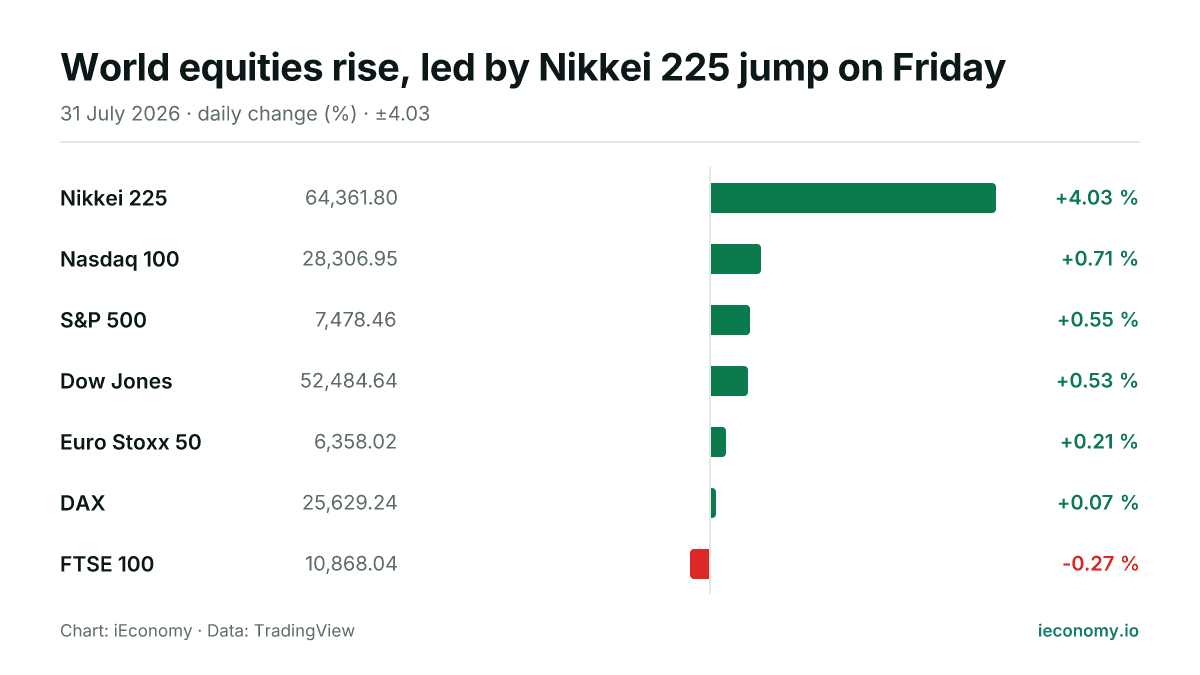
US, European and Asian indices were mostly higher on Friday, with the Nikkei 225 far ahead of the pack and the FTSE 100 the lone decliner. The moves were modest across most benchmarks, pointing to a broadly firmer but uneven session.
World equities mixed as Tokyo leads; US lags
Asian and European indices were mostly firmer on Friday, while US benchmarks finished lower in the digest. The move was uneven, with the Nikkei 225 the clear standout and the Dow Jones and S&P 500 among the weaker gauges.
Global equities rise across US, Europe and Asia
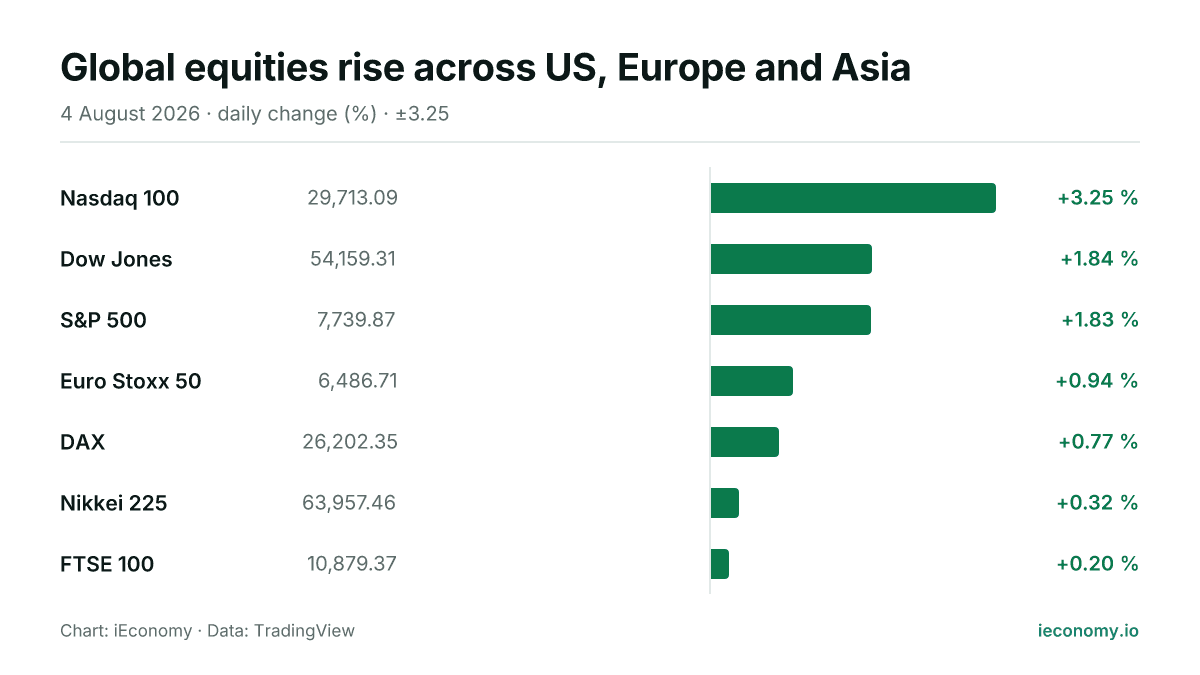
All seven tracked equity benchmarks finished higher in the digest, led by the Nasdaq 100. Gains were broad-based across the US, Europe and Asia, with no index flat or lower.