Global equities advance, led by US tech and Europe
US, European and Asian shares were mostly higher on Thursday, with the Nasdaq 100 and Euro Stoxx 50 out front. The FTSE 100 was the only major index to edge lower, leaving the broader picture tilted decisively to risk-on trading.
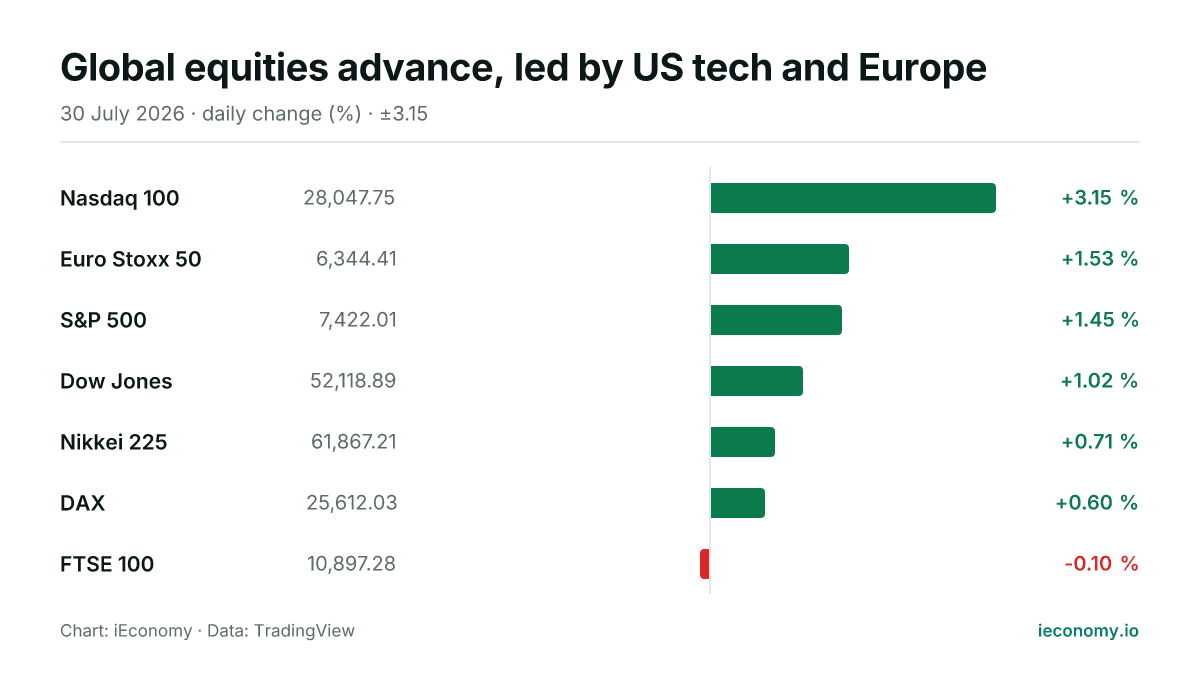
Chart: iEconomy · Data: TradingView
World equity markets were mostly firmer on Thursday, with six of the seven tracked indices higher and gains led by US technology and continental Europe. The Nasdaq 100 rose 3.15%, while the Euro Stoxx 50 added 1.53% and the S&P 500 gained 1.45%, pointing to broad participation rather than a move confined to one region. In Asia, the Nikkei 225 also advanced, while the FTSE 100 was the only major benchmark to slip, edging 0.10% lower.
What moved and by how much
The day’s strongest move came from the Nasdaq 100 at 28,047.75, which outperformed the wider US market and lifted the tone across global benchmarks. The S&P 500 and Dow Jones both traded higher as well, with the Dow up 1.02%. In Europe, the Euro Stoxx 50 and DAX each moved up solidly, while the FTSE 100 was comparatively subdued and finished marginally lower. In Asia, the Nikkei 225 posted a smaller but still positive gain. With all major US and European benchmarks but one higher, the session showed a clear tilt toward buyers across regions.
| Instrument | Last | Change |
|---|---|---|
| Nasdaq 100 | 28,047.75 | +3.15 % |
| Euro Stoxx 50 | 6,344.41 | +1.53 % |
| S&P 500 | 7,422.01 | +1.45 % |
| Dow Jones | 52,118.89 | +1.02 % |
| Nikkei 225 | 61,867.21 | +0.71 % |
| DAX | 25,612.03 | +0.60 % |
| FTSE 100 | 10,897.28 | -0.10 % |
The standouts at each end
At the top of the board, the Nasdaq 100 was the clear standout, followed by the Euro Stoxx 50 and then the S&P 500. At the other end, the FTSE 100 was the only index in negative territory, and its move was small enough to indicate stagnation rather than outright selling pressure. The spread between the day’s strongest and weakest movers underscores how quickly leadership can rotate between sectors and regions even within a broadly positive session.
What a long-term investor should take from one day
For long-term investors, the main point is that a single session mainly reflects the mechanics of market positioning, index composition and relative sector strength. A broad advance across US, European and Asian benchmarks can improve sentiment, but it does not by itself establish a trend. The more durable message is that diversification still matters: even on a strong day, some markets can lag or decline, and index-level moves may mask very different underlying drivers across regions. As always, short-term swings can be sharp, so risk remains present despite the positive tone.
Sources
Related News
World equities edge lower as Europe lags Asian trade
US stock benchmarks were lower in early trade while Europe and Asia also weakened, leaving only the FTSE 100 in positive territory. The move was broad rather than dramatic, with one modest gain against six declines.
US and Europe rise as Nikkei lags on Sunday
Most major equity benchmarks advanced on Sunday, with gains spread across the US and Europe. Asia was mixed, and the Nikkei 225 stood out on the downside.

Wall Street and Europe advance as Nikkei lags
US and European equity benchmarks were higher on Saturday, while Japan’s Nikkei 225 fell sharply. The day’s spread shows how index performance can diverge even within the same broad global risk backdrop.

Agnico Eagle falls below its 200-day average
Agnico Eagle Mines slipped under its 200-day moving average on Thursday, trading as low as $178 and roughly 3% lower on the session.
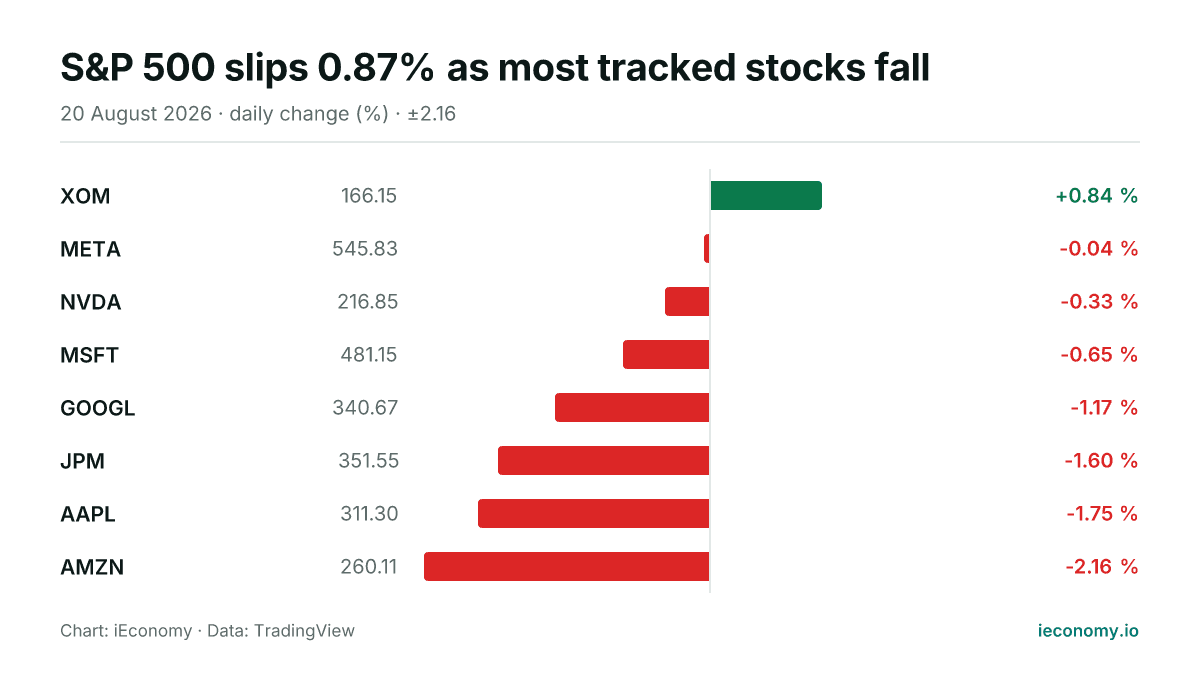
S&P 500 slips 0.87% as most tracked stocks fall
The S&P 500 ended Thursday at 7,641.16, down 0.87% on the session. Among the eight tracked constituents, one finished higher and seven were lower, with AMZN the weakest and XOM the strongest.
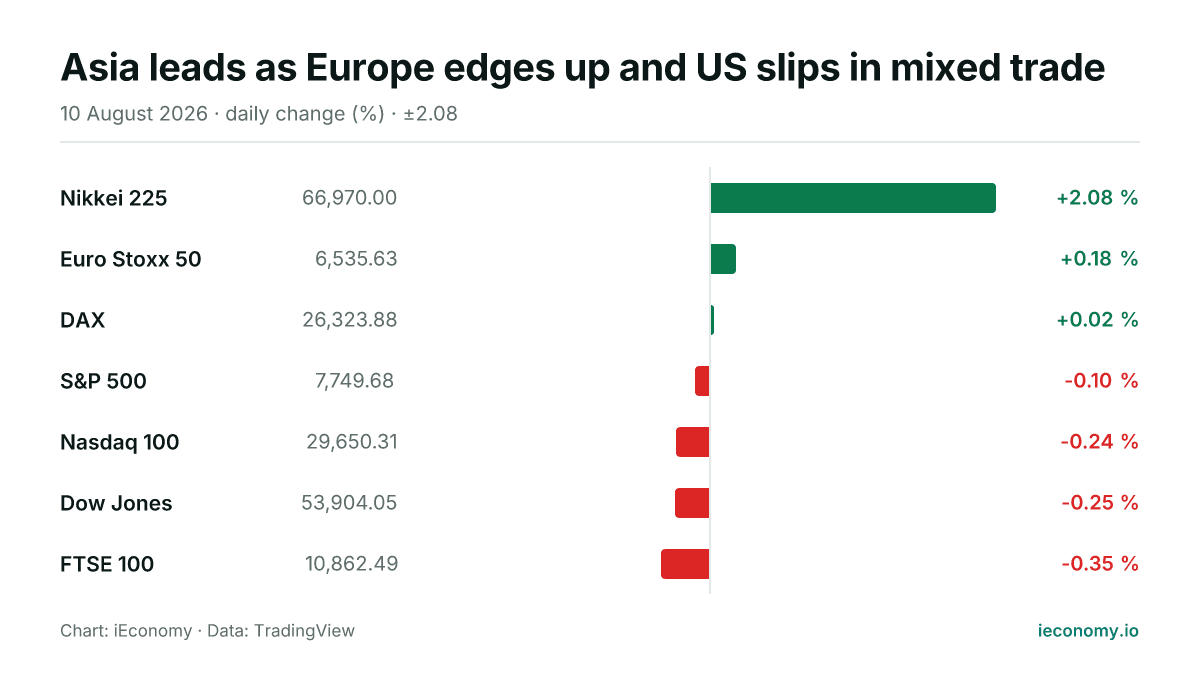
Asia leads as Europe edges up and US slips in mixed trade
Asian equities outperformed on Monday, led by a sharp rise in Tokyo, while Europe was broadly firmer and US benchmarks eased. The moves were modest in most cases, but they left the day’s tone mixed across regions.