Wall Street and Europe advance as Nikkei lags
US and European equity benchmarks were higher on Saturday, while Japan’s Nikkei 225 fell sharply. The day’s spread shows how index performance can diverge even within the same broad global risk backdrop.

Epicgenius / Wikimedia Commons (cc-by-sa-4.0)
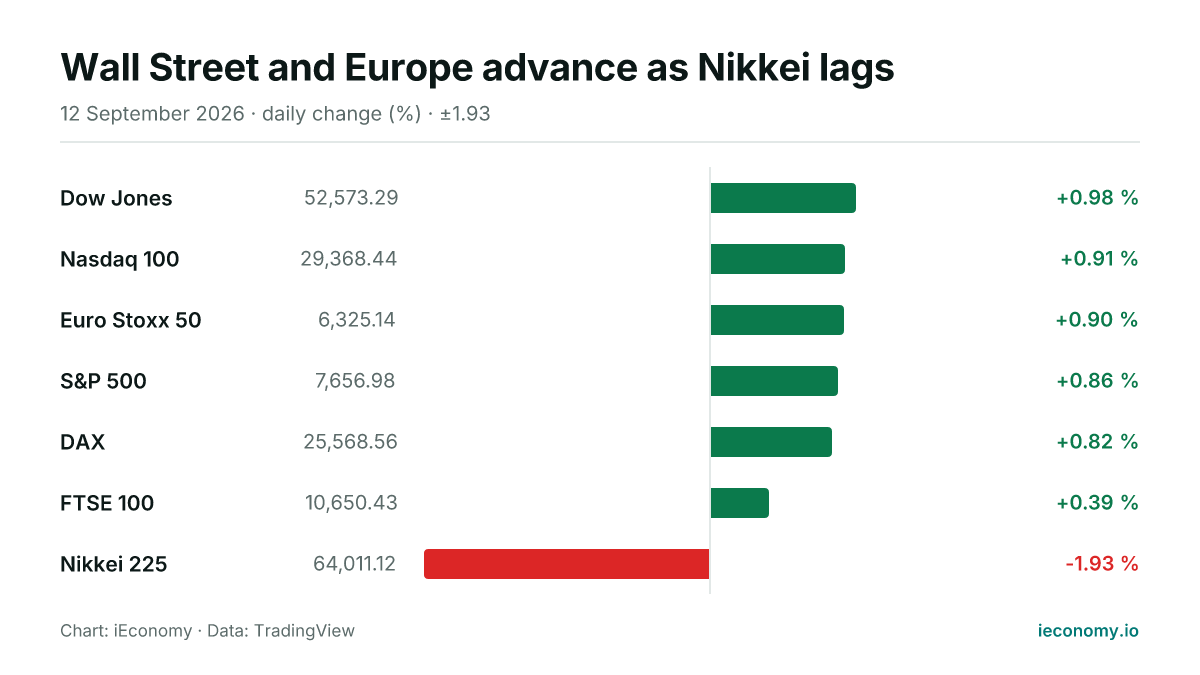
World equity benchmarks were mostly higher on Saturday, with six of the seven tracked indices advancing and only the Nikkei 225 lower. The gains were led by the Dow Jones, while Europe also posted broad strength and Japan stood out on the downside.
What moved and by how much
The Dow Jones rose 0.98% and the Nasdaq 100 added 0.91%, keeping US large-cap benchmarks in positive territory. The S&P 500 was up 0.86%, indicating a broad, if not uniform, bid across American equities rather than a move confined to one style or sector.
| Instrument | Last | Change |
|---|---|---|
| Dow Jones | 52,573.29 | +0.98 % |
| Nasdaq 100 | 29,368.44 | +0.91 % |
| Euro Stoxx 50 | 6,325.14 | +0.90 % |
| S&P 500 | 7,656.98 | +0.86 % |
| DAX | 25,568.56 | +0.82 % |
| FTSE 100 | 10,650.43 | +0.39 % |
| Nikkei 225 | 64,011.12 | -1.93 % |
Europe followed with smaller but still firm advances. The Euro Stoxx 50 gained 0.90%, the DAX rose 0.82% and the FTSE 100 added 0.39%, leaving the region generally higher even though the UK benchmark lagged its continental peers.
The Nikkei 225 moved in the opposite direction, falling 1.93% and clearly breaking the day’s positive pattern elsewhere. That kind of gap matters because index performance can diverge when local weighting, currency moves or position adjustment affect one market more than others, even if the wider tone appears constructive.
The standouts at each end
On the upside, the Dow Jones posted the biggest rise among the tracked benchmarks, while the Euro Stoxx 50 and Nasdaq 100 also delivered near-1% gains. Those moves point to a day when leading equity barometers held up together rather than producing a narrow advance.
At the other end, the Nikkei 225 was the clear outlier and the only decline in the group. The size of that fall was enough to outweigh any modest steadiness elsewhere in Asia, although no broader regional index picture is provided in the digest beyond that single benchmark.
The FTSE 100’s 0.39% gain was the smallest rise in the set, but it still left London in positive territory. In practical terms, that means the day was not dominated by a single market; instead, the pattern was one of broad gains with one pronounced exception.
What a long-term investor should take from a single day
A one-day move is best read as a snapshot of relative performance, not a verdict on fundamentals. Daily index swings can reflect mechanics such as sector composition, weighting differences and the interaction between local and global trading flows.
For a long-term investor, the main takeaway is that diversification can produce very different outcomes across regions in the same session. Broadly positive US and European moves do not prevent a sharp loss in Japan, and that dispersion is a normal feature of global equity markets.
Short-term moves also matter because they can alter portfolio balances, especially in index-tracking or regionally concentrated holdings. But a single session should be treated with caution: it shows where price action is concentrated now, not where markets will settle next.
This article is not investment advice and recommends no asset, level or direction; a single session's move is not evidence of a trend. For background see Markets, Bear Market, BIST 100, and for terms the finance glossary.
Frequently asked questions
Which markets were strongest on the day?
The Dow Jones was the strongest gainer among the tracked indices, up 0.98%. The Nasdaq 100, Euro Stoxx 50 and S&P 500 were also higher by close to 1% or less, which shows broad participation in the advance.
What was the main outlier?
The Nikkei 225 was the only market in the set to fall, dropping 1.93%. That made it the clear outlier against an otherwise positive global tone, and it is the main reminder that regional markets can move very differently on the same day.
What should investors do with a move like this?
From a market-mechanics perspective, the sensible reading is to note dispersion and avoid over-interpreting one session. Daily moves can reshape relative performance, but without a longer sequence they do not establish a trend or a forecast.
Sources
Related News

Global equities ease; Nikkei edges higher
US and European indices were lower in Thursday trading, while Asia was mixed. The Nikkei 225 rose modestly, leaving one gain against six declines across the seven markets tracked.
Global equities slip across US, Europe and Asia
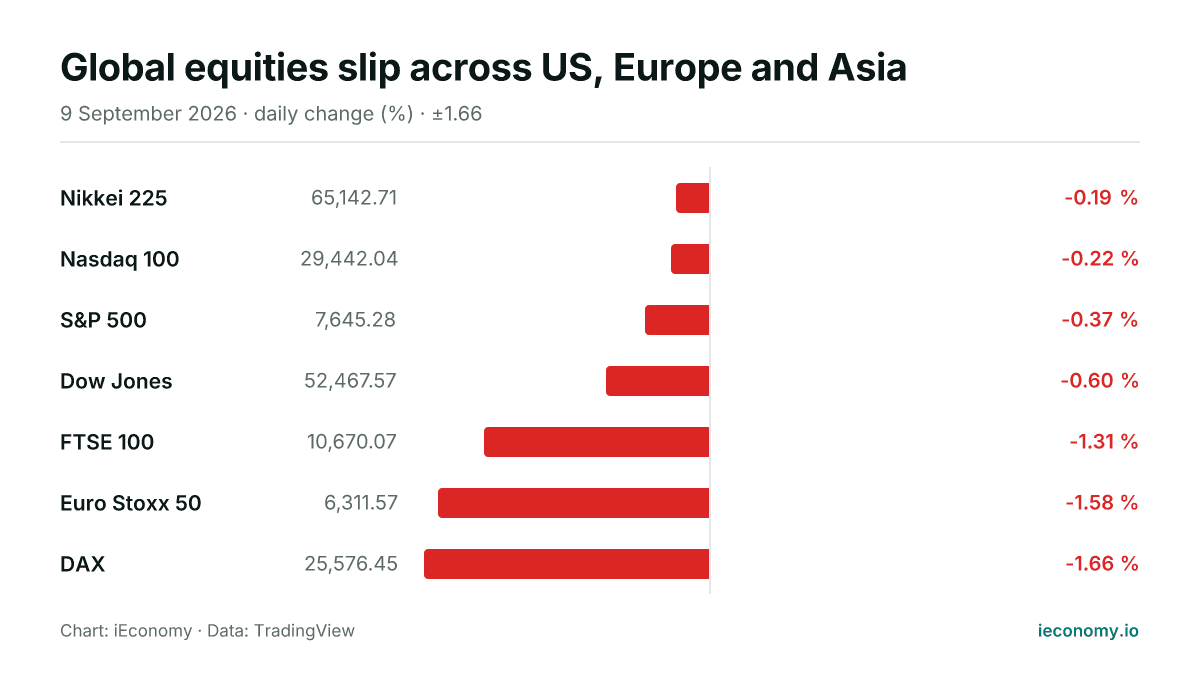
All seven tracked indices were lower or flat on Wednesday, with Europe leading the declines and the Dow among the weakest in the US. The session was broadly risk-off, but only the price action itself is visible here.
World equities mixed as Europe edges up, US slips
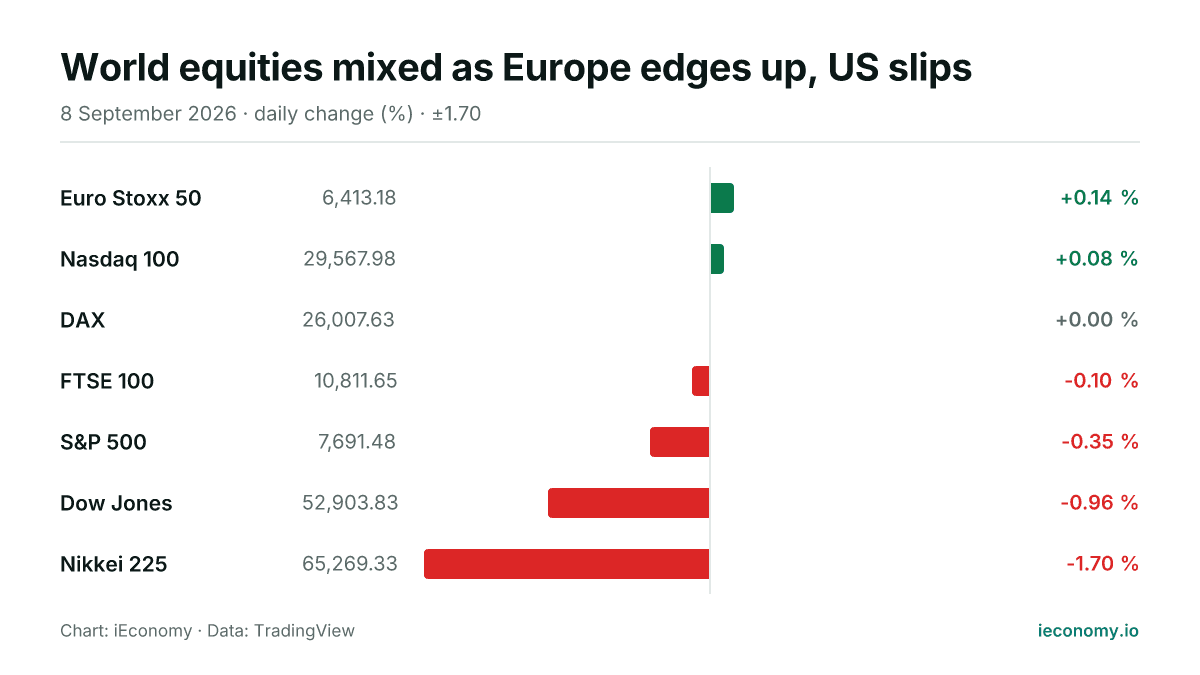
European shares were modestly firmer, US indices were mixed to lower, and Tokyo lagged. The day’s moves were small in much of Europe but sharper in the US and Japan, showing uneven risk appetite.
S&P 500 slips 0.48% to 7,636.36 in mixed trade
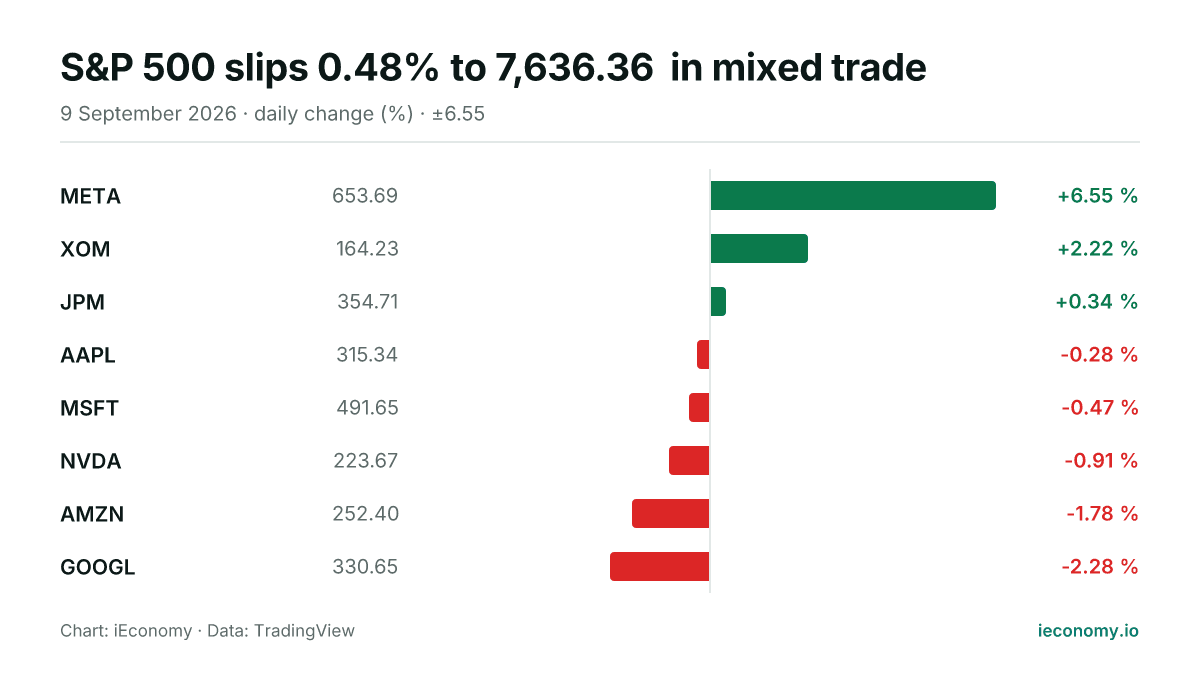
The S&P 500 ended the Wednesday, 2026-09-09 session lower, with 3 of 8 tracked constituents advancing and 5 declining. META was the best performer, while GOOGL was the weakest.

Oil Extends Gains as Iran Tensions Lift Prices
Oil rose for a fifth straight session as stalled U.S.-Iran talks and sharper rhetoric from Donald Trump stoked supply fears in West Asia, pushing Brent and WTI to multi-week highs.
US slips as Japan leads mixed global equity trading
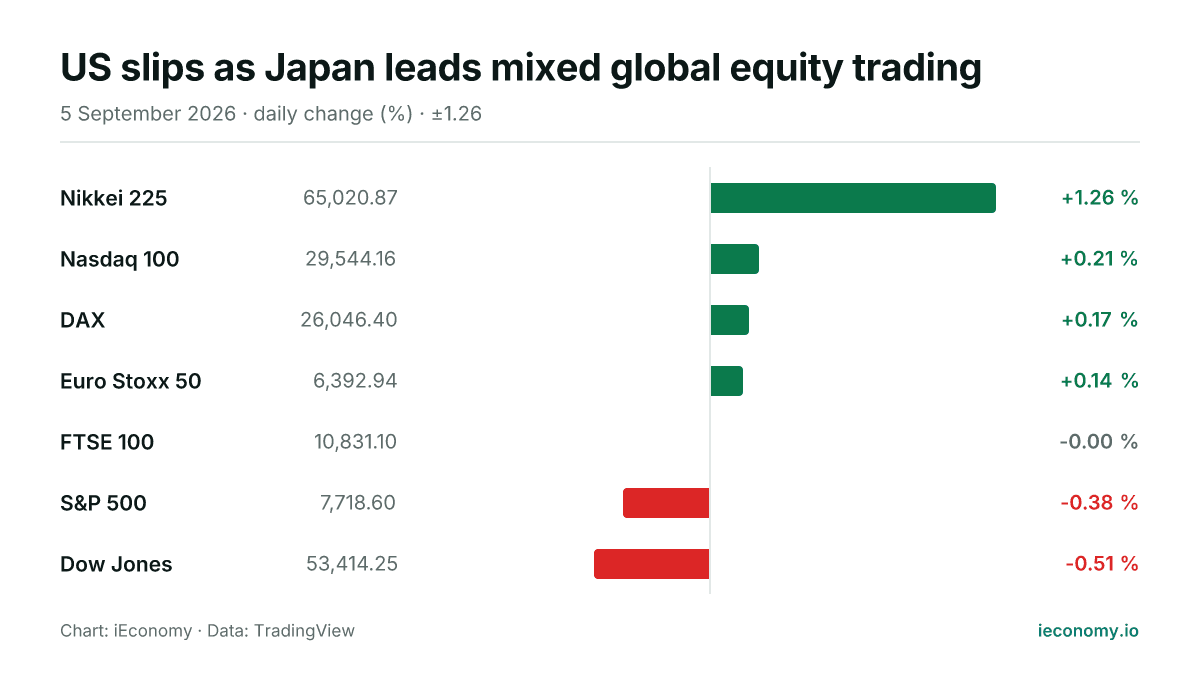
World equities were mixed on 2026-09-05, with Japan leading gains and US benchmarks mostly weaker. Europe edged higher, while the FTSE 100 was flat as the Dow and S&P 500 lagged.