Europe leads as US tech underperforms on Friday
European and Asian benchmarks advanced on Friday, while the main US averages were mixed to weaker. The day’s moves were modest in the US and broader in Europe, leaving regional performance uneven.
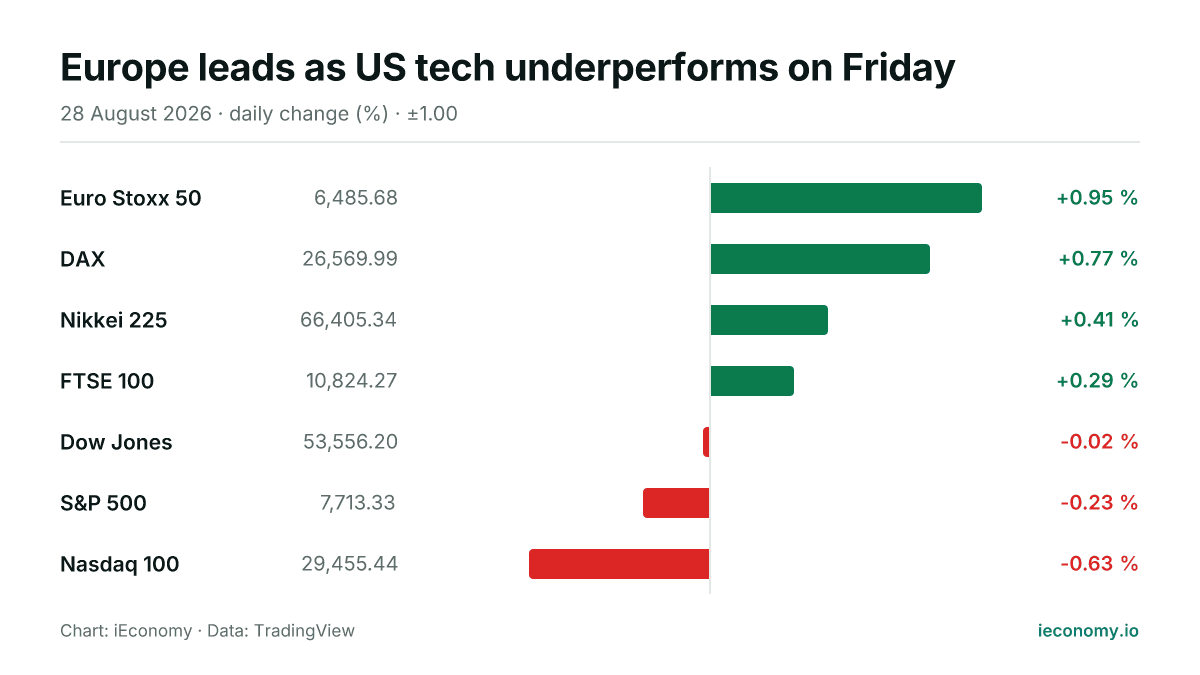
Chart: iEconomy · Data: TradingView
World equity markets were mixed on Friday, with four of the seven tracked benchmarks higher and three lower or flat. Europe set the pace, Asia also firmed, and the main US indices were weaker overall, led by a drop in the Nasdaq 100.
What moved and by how much
Euro Stoxx 50 rose 0.95% and DAX gained 0.77%, while FTSE 100 added 0.29%. In Asia, Nikkei 225 advanced 0.41%. The US picture was softer: Dow Jones was down 0.02%, S&P 500 fell 0.23% and Nasdaq 100 dropped 0.63%.
| Instrument | Last | Change |
|---|---|---|
| Euro Stoxx 50 | 6,485.68 | +0.95 % |
| DAX | 26,569.99 | +0.77 % |
| Nikkei 225 | 66,405.34 | +0.41 % |
| FTSE 100 | 10,824.27 | +0.29 % |
| Dow Jones | 53,556.20 | -0.02 % |
| S&P 500 | 7,713.33 | -0.23 % |
| Nasdaq 100 | 29,455.44 | -0.63 % |
The scale of the changes suggests a rotational session rather than a broad risk-off move. The strongest gains were in continental Europe, while the weakest finish among the tracked gauges came from the US technology-heavy Nasdaq 100.
The standouts at each end
Euro Stoxx 50 was the biggest riser in the group, helped by a move that was broad enough to lift the regional benchmark above the others. At the other end, Nasdaq 100 was the clear laggard, extending the gap between technology and the more defensive parts of the market.
FTSE 100 and Nikkei 225 were both positive but less forceful, which points to a session where gains were present without a single dominant global theme. Dow Jones sat close to flat, showing how narrowly the US blue-chip market moved compared with the other benchmarks.
What a long-term investor should take from one day
One session mainly shows how index construction matters. A technology-heavy index can fall more sharply than a broader benchmark even when the overall market mood is only mildly negative, because the largest constituents and sector weights drive the daily move.
For long-term investors, the main lesson is to separate daily noise from portfolio structure. A mixed day across regions does not by itself alter the broader picture, but it does highlight that regional and sector exposure can change short-term performance materially.
This article is not investment advice and recommends no asset, level or direction; a single session's move is not evidence of a trend. For background see Markets, Bear Market, BIST 100, and for terms the finance glossary.
Frequently asked questions
Why did Europe look stronger than the US on Friday?
Why was the Nasdaq 100 weaker than the Dow Jones? The Nasdaq 100 fell 0.63%, while the Dow Jones was down 0.02%. That difference usually reflects index composition: a technology-heavy index can move more than a broader blue-chip gauge when risk appetite shifts even slightly.
Why was the Nasdaq 100 weaker than the Dow Jones?
What does a mixed day like this mean for investors? A mixed day is best read as a snapshot of relative performance, not a signal about direction over longer horizons. It can, however, remind investors that regional exposure and sector weights matter because they shape how a portfolio behaves when leadership changes.
Sources
Related News
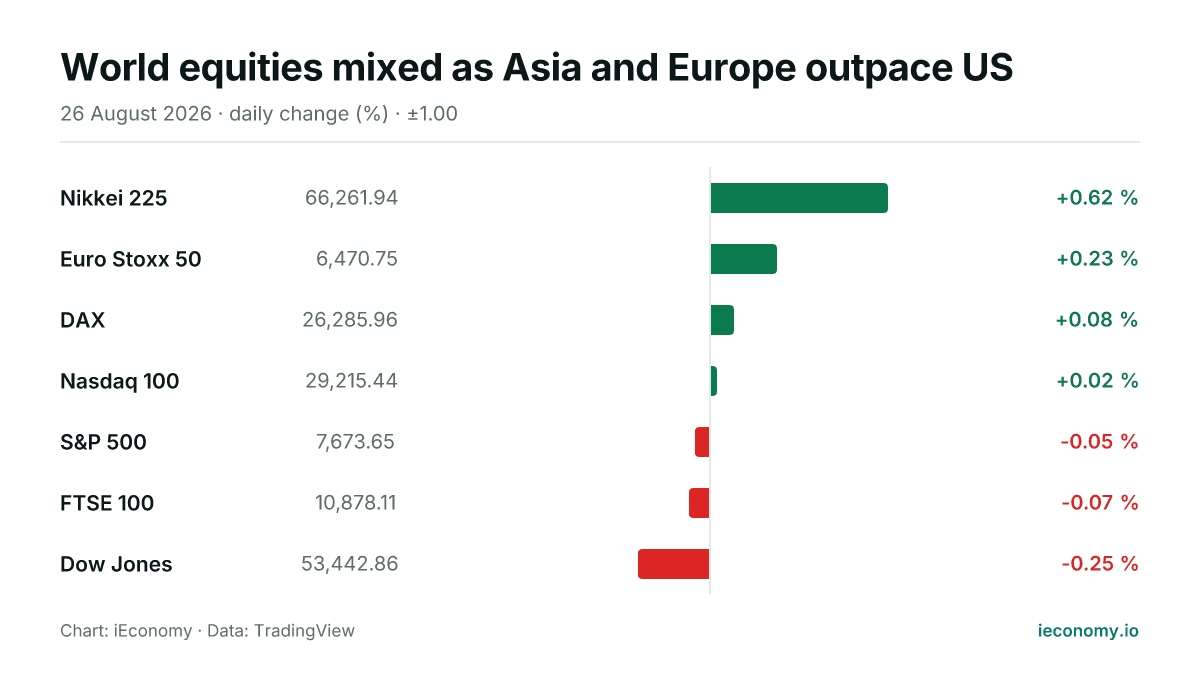
World equities mixed as Asia and Europe outpace US
Asian and European benchmarks edged higher as US indices were mixed in early trading. The moves were modest overall, with the Nikkei 225 leading and the Dow Jones the weakest in the group.
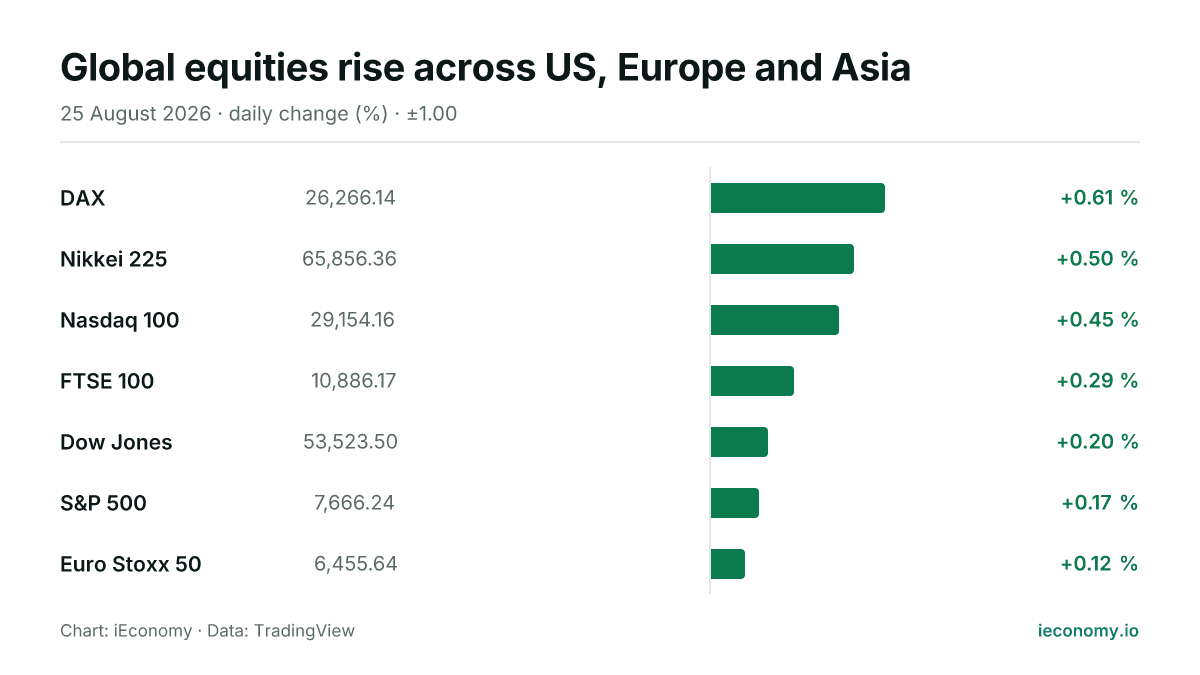
Global equities rise across US, Europe and Asia
All seven tracked benchmarks were higher on Tuesday, with gains led by Germany’s DAX and Japan’s Nikkei 225. The moves were broadly modest, leaving the day more notable for breadth than for size.
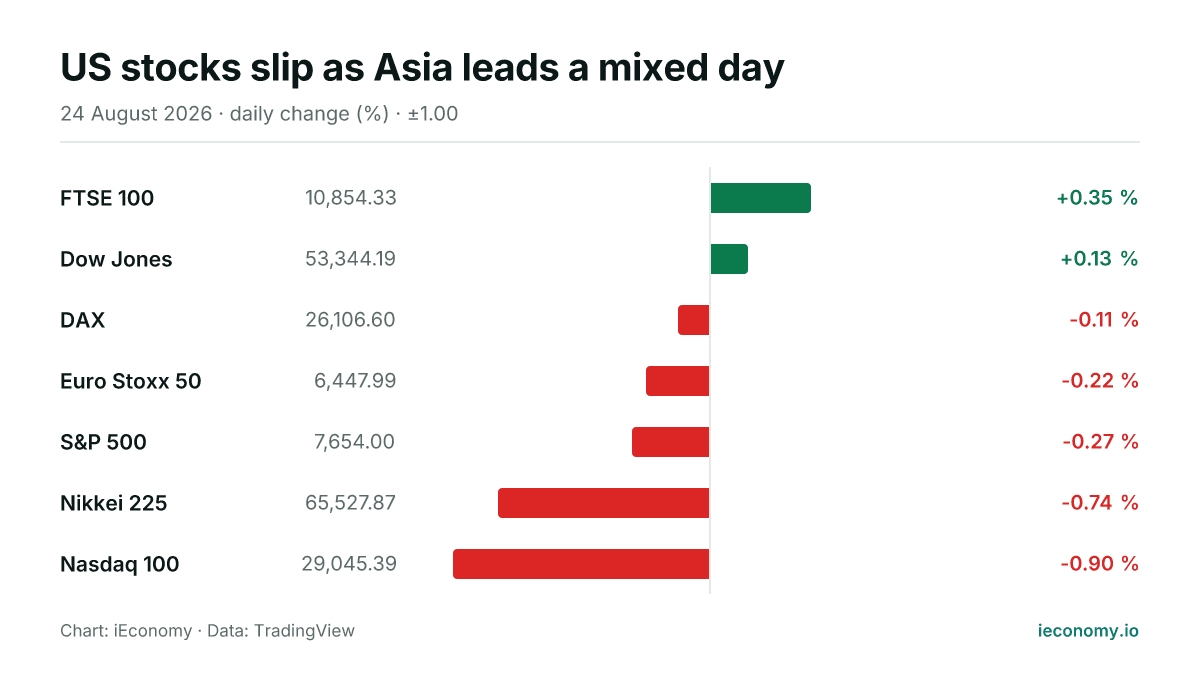
US stocks slip as Asia leads a mixed day
US equities were softer, Europe was broadly lower and Asia fell more sharply, leaving a mixed global tone on Monday. The FTSE 100 and Dow Jones edged higher while the Nikkei 225 and Nasdaq 100 underperformed.
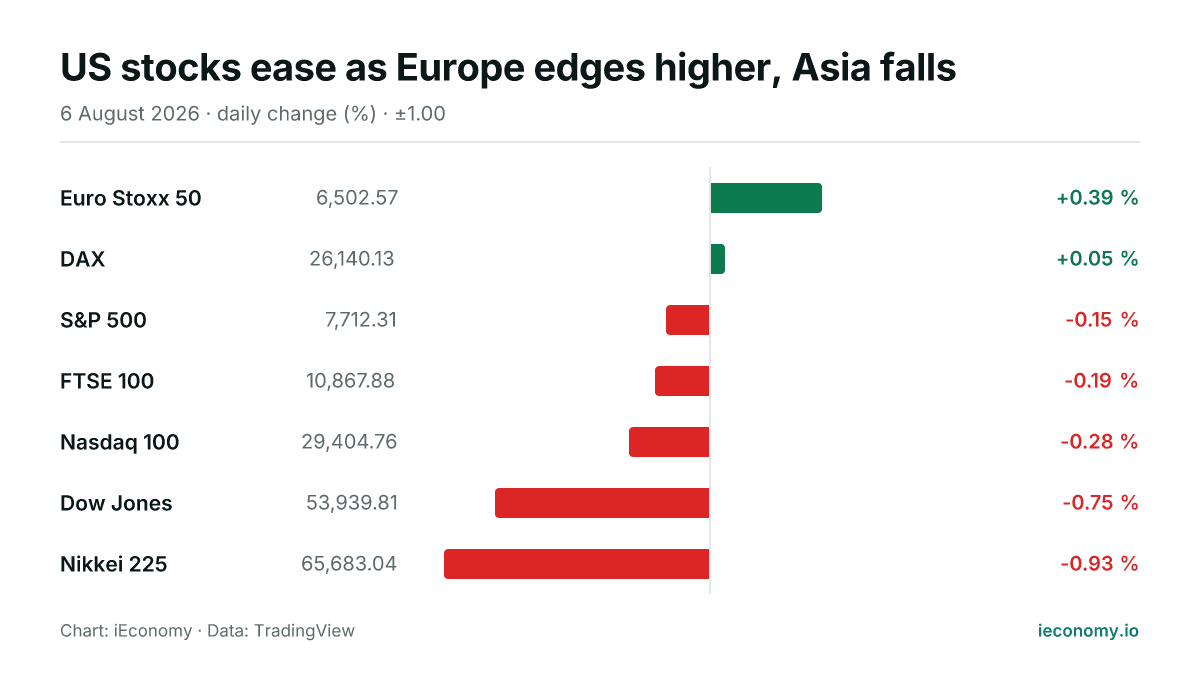
US stocks ease as Europe edges higher, Asia falls
European benchmarks posted modest gains on Thursday, while US and Asian indices traded lower. The day’s moves were contained, with a narrow split between the two European winners and five weaker or flat markets overall.
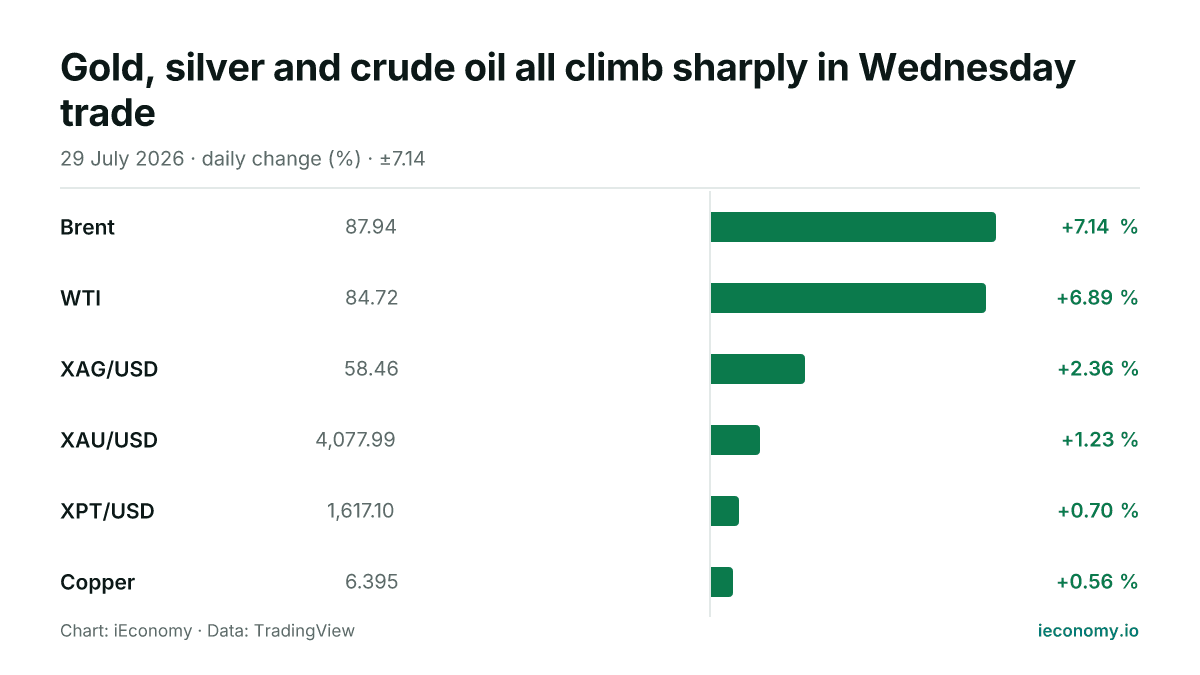
Gold, silver and crude oil all climb sharply in Wednesday trade
All six tracked commodities were higher on Wednesday, with crude oil leading the move and silver also posting a strong gain. Gold advanced more modestly, while platinum and copper lagged the pack but still rose.
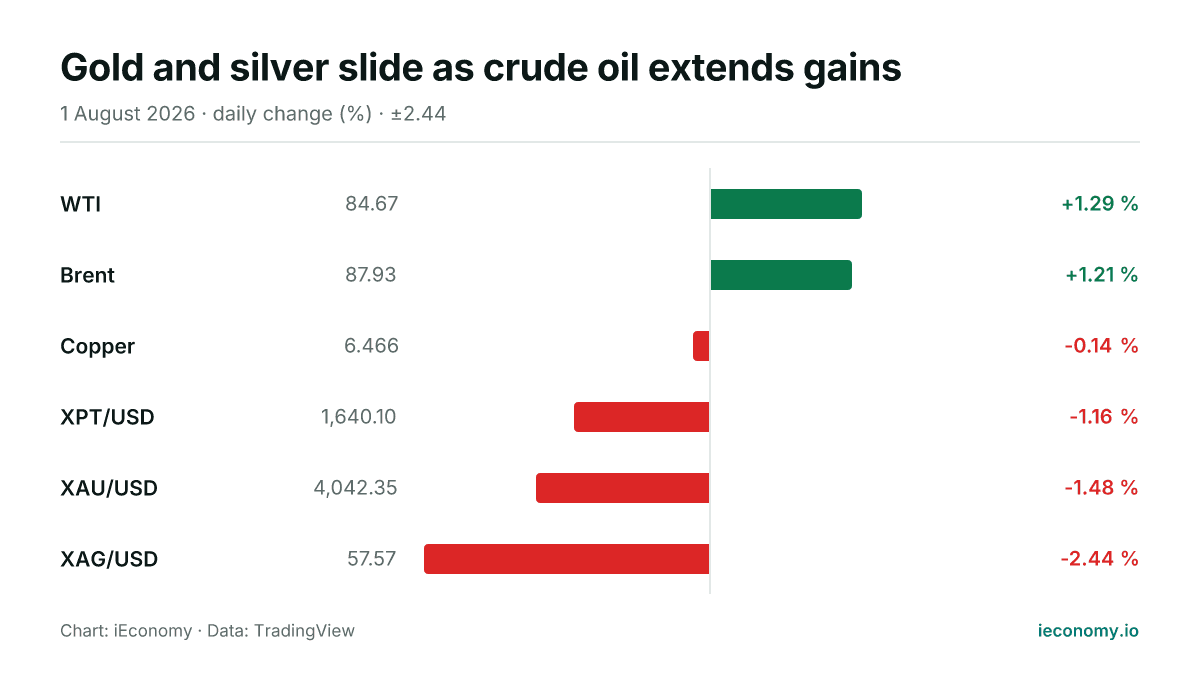
Gold and silver slide as crude oil extends gains
On Saturday, August 1, gold and silver were both lower, while WTI and Brent advanced. The moves leave the metals under pressure and keep crude on the firm side in mid-session trading.