US-led gains lift global equities; Nikkei slips
US, European and Asian equities were mixed but broadly firmer on Thursday, with six of seven tracked benchmarks higher. The Nasdaq 100 led the advance, while the Nikkei 225 was the lone decliner.
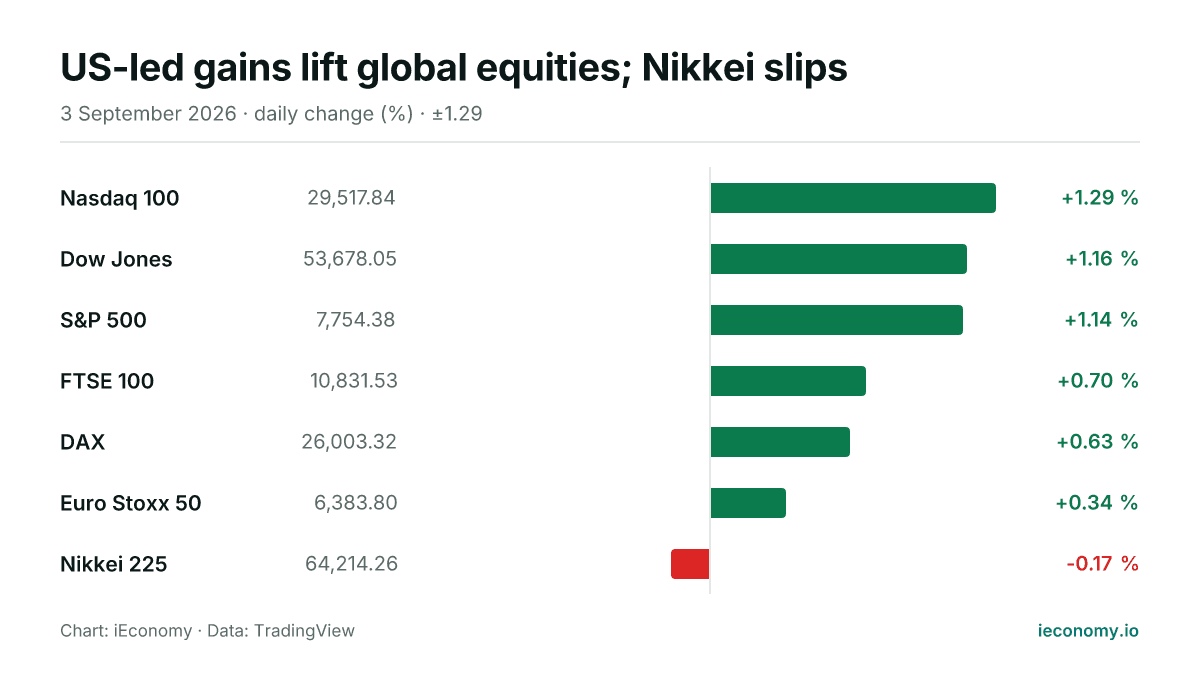
Chart: iEconomy · Data: TradingView
World equity markets were broadly higher on Thursday, with six of the seven tracked indices advancing and only the Nikkei 225 edging lower. Gains were strongest in the US, while Europe followed with smaller but still positive moves.
What moved and by how much
The Nasdaq 100 rose 1.29% to 29,517.84, leading the pack. The Dow Jones gained 1.16% and the S&P 500 added 1.14%, showing a broad US advance rather than a narrow technology-led move alone.
| Instrument | Last | Change |
|---|---|---|
| Nasdaq 100 | 29,517.84 | +1.29 % |
| Dow Jones | 53,678.05 | +1.16 % |
| S&P 500 | 7,754.38 | +1.14 % |
| FTSE 100 | 10,831.53 | +0.70 % |
| DAX | 26,003.32 | +0.63 % |
| Euro Stoxx 50 | 6,383.80 | +0.34 % |
| Nikkei 225 | 64,214.26 | -0.17 % |
European benchmarks also finished in the green at the time of writing. The FTSE 100 added 0.70%, the DAX rose 0.63% and the Euro Stoxx 50 increased 0.34%, a pattern that points to steady rather than aggressive buying.
In Asia, the Nikkei 225 moved the other way, slipping 0.17%. That left it as the only lower market in the digest and highlighted that the regional tone was mixed even as the wider global picture remained constructive.
The standouts at each end
On the upside, the Nasdaq 100 was the clear leader among the tracked indices. The size of the move mattered as much as the level, because a gain above 1% in a major benchmark can influence sentiment across related futures, ETFs and derivative hedges.
At the other end, the Nikkei 225 was the sole laggard. Even a modest decline can matter in a market-wide snapshot because it breaks the otherwise positive pattern and reminds readers that equity sessions can diverge by region, sector mix and currency sensitivity.
The US indices also clustered near one another in percentage terms, which suggests a broad risk-on tone rather than an isolated spike in one corner of the market. In Europe, the smaller gains imply participation, but with less force than the US move.
What a long-term investor should take from one day
A single trading day mostly shows positioning and sentiment flow, not a durable trend. For long-term investors, the useful takeaway is that diversification still matters: a positive global headline can coexist with a regional outlier, as Thursday’s Nikkei move shows.
Mechanically, index moves reflect the weighted performance of their constituents, so a handful of large stocks can shape the headline even when broader participation is less dramatic. That is why day-to-day swings should be read as market temperature, not a standalone investment signal.
Short-term volatility also means that leaders can change quickly between regions and sectors. The prudent interpretation is to note the breadth of the advance, the relative strength of the US and the smaller European gains, while keeping the one-day move in context.
This article is not investment advice and recommends no asset, level or direction; a single session's move is not evidence of a trend. For background see Markets, Bear Market, BIST 100, and for terms the finance glossary.
Frequently asked questions
Which market was strongest on Thursday?
The Nasdaq 100 was the strongest of the seven tracked indices, rising 1.29% to 29,517.84. It outpaced the Dow Jones and S&P 500, and it also led the European benchmarks by a clear margin.
Was the advance broad-based?
Yes, broadly speaking. Six of the seven tracked indices were higher, with gains spread across the US and Europe, while the Nikkei 225 was the only market in negative territory.
What should investors do with a move like this?
Use it as context rather than as a signal. A single session can reflect short-term flows and index mechanics, so long-term investors are better served by watching whether a pattern persists across multiple sessions and regions.
Sources
Related News
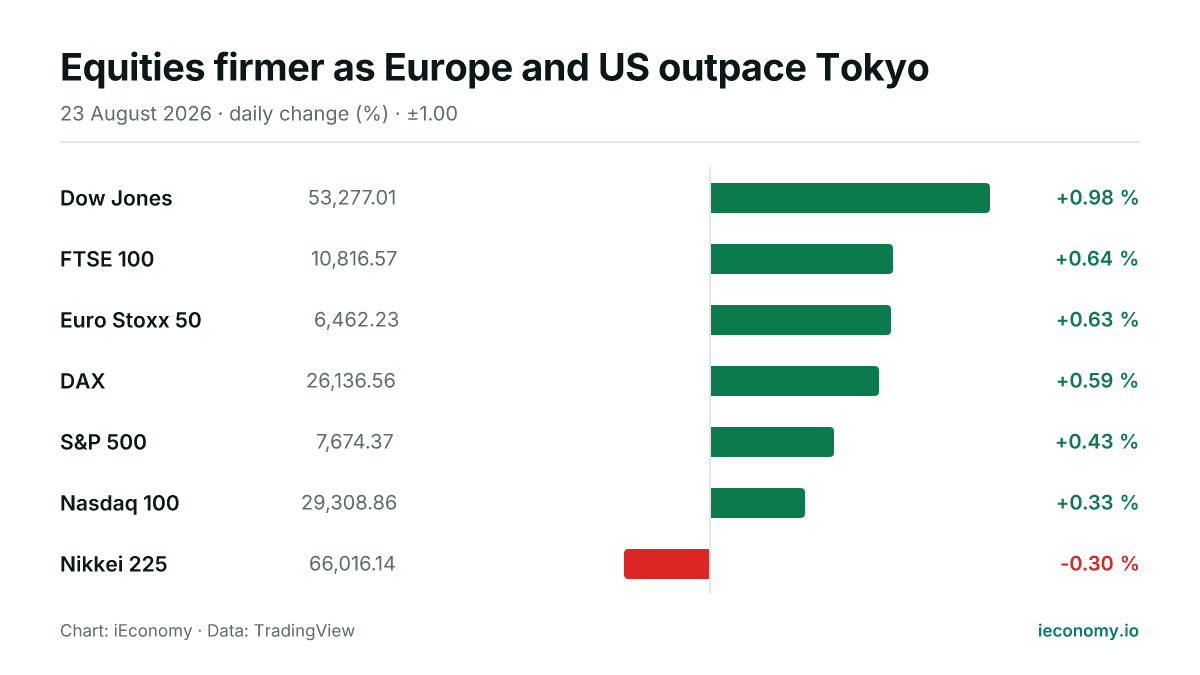
Equities firmer as Europe and US outpace Tokyo
Most major equity benchmarks were higher on Sunday, with gains led by the Dow and broad advances in Europe and the US. The Nikkei 225 was the only index in the red, leaving the day’s picture mixed but still broadly constructive.
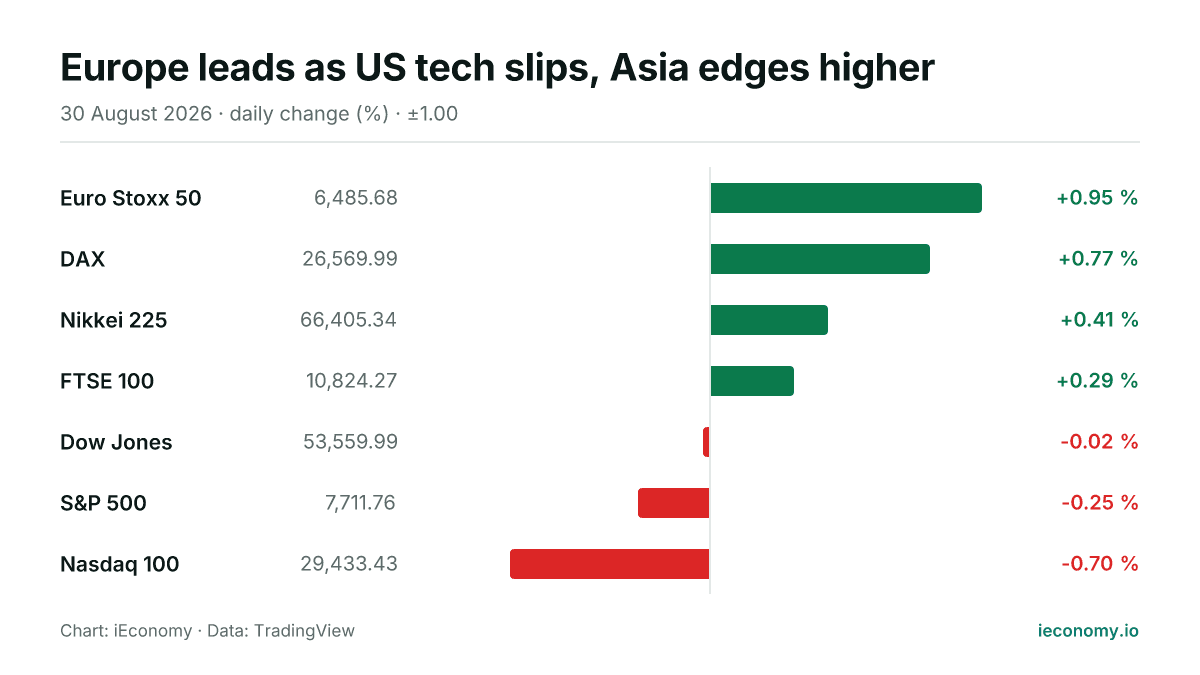
Europe leads as US tech slips, Asia edges higher
European benchmarks outperformed on Sunday, while Asian equities were firmer and the main US averages finished lower. The day’s moves were modest in some cases, but the spread between winners and laggards was clear.
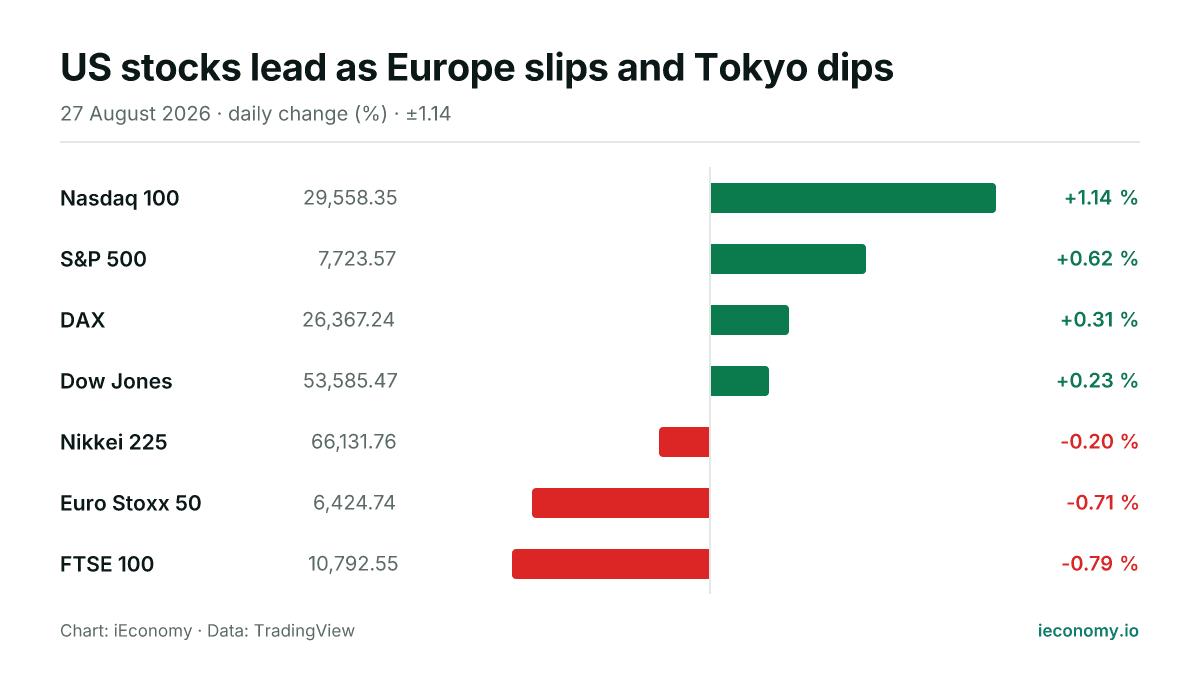
US stocks lead as Europe slips and Tokyo dips
US benchmarks were higher in Thursday trading, with the Nasdaq 100 leading gains. European indices were mixed to softer and the Nikkei 225 edged lower, leaving a split global session.
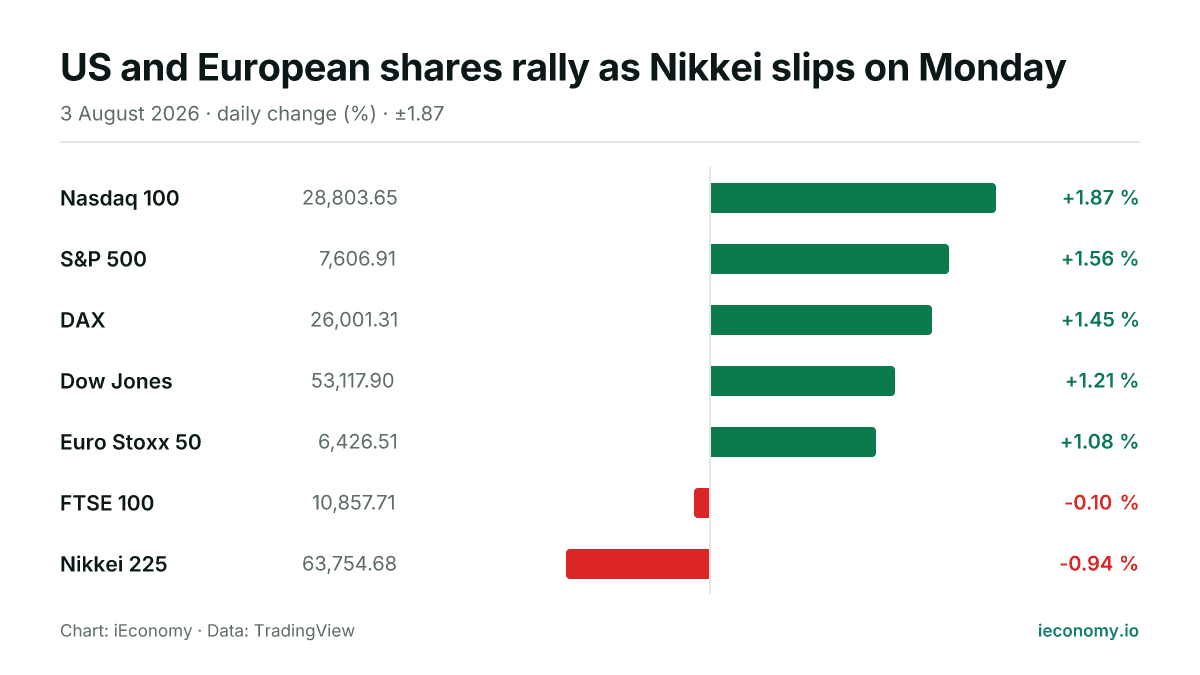
US and European shares rally as Nikkei slips on Monday
Equity markets were broadly firmer on Monday, led by the US and continental Europe. The FTSE 100 and Nikkei 225 were the only benchmarks in the red, showing a mixed cross-asset tone rather than a uniform risk move.
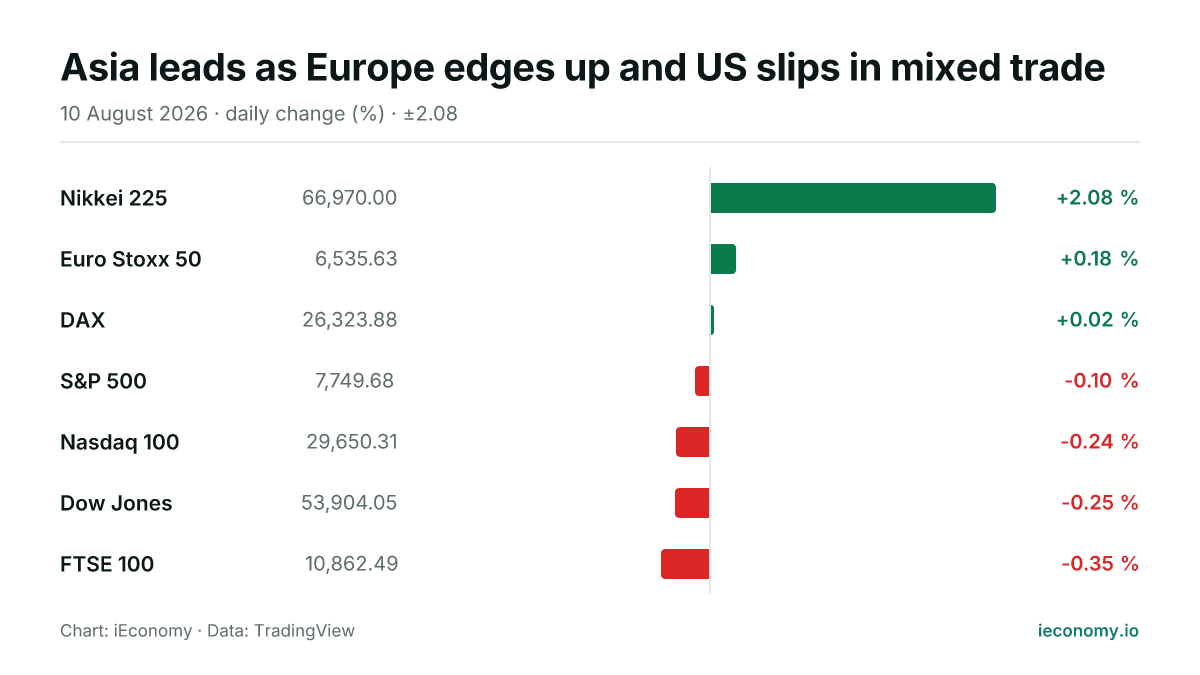
Asia leads as Europe edges up and US slips in mixed trade
Asian equities outperformed on Monday, led by a sharp rise in Tokyo, while Europe was broadly firmer and US benchmarks eased. The moves were modest in most cases, but they left the day’s tone mixed across regions.
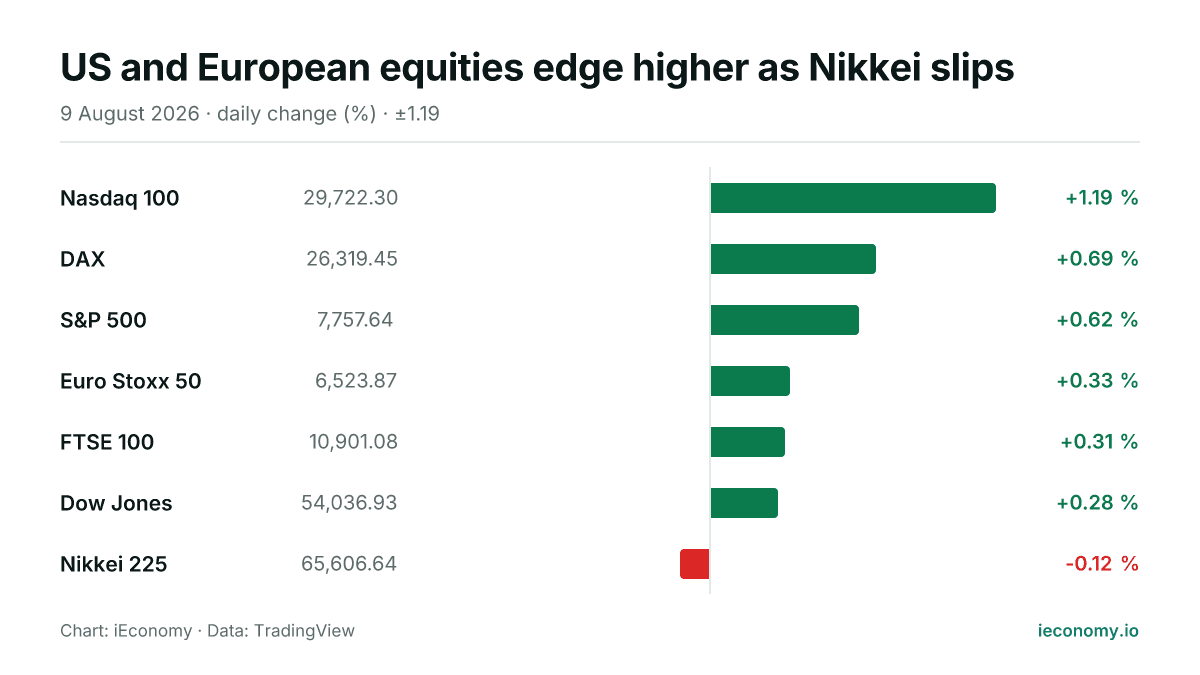
US and European equities edge higher as Nikkei slips
Most major equity benchmarks were firmer on Sunday, led by the Nasdaq 100 and followed by gains across Europe and the S&P 500. The Nikkei 225 was the only index in the red, leaving the session broadly positive but uneven across regions.