US stocks lead as Europe slips and Tokyo dips
US benchmarks were higher in Thursday trading, with the Nasdaq 100 leading gains. European indices were mixed to softer and the Nikkei 225 edged lower, leaving a split global session.
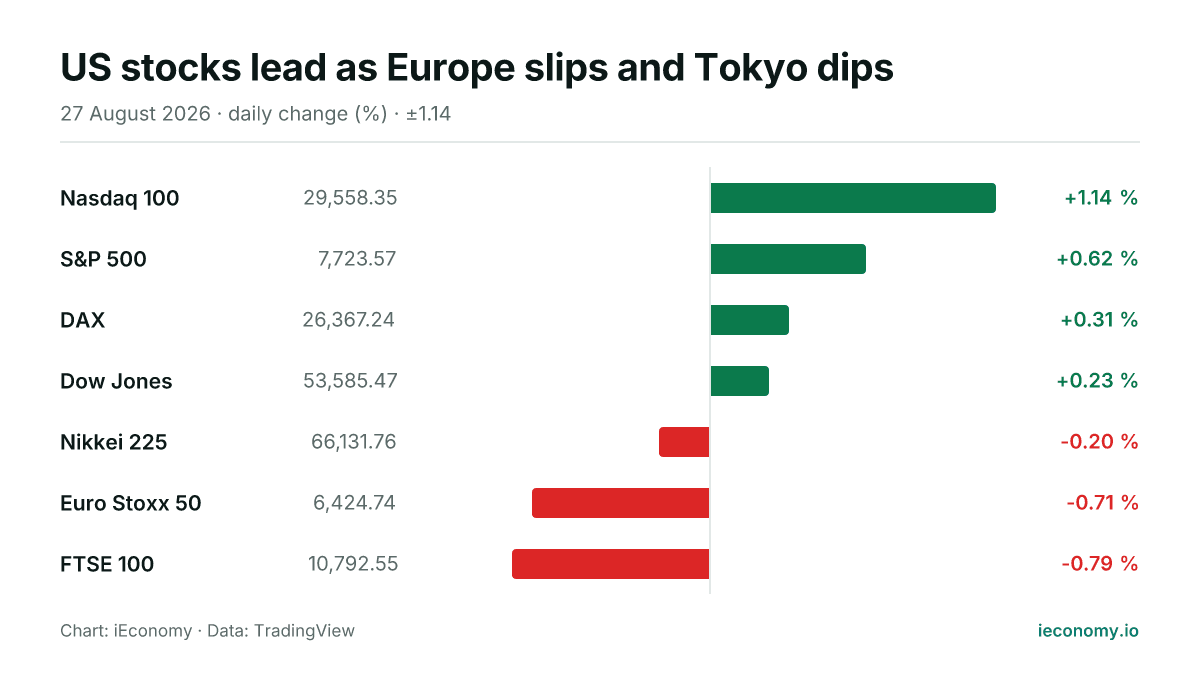
Chart: iEconomy · Data: TradingView
World equity markets were mixed on Thursday, with 4 of the 7 tracked indices higher and 3 lower or flat. The strongest advances came in the US, while Europe was softer overall and Japan’s Nikkei 225 edged down.
What moved and by how much
The Nasdaq 100 led the advance, rising 1.14%, while the S&P 500 added 0.62%. In Europe, the DAX gained 0.31% and the Dow Jones rose 0.23%, but the Euro Stoxx 50 fell 0.71% and the FTSE 100 lost 0.79%.
| Instrument | Last | Change |
|---|---|---|
| Nasdaq 100 | 29,558.35 | +1.14 % |
| S&P 500 | 7,723.57 | +0.62 % |
| DAX | 26,367.24 | +0.31 % |
| Dow Jones | 53,585.47 | +0.23 % |
| Nikkei 225 | 66,131.76 | -0.20 % |
| Euro Stoxx 50 | 6,424.74 | -0.71 % |
| FTSE 100 | 10,792.55 | -0.79 % |
The Nikkei 225 also moved lower, down 0.20%. The pattern points to a broad but uneven session, with US large-cap benchmarks firmer than their European and Asian counterparts at the time of writing.
The standouts at each end
At the top end, the Nasdaq 100 outperformed by a clear margin. That matters because a rise led by a technology-heavy index can pull the broader US complex higher even when other gauges are advancing more modestly.
At the weaker end, the FTSE 100 and Euro Stoxx 50 underperformed the rest of the tracked group. Small percentage moves still matter in index trading because they can reflect portfolio rebalancing, sector rotation and index-level risk appetite rather than a single stock story.
The DAX’s gain sat in the middle of the pack, while the Dow Jones also posted a smaller rise. That combination suggests the day’s leadership was concentrated rather than uniform across regions and styles.
What a long-term investor should take from one day
One session does not change a long-term thesis, but it does show where demand is concentrated right now. For diversified investors, the main lesson is that regional and index-specific performance can diverge sharply even within the same global trading day.
Daily moves are useful mainly as a measure of volatility and relative strength. They can also alter benchmark exposure through mechanical index effects, which matters for passive and rules-based strategies even when no broader narrative is available from the data alone.
Today’s split outcome is a reminder that equity markets often trade as a collection of separate indices rather than one single world market. That makes diversification important, but it also means short-term comparisons should be handled cautiously because leadership can change quickly.
This article is not investment advice and recommends no asset, level or direction; a single session's move is not evidence of a trend. For background see Markets, Bear Market, BIST 100, and for terms the finance glossary.
Frequently asked questions
Which index was the strongest on Thursday?
The Nasdaq 100 was the strongest of the seven tracked benchmarks, rising 1.14%. It outpaced the other US indices and the European and Asian gauges in the digest.
Which indices were the weakest?
The FTSE 100 fell the most, down 0.79%, followed by the Euro Stoxx 50, which lost 0.71%. The Nikkei 225 was also lower, but by a smaller 0.20%.
What should investors focus on after a day like this?
Investors should focus on relative performance and portfolio balance rather than reading too much into a single move. A daily dispersion like this mainly shows where index-level demand was strongest or weakest during the session.
Sources
Related News
S&P 500 edges lower as trading breadth stays narrow
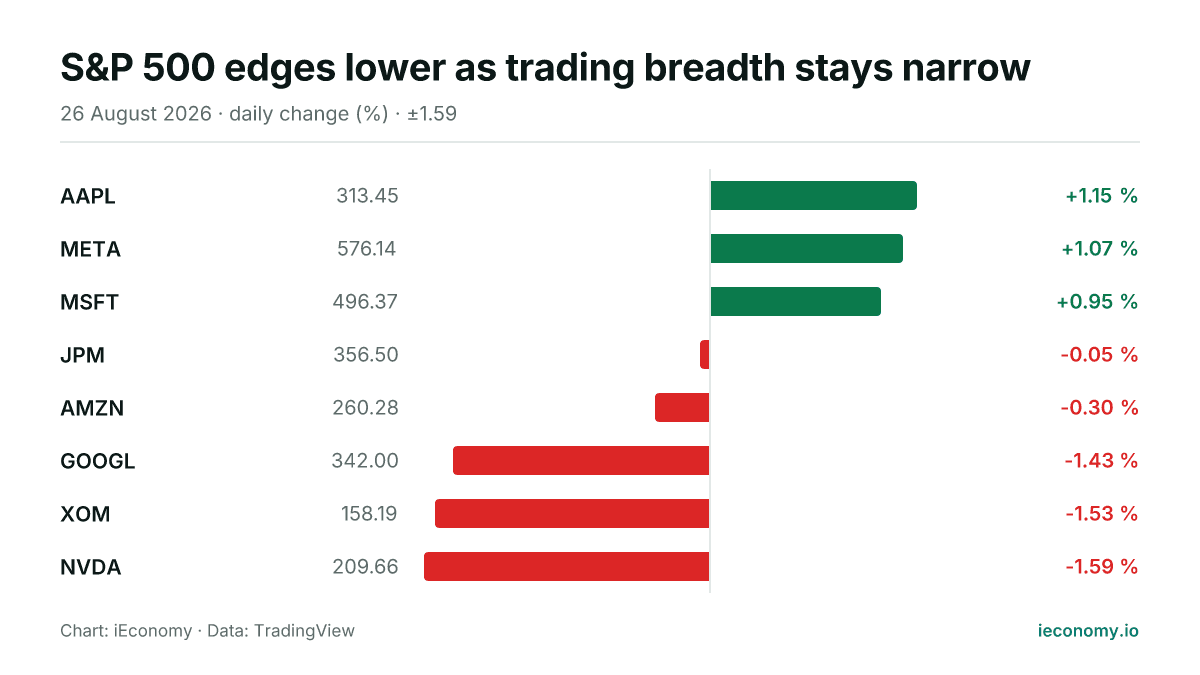
The S&P 500 ended Wednesday at 7,675.70, down 0.02% as five of the eight tracked constituents fell and three rose. Apple was the strongest performer, while Nvidia was the weakest.
World equities mixed as Asia and Europe outpace US
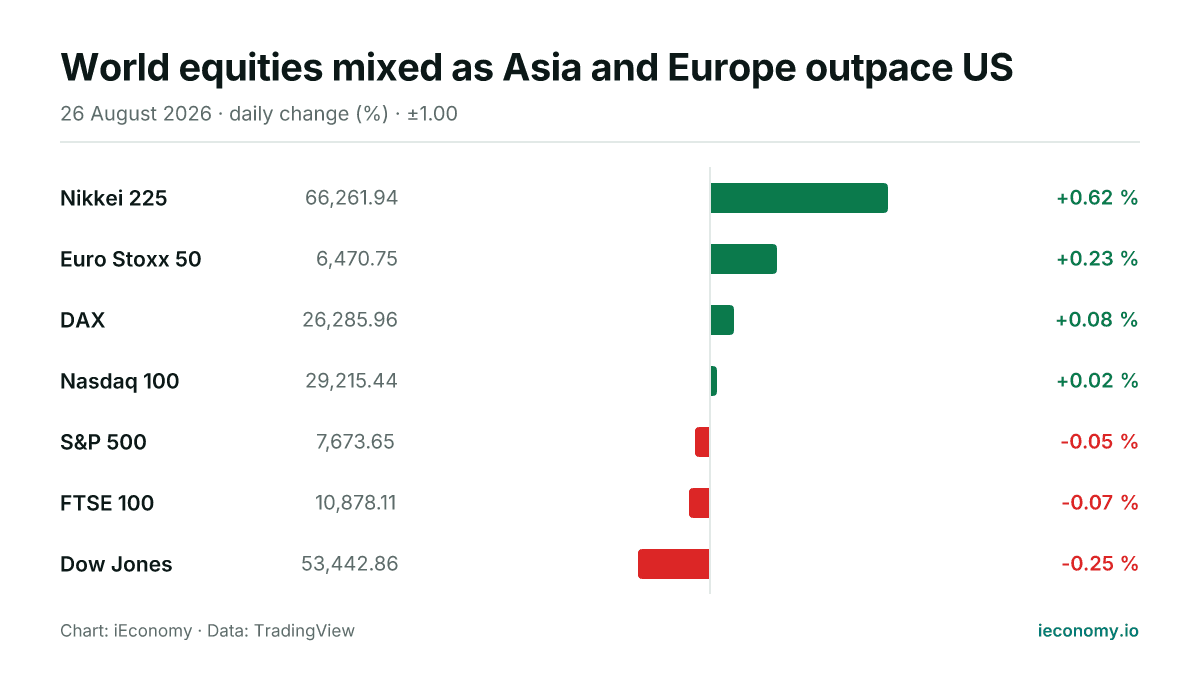
Asian and European benchmarks edged higher as US indices were mixed in early trading. The moves were modest overall, with the Nikkei 225 leading and the Dow Jones the weakest in the group.
S&P 500 edges higher as leadership stays narrow
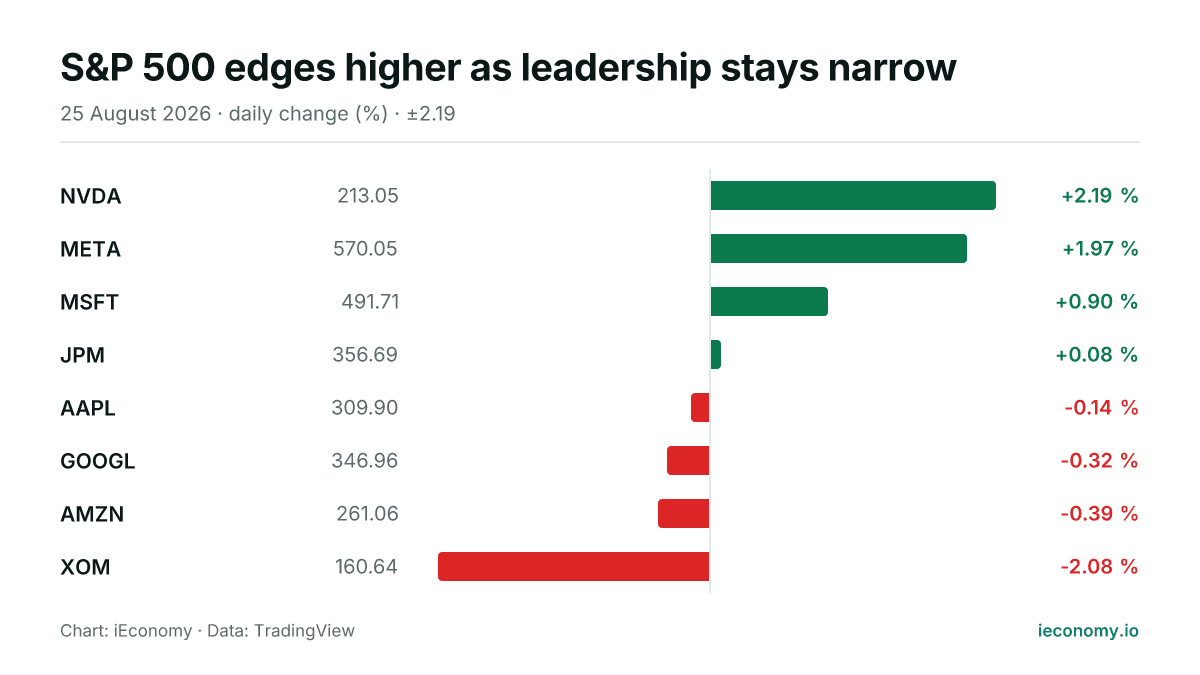
The S&P 500 finished Tuesday at 7,677.28, up 0.32%, with a split showing among the eight tracked constituents. NVDA led the gainers while XOM was the weakest name.
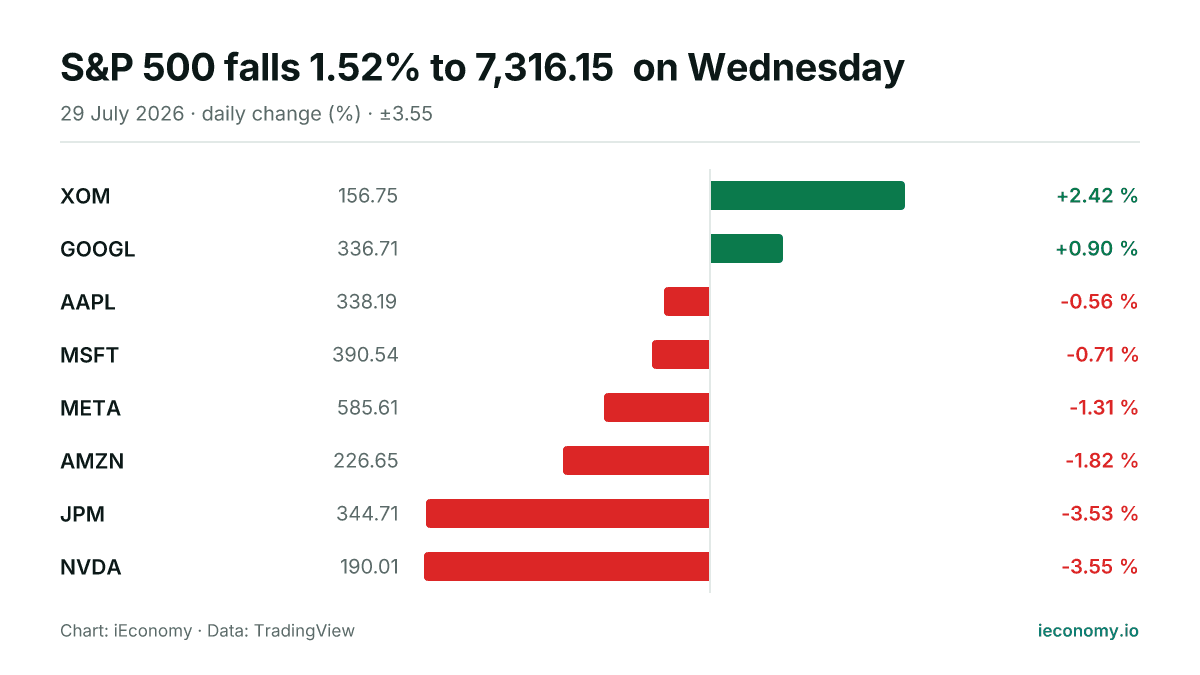
S&P 500 falls 1.52% to 7,316.15 on Wednesday
The S&P 500 ended Wednesday lower at 7,316.15, with six of eight tracked constituents declining. Energy outperformed while technology lagged, leaving the session narrowly negative in breadth but clearly weak in the headline index.
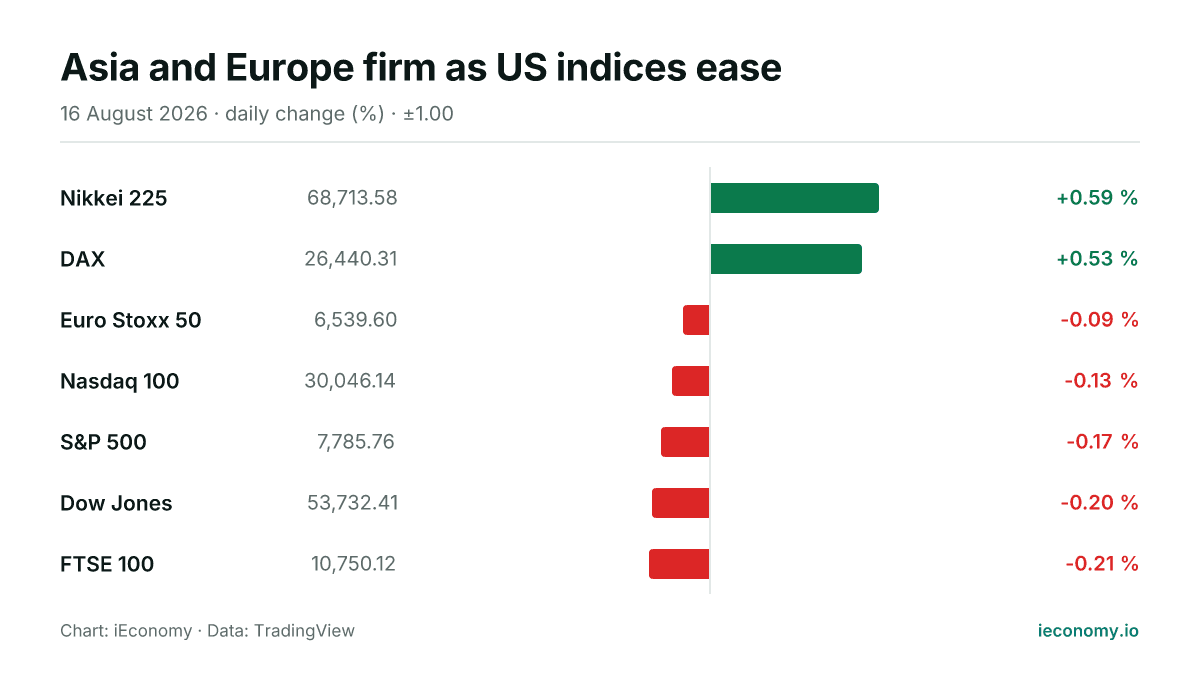
Asia and Europe firm as US indices ease
Japanese and German equities led a mixed global session, while US benchmarks slipped modestly. The day left seven tracked markets split between small gains and broad-but-shallow declines.
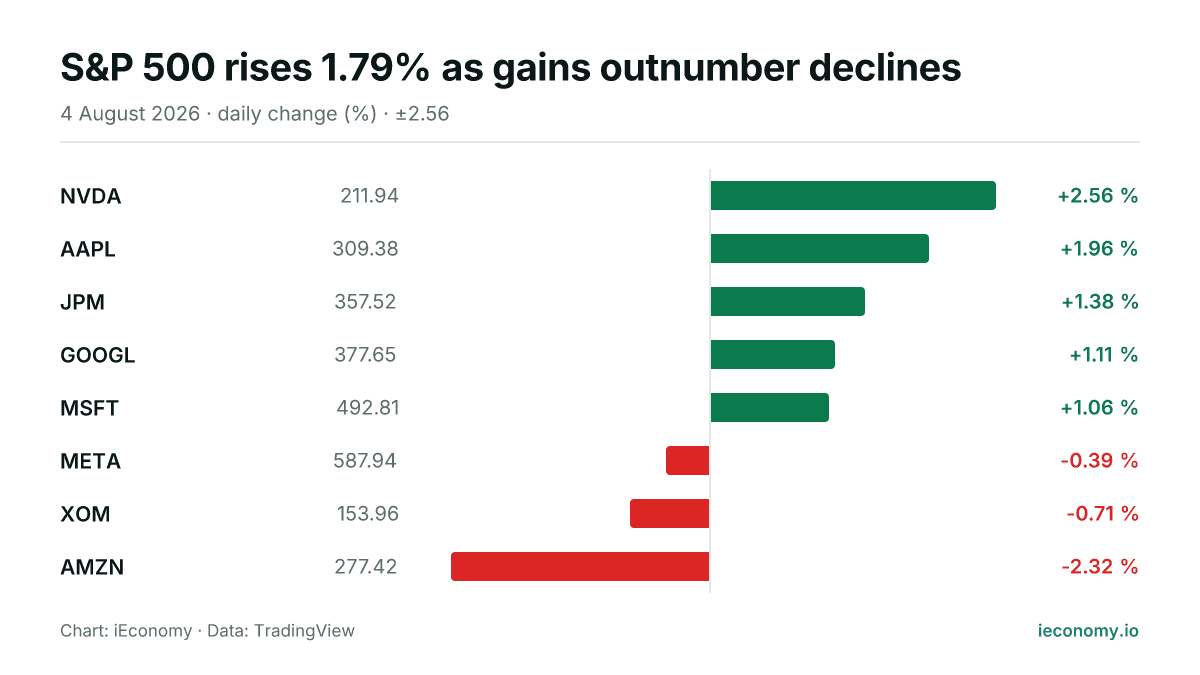
S&P 500 rises 1.79% as gains outnumber declines
The S&P 500 finished Tuesday at 7,736.52, up 1.79%, with five of the eight tracked constituents higher and three lower. NVDA led the day, while AMZN was the weakest performer.