World equities mixed as Tokyo leads; US lags
Asian and European indices were mostly firmer on Friday, while US benchmarks finished lower in the digest. The move was uneven, with the Nikkei 225 the clear standout and the Dow Jones and S&P 500 among the weaker gauges.
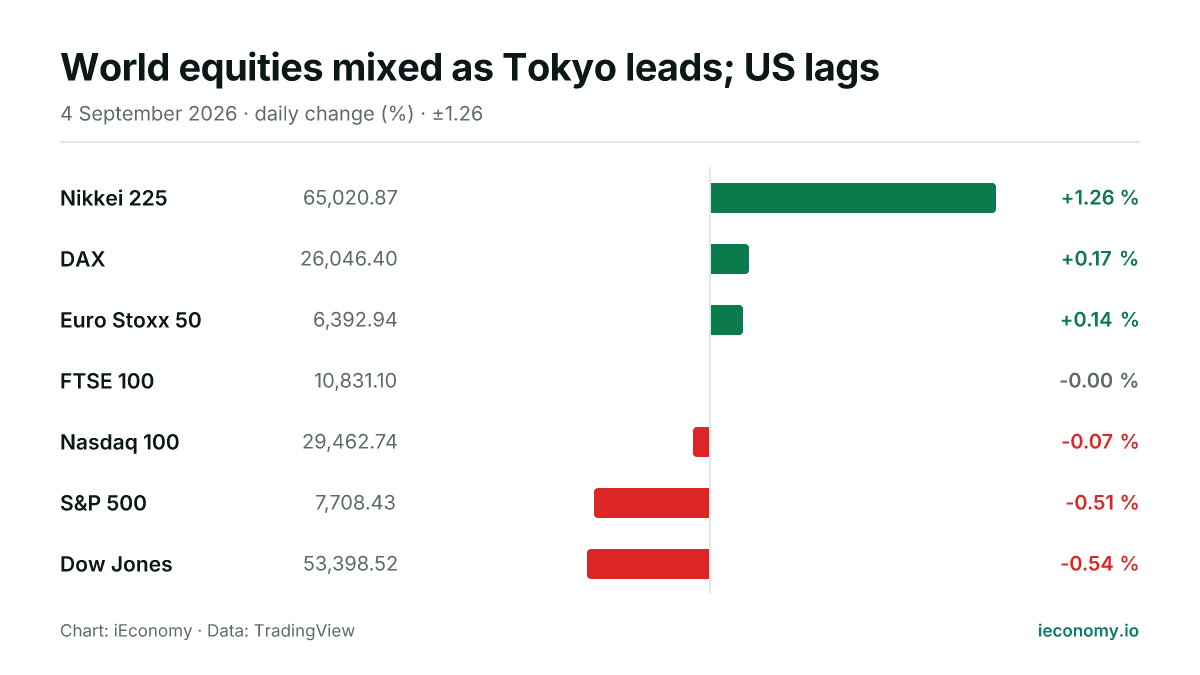
Chart: iEconomy · Data: TradingView
World equity markets were mixed on Friday, with most of the gain coming from Asia and a modestly positive tone in parts of Europe. US indices were weaker in the digest, leaving the cross-regional picture uneven rather than broadly risk-on or risk-off.
What moved and by how much
The Nikkei 225 led the day, up 1.26%, while the DAX rose 0.17% and the Euro Stoxx 50 added 0.14%. The FTSE 100 was effectively unchanged at -0.00%, showing how small moves can still matter when the broader regional tone is subdued.
| Instrument | Last | Change |
|---|---|---|
| Nikkei 225 | 65,020.87 | +1.26 % |
| DAX | 26,046.40 | +0.17 % |
| Euro Stoxx 50 | 6,392.94 | +0.14 % |
| FTSE 100 | 10,831.10 | -0.00 % |
| Nasdaq 100 | 29,462.74 | -0.07 % |
| S&P 500 | 7,708.43 | -0.51 % |
| Dow Jones | 53,398.52 | -0.54 % |
In the US, the Nasdaq 100 slipped 0.07%, while the S&P 500 fell 0.51% and the Dow Jones dropped 0.54%. That spread matters: a mild decline in a technology-heavy gauge alongside larger losses in the broader benchmarks points to weakness that was not confined to one narrow corner of the market.
The standouts at each end
On the upside, the Nikkei 225 was the clear outperformer and the only major index in the digest to post a gain above 1%. Among Europe’s large-cap benchmarks, the DAX and Euro Stoxx 50 both moved higher, but only by fractions of a percent, which is enough to register direction without signalling conviction.
At the weaker end, the Dow Jones and S&P 500 were the largest decliners in percentage terms. The Nasdaq 100 fell less than the two broader US measures, but its slight decline still matters because it confirms that the day’s softness was not limited to one style or sector bucket.
What a long-term investor should take from one day
One session mostly shows positioning, sentiment and the mechanics of index weighting rather than a durable trend. A single-day move in an index can reflect the combined effect of a few large constituents, so investors should be careful not to read too much into small changes without a longer run of data.
For a long-term holder, the key takeaway is dispersion: not all regions or benchmarks move together, even on the same day. That is normal in global markets and is precisely why short-term swings should be judged against broader time horizons, not as standalone signals.
This article is not investment advice and recommends no asset, level or direction; a single session's move is not evidence of a trend. For background see Markets, Bear Market, BIST 100, and for terms the finance glossary.
Frequently asked questions
Which index was the strongest on Friday?
The Nikkei 225 was the strongest in the digest, rising 1.26%. That made it the clear outlier versus the rest of the tracked equity benchmarks, which were mostly flat to lower.
Did European indices outperform US indices?
Yes. The DAX and Euro Stoxx 50 both edged higher, while the FTSE 100 was essentially flat. By contrast, the S&P 500, Dow Jones and Nasdaq 100 were all lower in the digest.
What should investors infer from a mixed day like this?
A mixed day mainly highlights cross-market dispersion and the importance of index composition. It does not, by itself, establish a trend or explain why prices moved, so the safer reading is that sentiment differed across regions and benchmarks on the day.
Sources
Related News
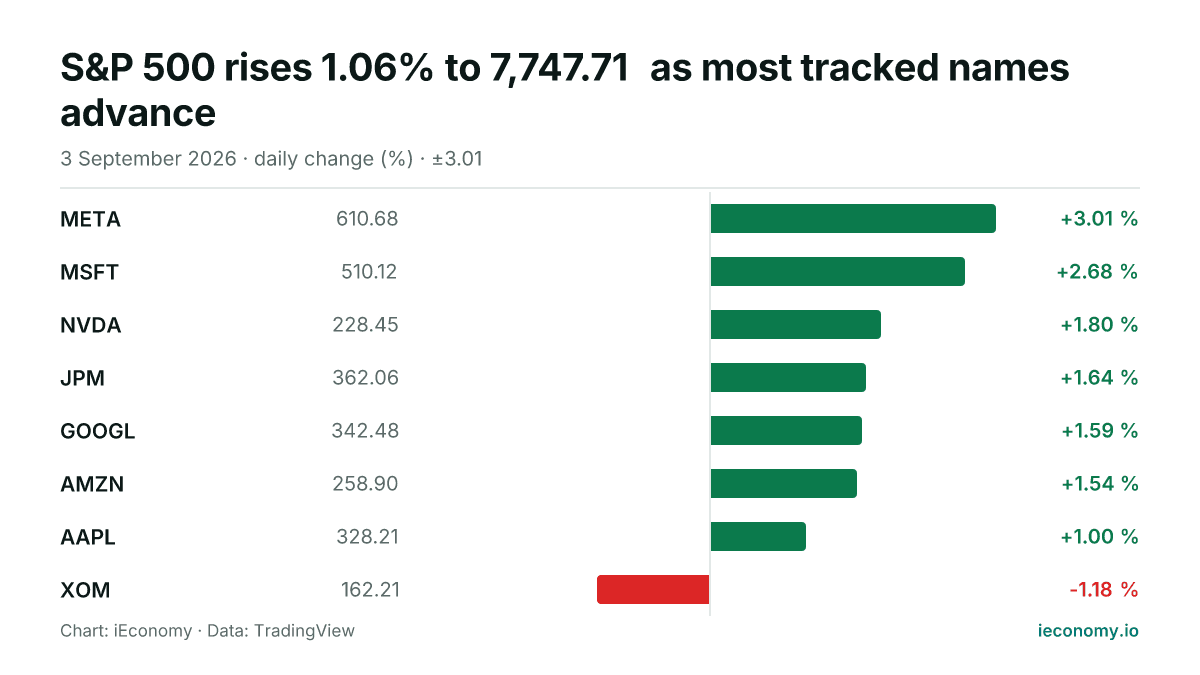
S&P 500 rises 1.06% to 7,747.71 as most tracked names advance
The S&P 500 finished Thursday higher, with 7 of 8 tracked constituents in positive territory. META was the strongest performer, while XOM was the only decliner among the names tracked in the digest.
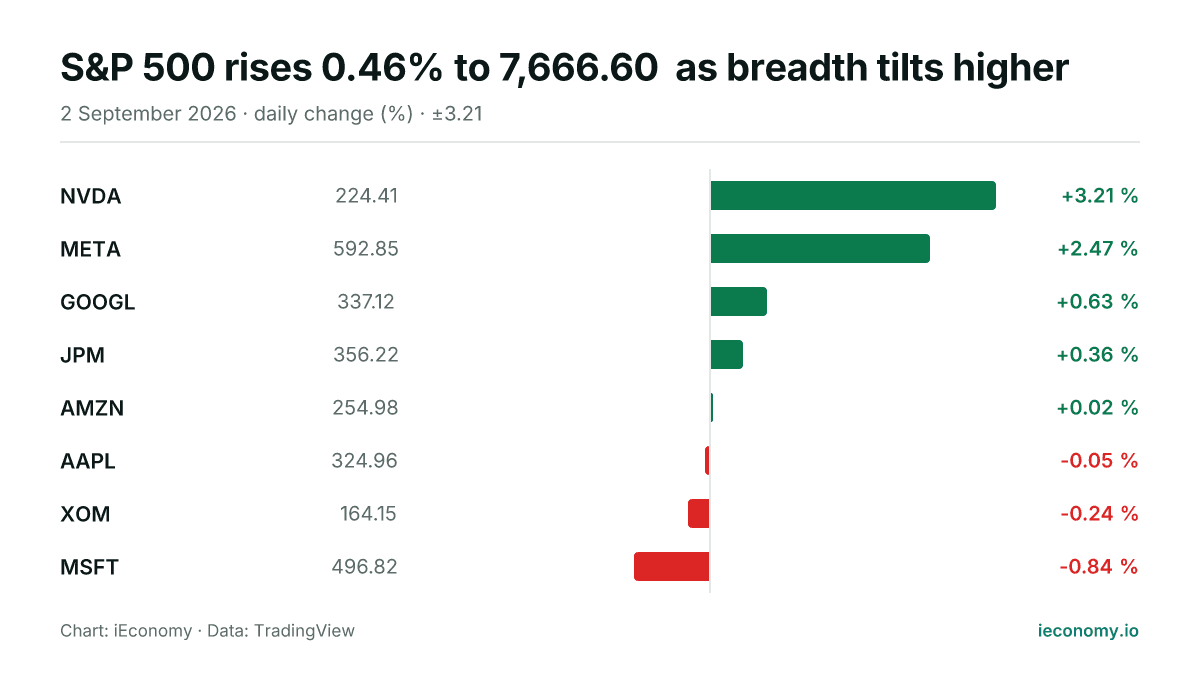
S&P 500 rises 0.46% to 7,666.60 as breadth tilts higher
The S&P 500 finished Wednesday at 7,666.60, up 0.46%, with five of eight tracked constituents advancing. NVIDIA was the strongest performer, while Microsoft lagged.
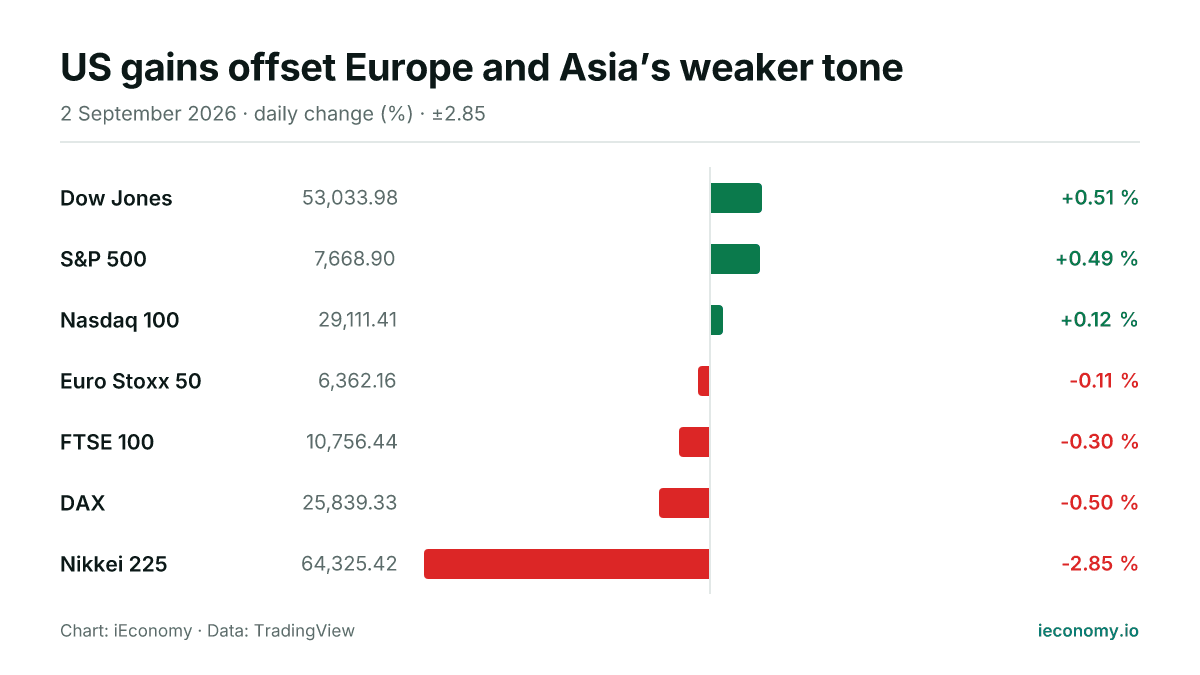
US gains offset Europe and Asia’s weaker tone
US equities advanced modestly while European benchmarks edged lower and Japan’s Nikkei 225 fell sharply. The day left three of seven tracked indices higher, with the strongest move still concentrated in Tokyo.
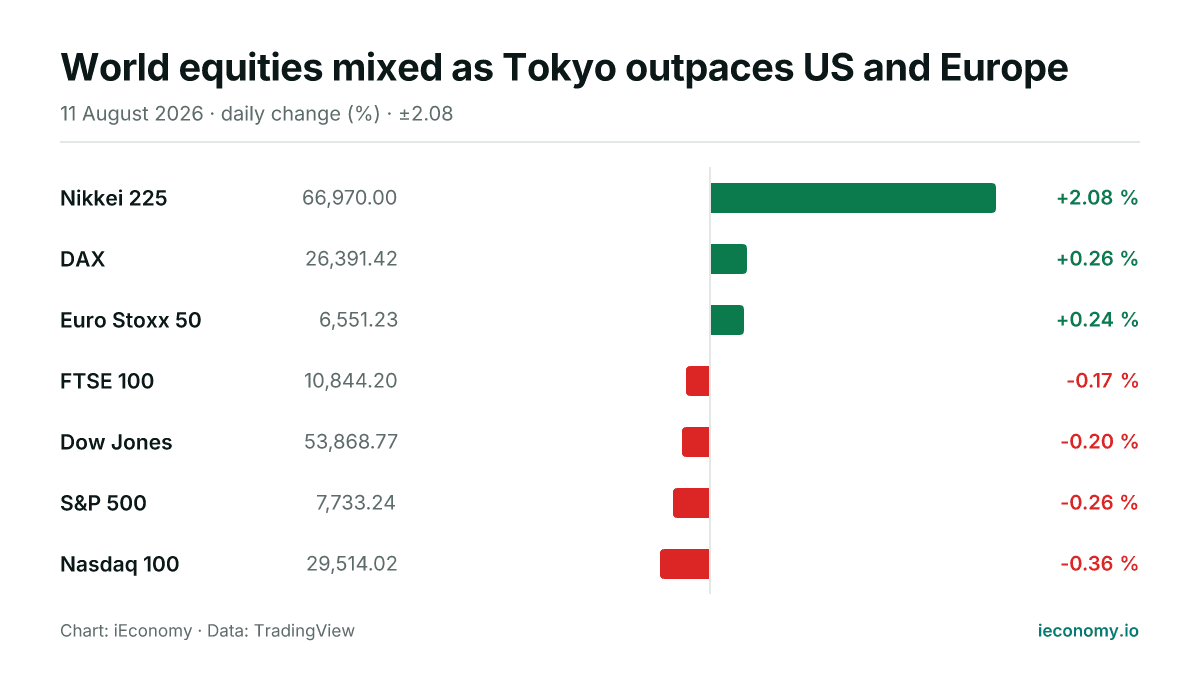
World equities mixed as Tokyo outpaces US and Europe
Asian shares led the move on Tuesday, with the Nikkei 225 rising 2.08%, while European benchmarks inched higher and US indices were softer. The split left 3 of 7 tracked gauges up and 4 lower or flat.
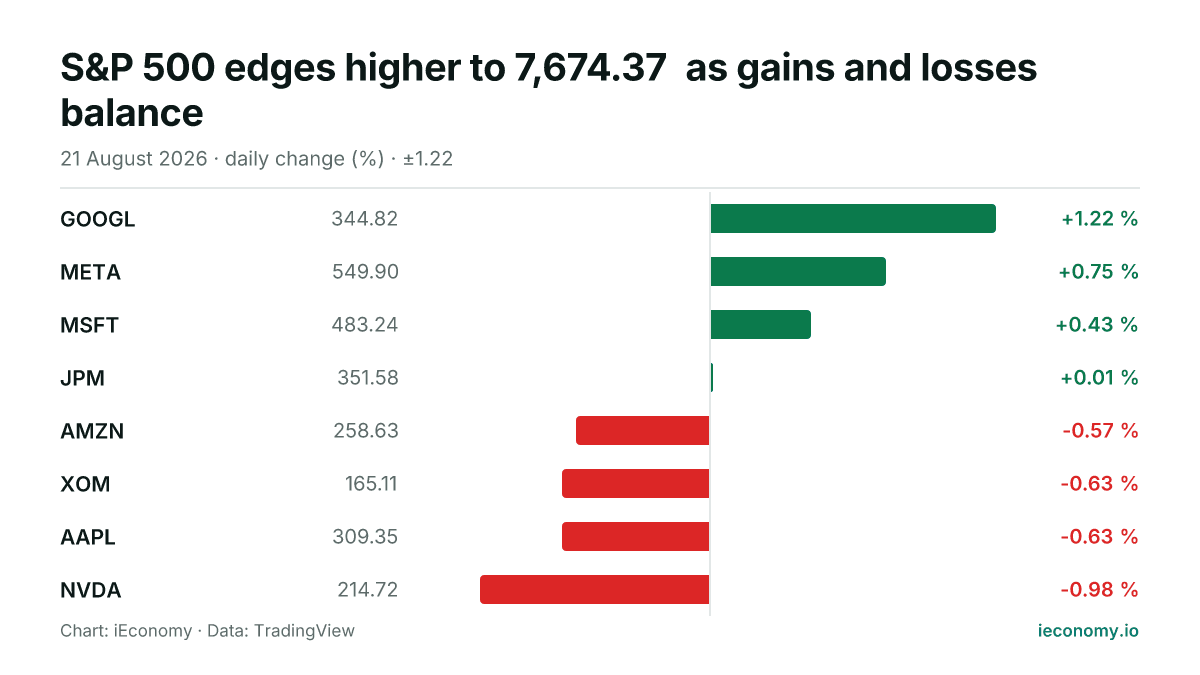
S&P 500 edges higher to 7,674.37 as gains and losses balance
The S&P 500 rose 0.43% to 7,674.37 on Friday. Among the eight tracked constituents, four finished higher and four lower, with GOOGL the strongest and NVDA the weakest.
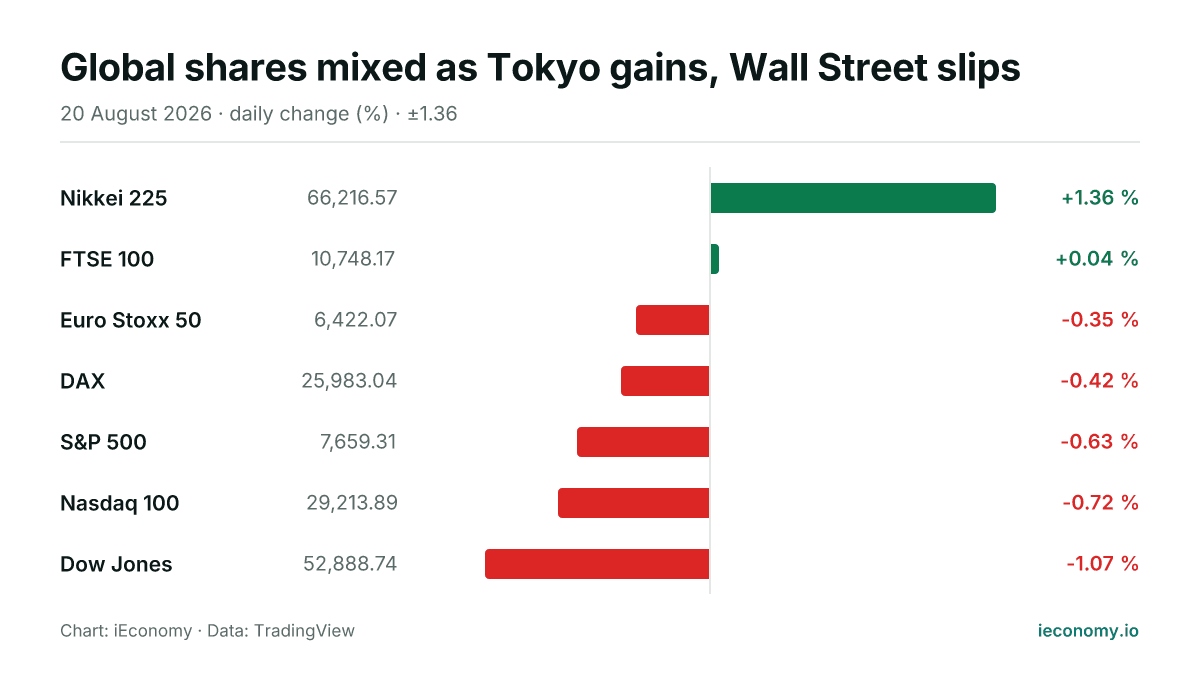
Global shares mixed as Tokyo gains, Wall Street slips
Asian equities were firmer and Europe was little changed to lower, while US indices traded lower. The day’s pattern showed rotation rather than a broad-risk selloff, with only two of seven benchmarks advancing.