S&P 500 rises 1.06% to 7,747.71 as most tracked names advance
The S&P 500 finished Thursday higher, with 7 of 8 tracked constituents in positive territory. META was the strongest performer, while XOM was the only decliner among the names tracked in the digest.
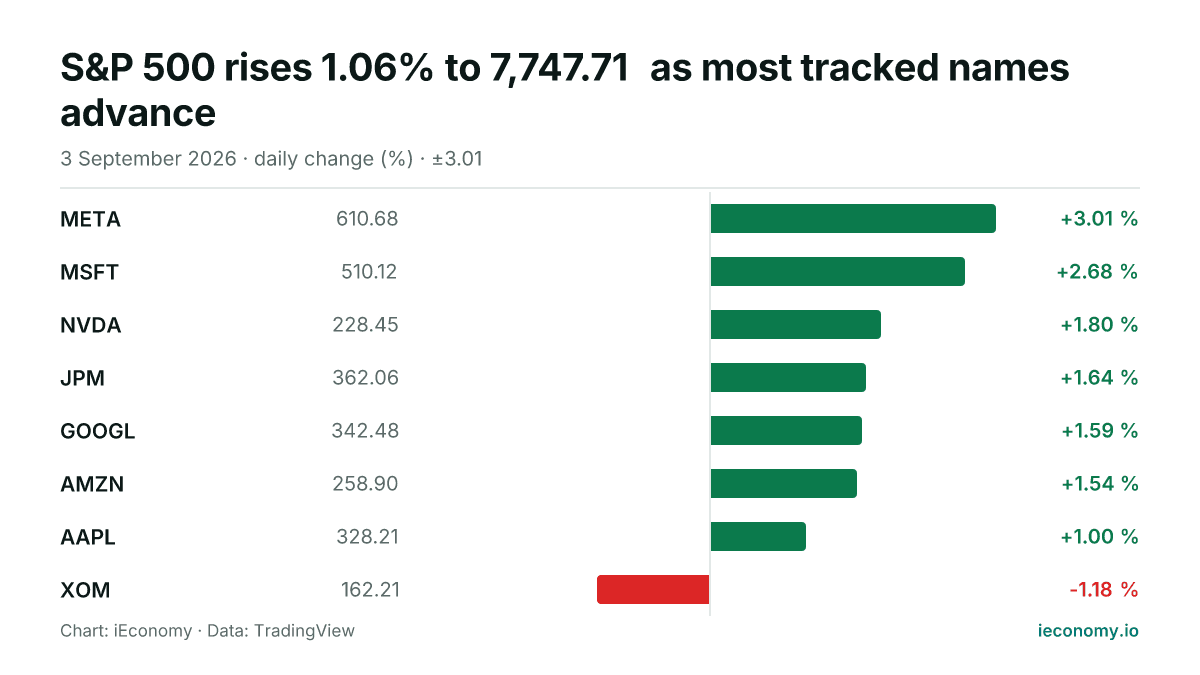
Chart: iEconomy · Data: TradingView
The S&P 500 ended Thursday at 7,747.71, up 1.06% on the session. Among the eight constituents tracked in the digest, seven closed higher and one fell, pointing to a broadly positive but not unanimous advance.
Index level and breadth
The day’s move added to the index level rather than merely trimming an earlier loss, with the benchmark closing firmly in positive territory. Breadth was supportive, as the advance was led by a clear majority of the tracked names.
| Stock | Last | Change |
|---|---|---|
| META | 610.68 | +3.01 % |
| MSFT | 510.12 | +2.68 % |
| NVDA | 228.45 | +1.80 % |
| JPM | 362.06 | +1.64 % |
| GOOGL | 342.48 | +1.59 % |
| AMZN | 258.90 | +1.54 % |
| AAPL | 328.21 | +1.00 % |
| XOM | 162.21 | -1.18 % |
That said, breadth was measured rather than universal. With one of the eight tracked constituents finishing lower, the session still showed some dispersion beneath the headline gain.
Standout performers
META was the best performer among the names tracked, rising 3.01% to 610.68. In a session like this, an outsized gain in one large constituent can meaningfully shape sentiment even when the broader move is already positive.
XOM was the weakest performer, falling 1.18% to 162.21. A single lower name does not define the tape, but it does show that the day’s advance was not completely uniform across sectors or styles.
What a long-term investor should take from it
For a long-term investor, the main lesson from one session is mechanical: index performance reflects both the size of the move and how widely gains are shared. A broad day with limited downside can improve the tone of the market even without changing the longer-term picture.
Single-day moves are useful for reading short-term participation, but they do not by themselves establish a durable trend. The prudent takeaway is simply that risk remains present, and that even strong index gains can coexist with stock-specific weakness.
Sources
Related News
S&P 500 slips 0.33% as most tracked names fall
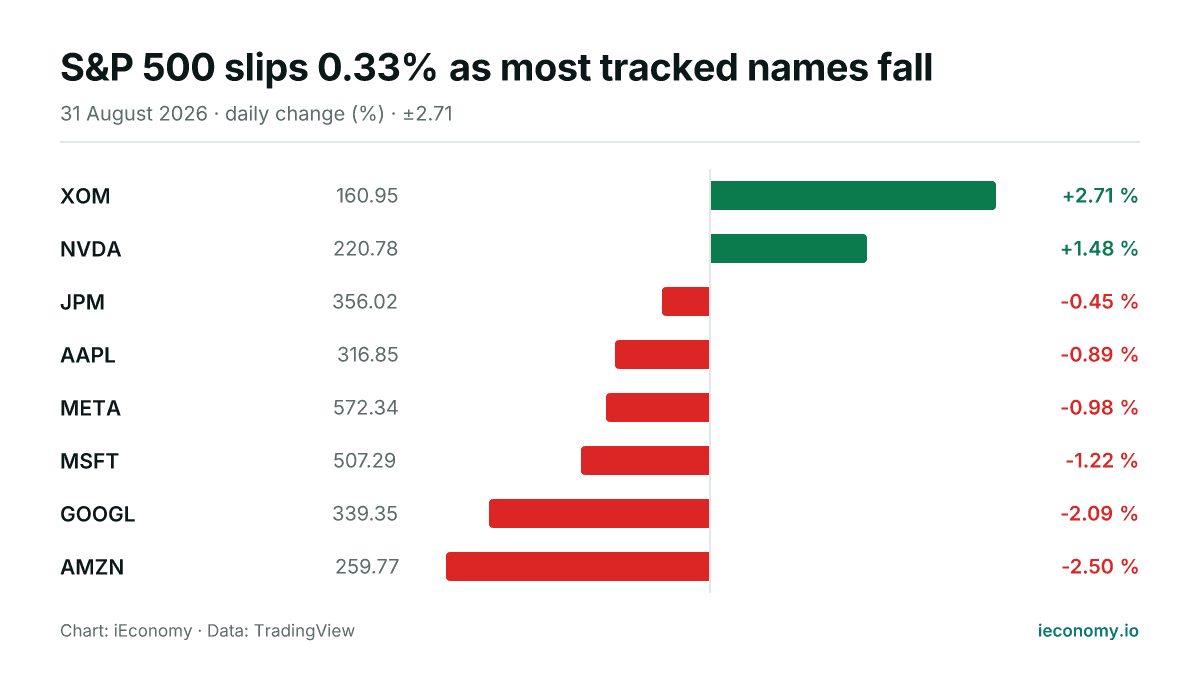
The S&P 500 ended Monday at 7,686.14, down 0.33% on the session. In the small set of tracked constituents, six fell and two rose, with Exxon Mobil the strongest and Amazon the weakest.
S&P 500 rises 0.72% to 7,730.99 as Nvidia leads
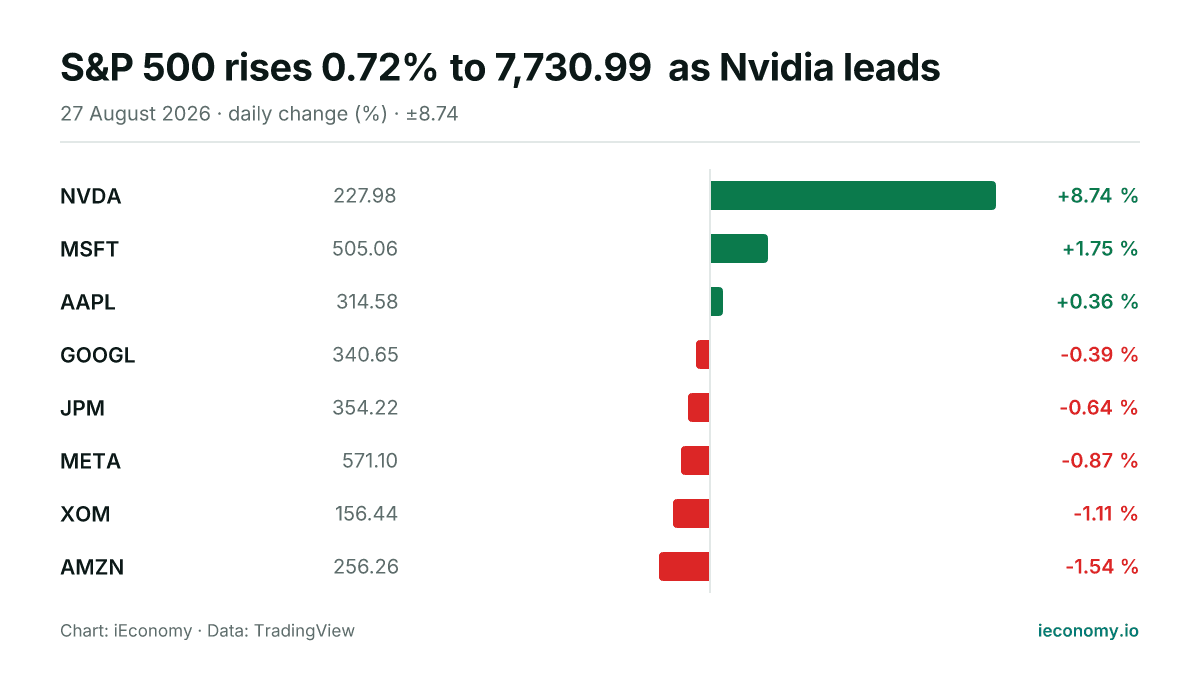
The S&P 500 advanced on Thursday, with a narrow majority of tracked constituents higher. Nvidia was the strongest performer, while Amazon lagged the group.
S&P 500 rises 0.46% to 7,666.60 as breadth tilts higher
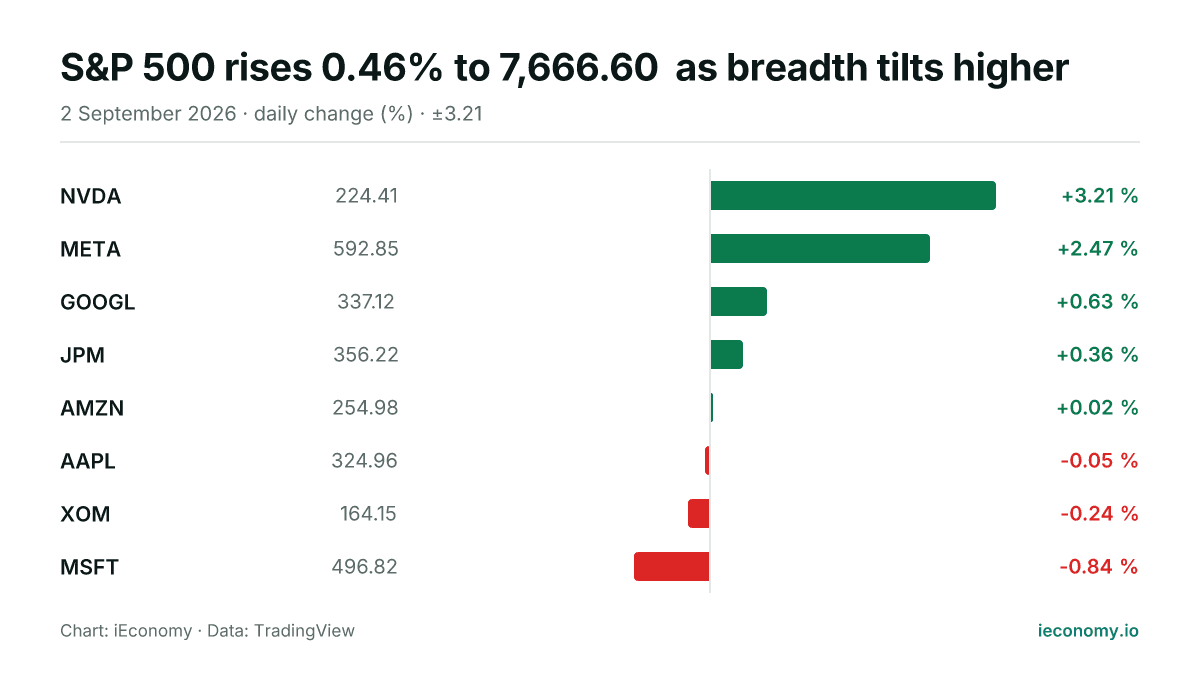
The S&P 500 finished Wednesday at 7,666.60, up 0.46%, with five of eight tracked constituents advancing. NVIDIA was the strongest performer, while Microsoft lagged.
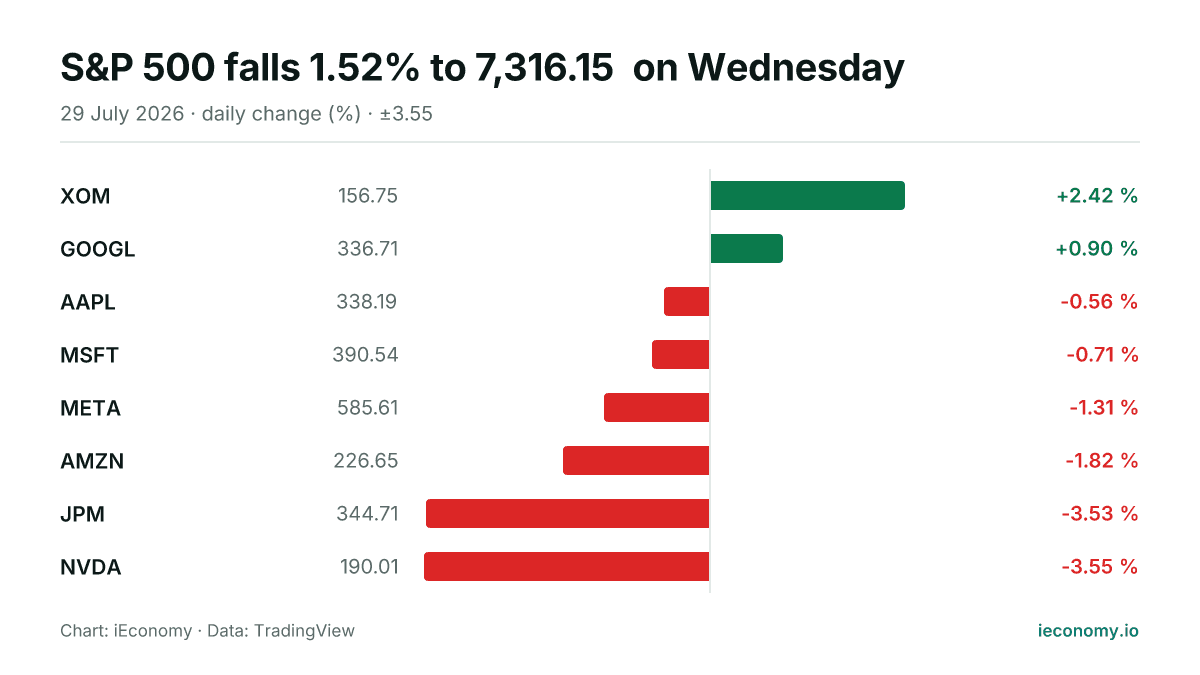
S&P 500 falls 1.52% to 7,316.15 on Wednesday
The S&P 500 ended Wednesday lower at 7,316.15, with six of eight tracked constituents declining. Energy outperformed while technology lagged, leaving the session narrowly negative in breadth but clearly weak in the headline index.
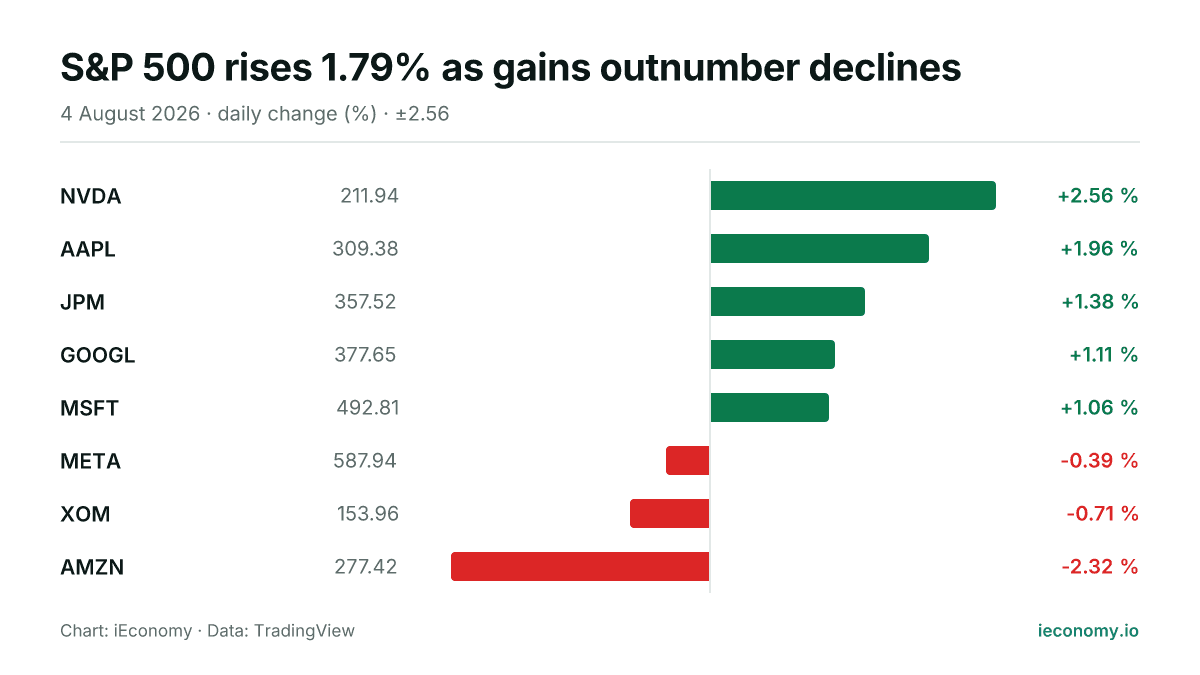
S&P 500 rises 1.79% as gains outnumber declines
The S&P 500 finished Tuesday at 7,736.52, up 1.79%, with five of the eight tracked constituents higher and three lower. NVDA led the day, while AMZN was the weakest performer.
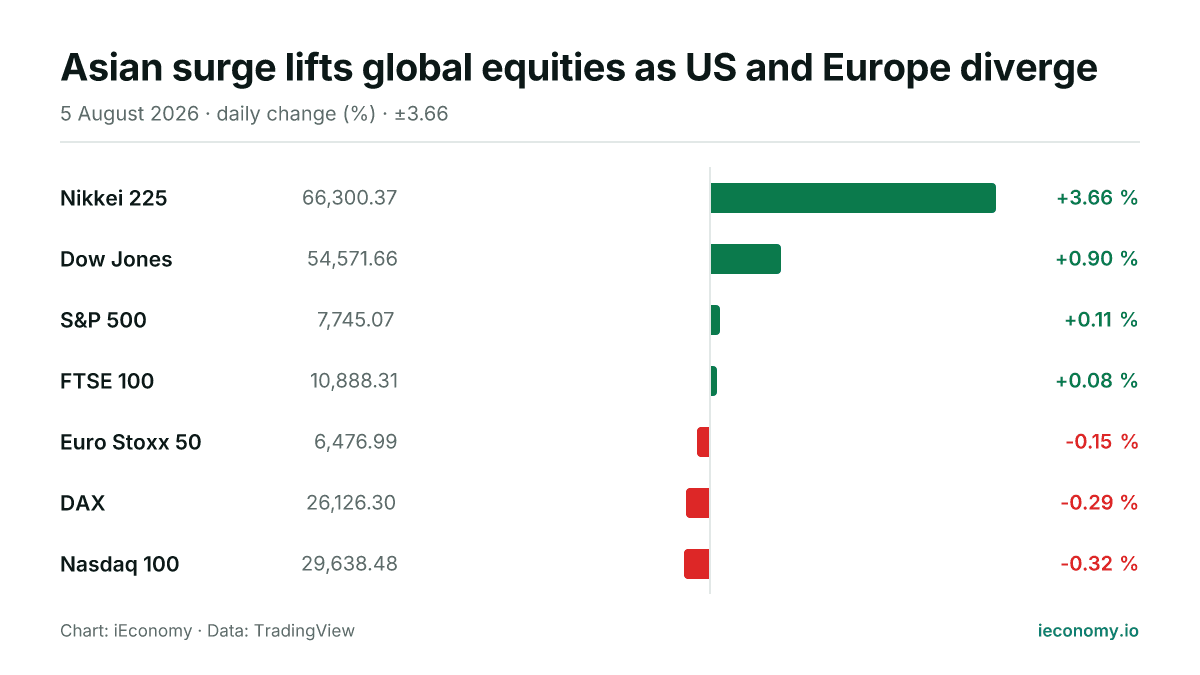
Asian surge lifts global equities as US and Europe diverge
World equity markets were mixed on Wednesday, with Japan leading gains and US benchmarks edging mostly higher while parts of Europe and the Nasdaq 100 slipped. The day left four of seven tracked indices in positive territory, but the moves were uneven across regions and styles.