US gains offset Europe and Asia’s weaker tone
US equities advanced modestly while European benchmarks edged lower and Japan’s Nikkei 225 fell sharply. The day left three of seven tracked indices higher, with the strongest move still concentrated in Tokyo.
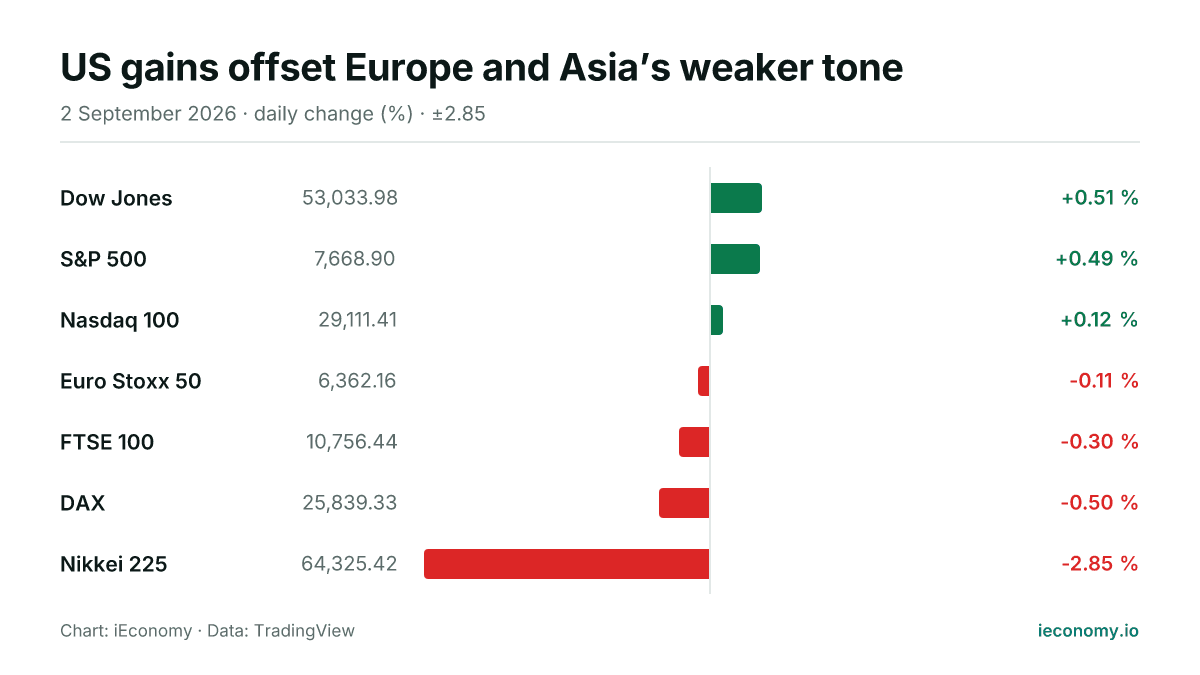
Chart: iEconomy · Data: TradingView
World equity markets were mixed on Wednesday, with a firmer tone in the US offset by weaker trading in Europe and a pronounced decline in Japan. Of the seven indices tracked, three were higher and four were lower or flat, leaving a split picture rather than a broad risk-on move.
What moved and by how much
In the US, the Dow Jones rose 0.51%, the S&P 500 gained 0.49% and the Nasdaq 100 added 0.12%. That kept the American benchmarks on the positive side, though the technology-heavy Nasdaq’s smaller rise pointed to a more restrained session than the broader market.
| Instrument | Last | Change |
|---|---|---|
| Dow Jones | 53,033.98 | +0.51 % |
| S&P 500 | 7,668.90 | +0.49 % |
| Nasdaq 100 | 29,111.41 | +0.12 % |
| Euro Stoxx 50 | 6,362.16 | -0.11 % |
| FTSE 100 | 10,756.44 | -0.30 % |
| DAX | 25,839.33 | -0.50 % |
| Nikkei 225 | 64,325.42 | -2.85 % |
Europe was slightly softer. The Euro Stoxx 50 slipped 0.11%, the FTSE 100 fell 0.30% and the DAX lost 0.50%. The moves were modest compared with Japan, but they still left the region uniformly weaker at the time of writing.
Asia saw the clearest move, with the Nikkei 225 down 2.85%. That made Tokyo the day’s main outlier among the tracked indices and the largest absolute pressure point in the dataset.
The standouts at each end
The best-performing major benchmark in percentage terms was the Dow Jones, which advanced 0.51%. The S&P 500 was close behind, while the Nasdaq 100 lagged those gains, showing that the day’s US strength was broader than just the technology complex.
At the other end, the Nikkei 225 was by far the weakest index, falling 2.85%. Among the European gauges, the DAX had the largest decline, while the FTSE 100 and Euro Stoxx 50 both moved lower by smaller margins.
The pattern matters because single-day equity moves often reflect positioning, regional sector mix and risk appetite more than a single universal signal. When the US rises while Europe and Asia soften, it can simply show that local trading was driven by different sector weights and time-zone-specific flows.
What a long-term investor should take from one day
For a long-term investor, the main lesson is that a single session rarely changes the bigger picture on its own. Even a sharp move like the Nikkei’s does not by itself define a trend; it is one data point in a longer sequence of trading.
What matters mechanically is how broad the move is across regions and styles. Here, the day’s advance was concentrated in the US, while Europe was slightly negative and Japan materially weaker, which argues for caution about reading too much into one market or one session.
Short-term volatility can matter for entry points and portfolio drift, but it should be weighed against diversification and horizon. This snapshot shows uneven cross-market performance, which is normal in global equities and a reminder that correlation is not fixed from one day to the next.
This article is not investment advice and recommends no asset, level or direction; a single session's move is not evidence of a trend. For background see Markets, Bear Market, BIST 100, and for terms the finance glossary.
Frequently asked questions
Which region was strongest on the day?
Which index moved the most? The Nikkei 225 moved the most and was also the weakest, falling 2.85%. Among the US and European benchmarks, the biggest moves were much smaller, which shows how concentrated the day’s volatility was in Tokyo.
Which index moved the most?
What does a mixed global session usually mean? A mixed session usually means regional factors, sector composition and market timing are pulling in different directions. It does not automatically signal a lasting shift; it often just reflects how capital was positioned during the trading window.
Sources
Related News
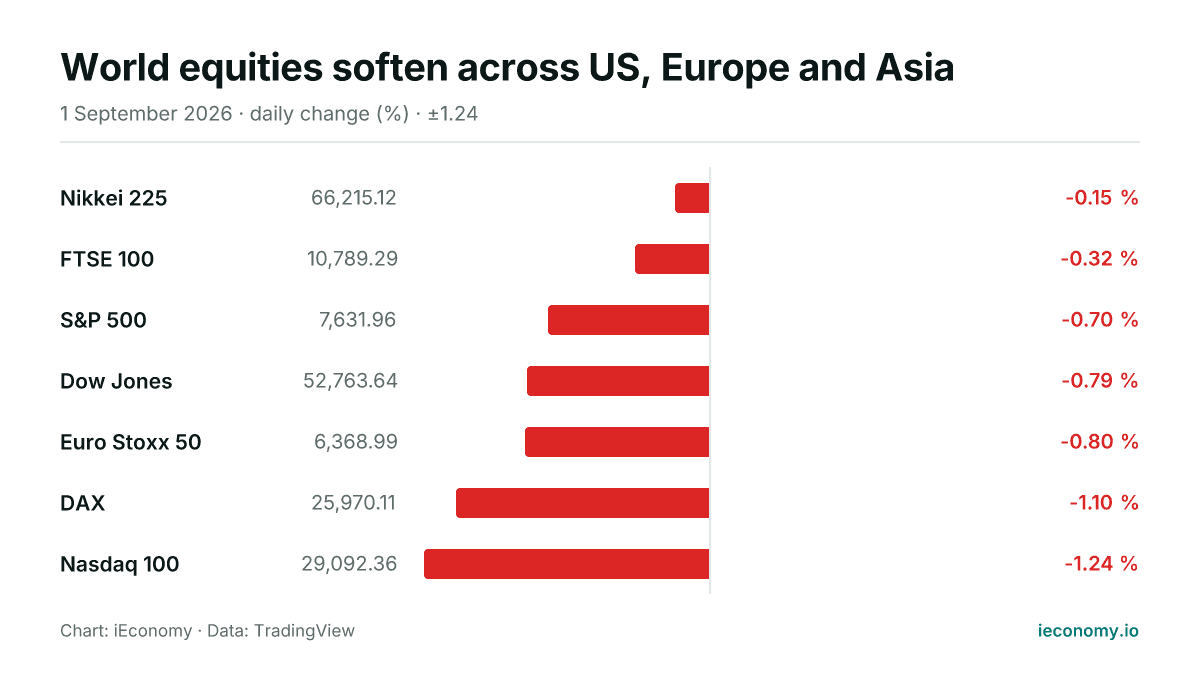
World equities soften across US, Europe and Asia
All seven tracked equity benchmarks were lower or flat on Tuesday, with US growth shares lagging and Europe also under pressure. The move was broad rather than concentrated, leaving no market in positive territory.
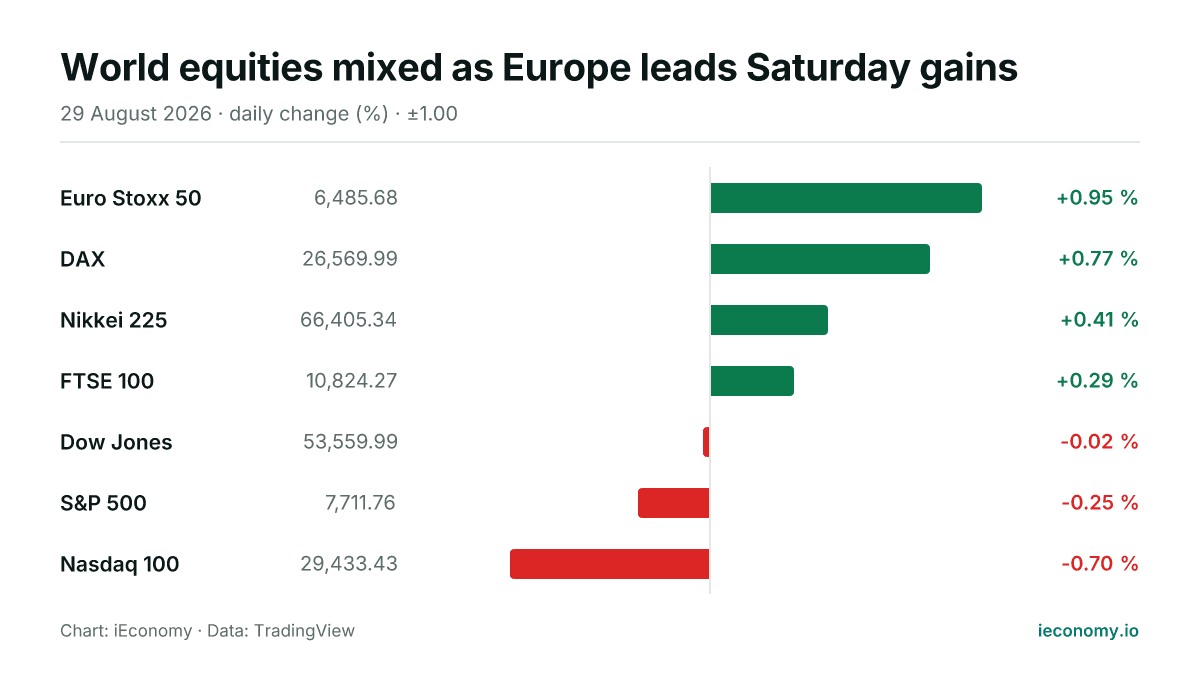
World equities mixed as Europe leads Saturday gains
European benchmarks outperformed on Saturday, with the Euro Stoxx 50 and DAX posting the strongest advances. US indices were softer, while Asian equities were also firmer, led by the Nikkei 225.
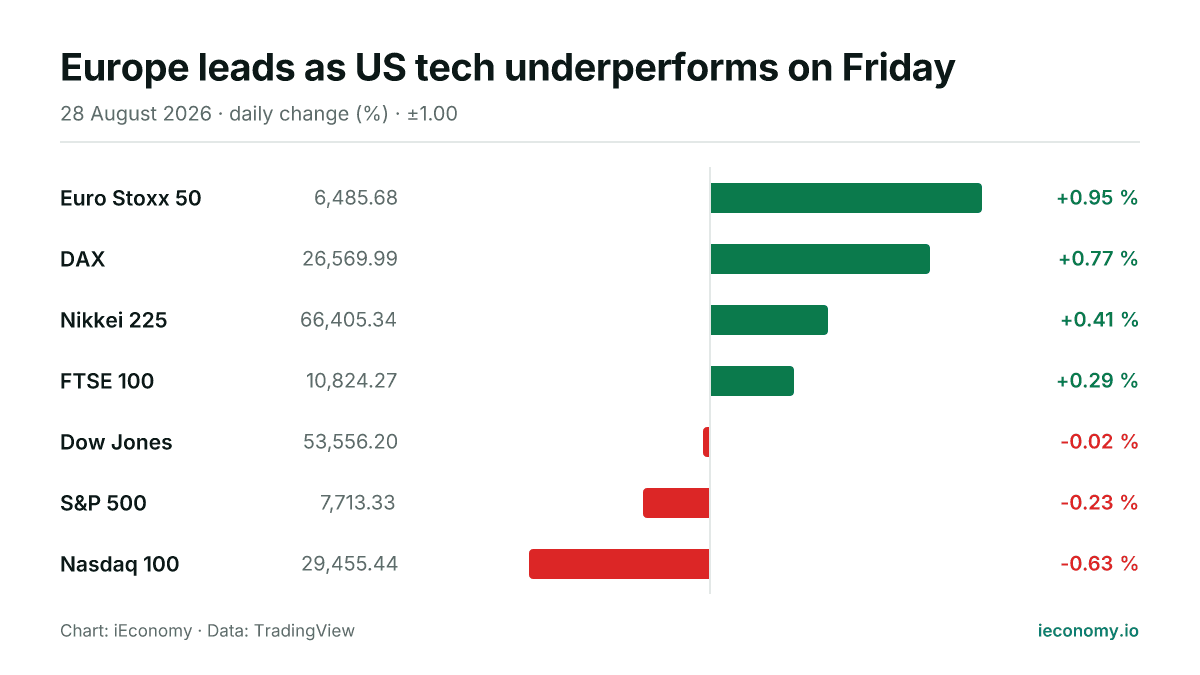
Europe leads as US tech underperforms on Friday
European and Asian benchmarks advanced on Friday, while the main US averages were mixed to weaker. The day’s moves were modest in the US and broader in Europe, leaving regional performance uneven.
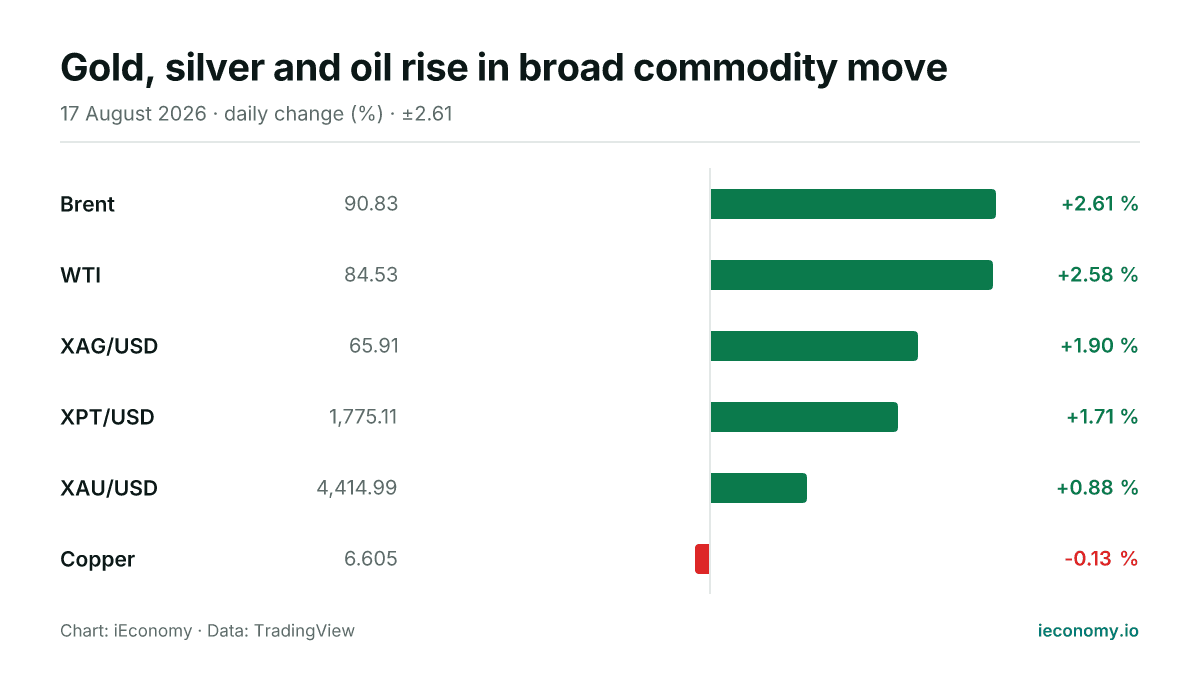
Gold, silver and oil rise in broad commodity move
Most tracked commodities were higher on Monday, led by Brent and WTI, while copper was the lone decliner. Gold and silver also advanced, keeping the precious-metals complex firm on the day.

Commercial Metals falls below 200-day average
Commercial Metals Co. shares slipped below their 200-day moving average on Wednesday, with the stock trading as low as $66.13 and down about 5% on the session.
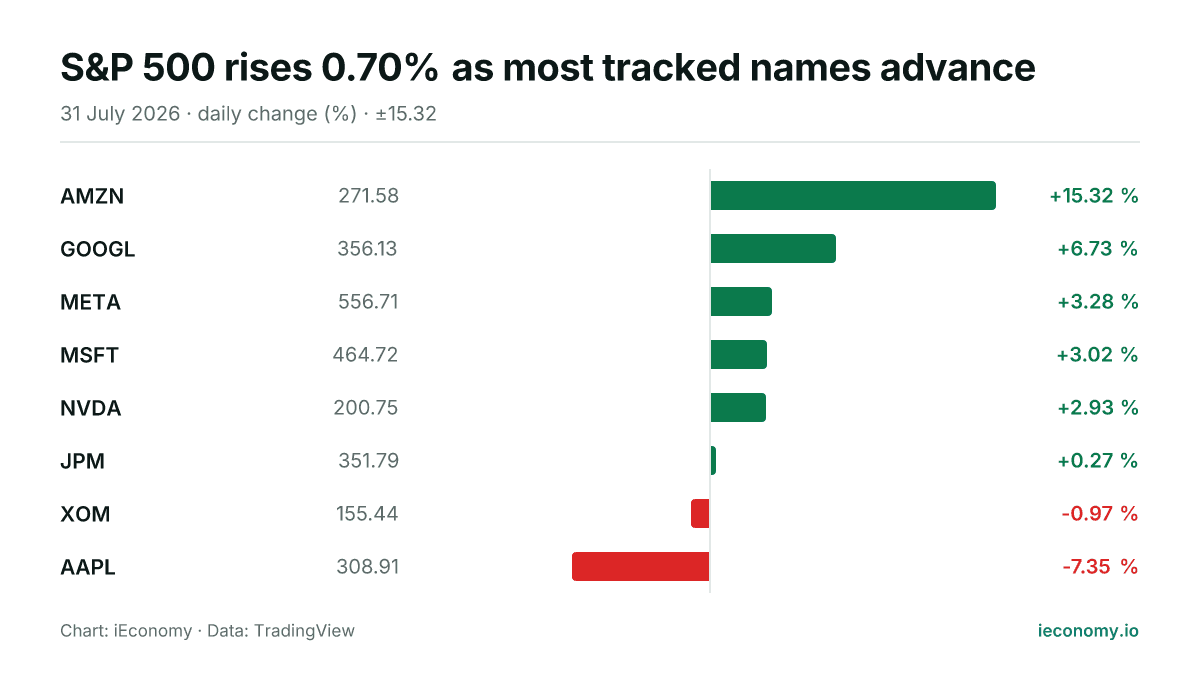
S&P 500 rises 0.70% as most tracked names advance
The S&P 500 finished Friday at 7,489.72, up 0.70% on the day. Among the eight tracked constituents, six rose and two fell, with AMZN the strongest and AAPL the weakest.