Gold and silver fall as oil trade splits
Gold and silver were weaker on Sunday, while Brent and copper held gains and WTI slipped. The day left the complex mixed, with moves driven by relative positioning rather than any disclosed catalyst.
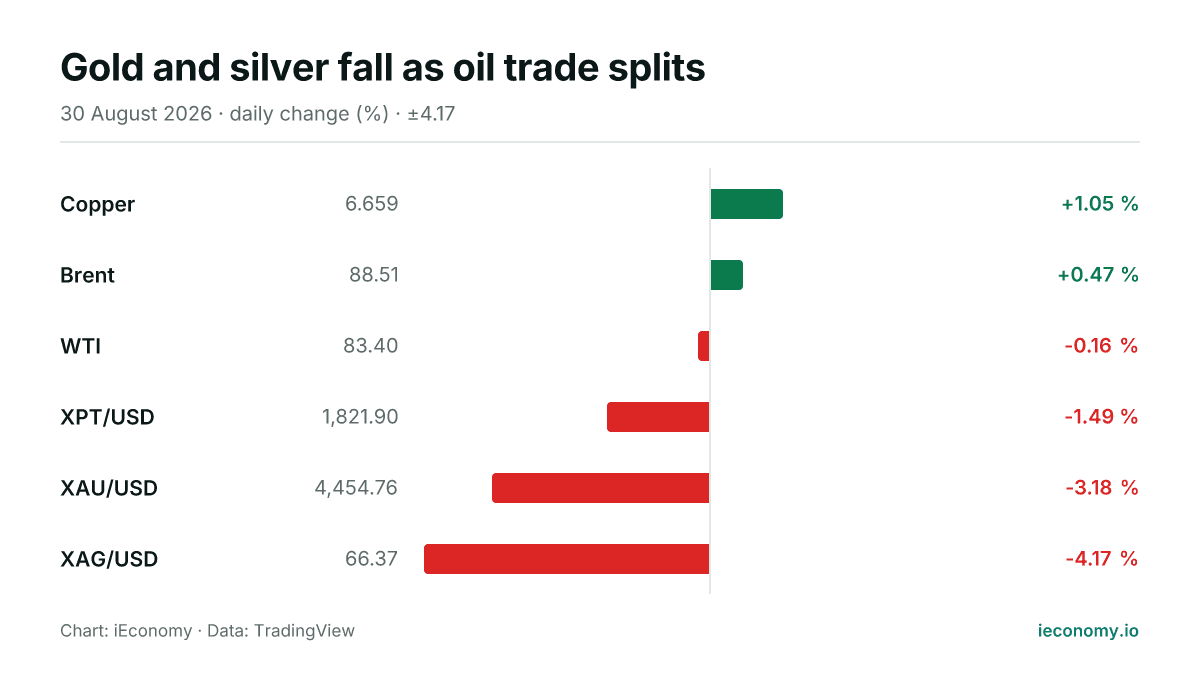
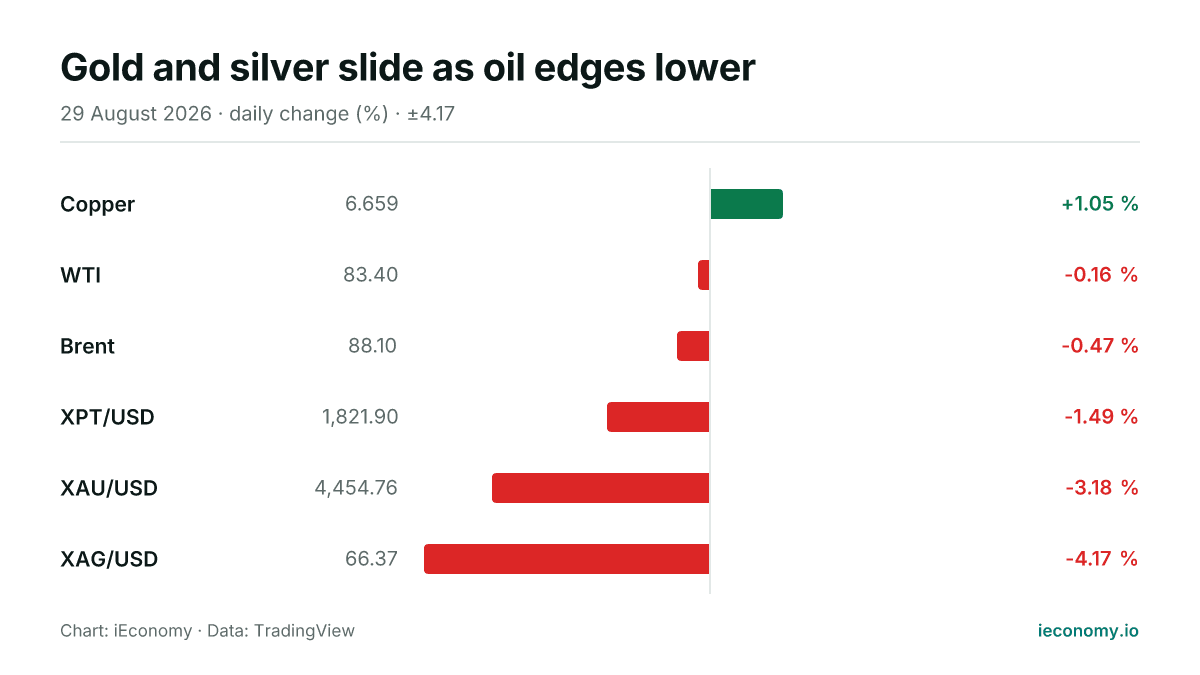
Chart: iEconomy · Data: TradingView
Commodities traded mixed on Sunday, with the precious-metals leg notably weaker while crude oil diverged and copper extended a modest gain. The digest showed two higher instruments and four lower or flat, leaving no broad-based direction across the complex.
What moved and by how much
Brent rose 0.47% and copper added 1.05%, while WTI eased 0.16%. In precious metals, XAU/USD fell 3.18%, XAG/USD lost 4.17%, and XPT/USD declined 1.49%.
| Instrument | Last | Change |
|---|---|---|
| Copper | 6.659 | +1.05 % |
| Brent | 88.51 | +0.47 % |
| WTI | 83.40 | -0.16 % |
| XPT/USD | 1,821.90 | -1.49 % |
| XAU/USD | 4,454.76 | -3.18 % |
| XAG/USD | 66.37 | -4.17 % |
The spread matters because commodity prices do not move as one asset class. Each contract reflects its own balance of positioning, liquidity and hedging flows, so a gain in Brent can coexist with losses in WTI and the metals complex.
The standouts at each end
XAG/USD was the weakest of the tracked markets, marking the largest percentage fall in the digest. XAU/USD was the other major laggard, and together the two metals accounted for the sharpest move lower in the session.
On the positive side, copper posted the strongest rise in percentage terms, ahead of Brent. That left the day’s leadership with industrial and energy benchmarks, even as the precious-metals complex absorbed the broadest selling pressure.
What a long-term investor should take from a single day
One session can show whether a market is being repriced faster than its peers, but it does not establish a trend on its own. For long-term holders, the key point is that cross-commodity relationships can shift even when the underlying macro backdrop is unchanged in the text available here.
Mechanically, daily moves also reflect trading conditions: futures and spot benchmarks can react differently, and percentage swings are amplified in markets with different starting prices and sensitivities. A single day therefore offers a snapshot of relative pressure, not a conclusion about direction.
This article is not investment advice and recommends no asset, level or direction; a single session's move is not evidence of a trend. For background see Markets, Bear Market, BIST 100, and for terms the finance glossary.
Frequently asked questions
Which market was the weakest?
XAG/USD was the weakest instrument in the digest, falling 4.17% on the day. XAU/USD also dropped sharply, underscoring that the precious-metals complex was under the most pressure.
Did crude oil move in the same direction?
No. Brent was higher while WTI was slightly lower, so the crude benchmarks did not move together. That kind of split can happen when contracts reflect different delivery points, trading flows or relative positioning.
What is the main takeaway from Sunday’s moves?
The main takeaway is that the complex was mixed rather than uniform. A single day can highlight relative strength and weakness, but it should be read as a snapshot of trading rather than a forecast.
Sources
Related News
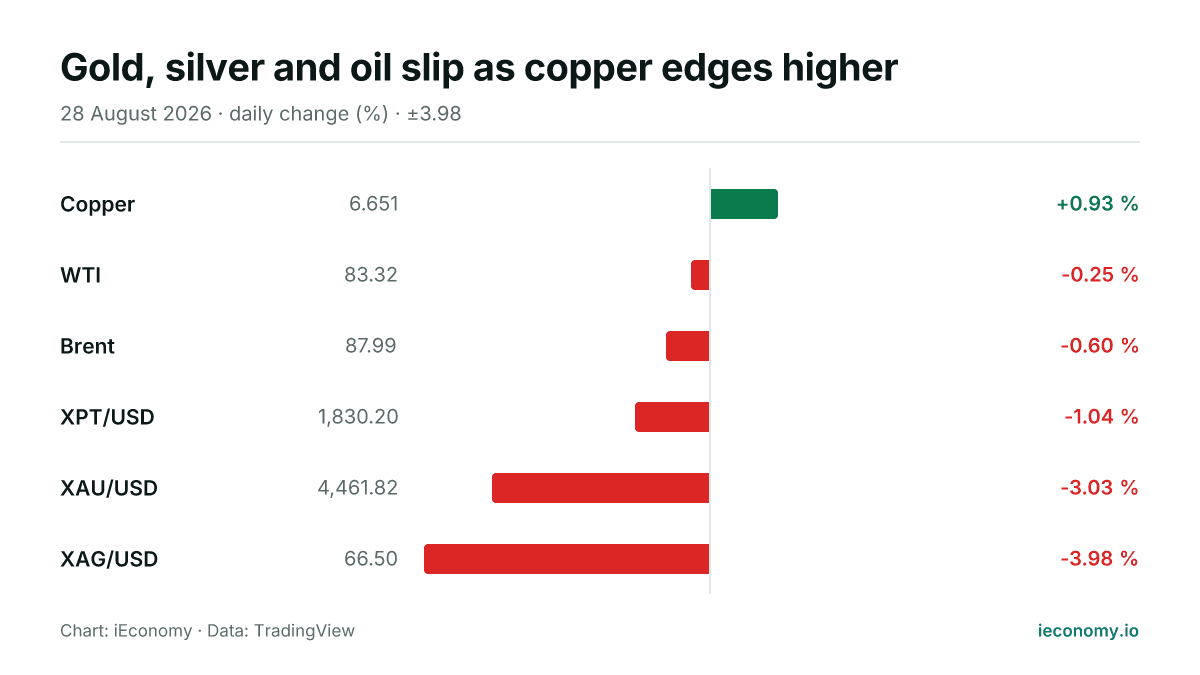
Gold, silver and oil slip as copper edges higher
On Friday, gold and silver led losses in the tracked commodity set while crude oil also eased and copper was the only gainer. The move left five of six instruments lower or flat, with the heaviest declines in precious metals.
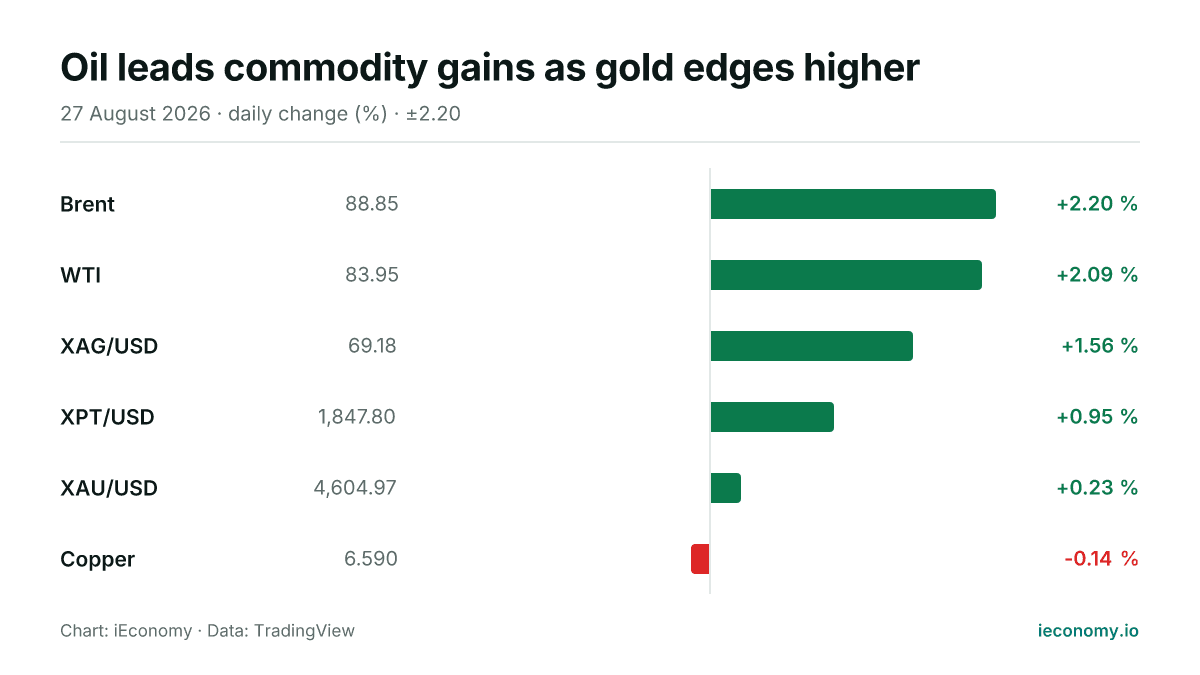
Oil leads commodity gains as gold edges higher
Crude oil outpaced the broader commodity board on Thursday, while silver and platinum also advanced. Gold rose more modestly and copper was the only tracked market to finish lower.
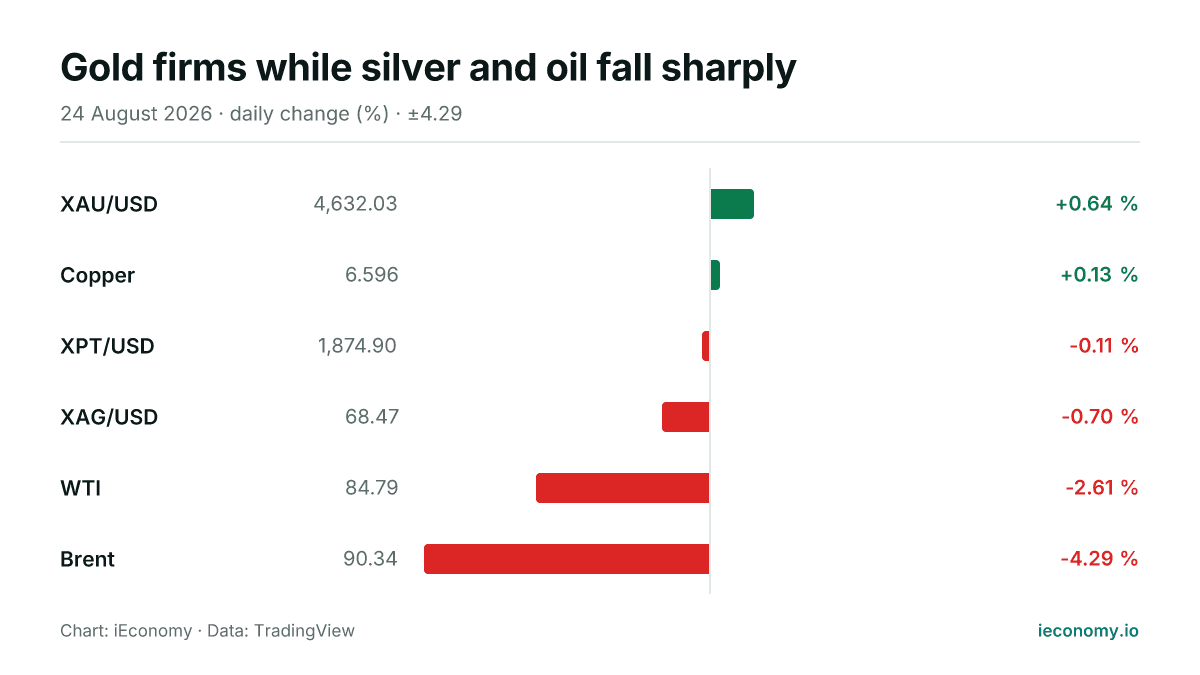
Gold firms while silver and oil fall sharply
Gold edged higher on Monday as silver and crude oil weakened, leaving a mixed but broadly softer commodity tape. Brent and WTI posted the steepest declines, while gold remained the clearest gainer in the digest.
Gold and oil climb as Brent lags on Sunday
Gold, silver and WTI all advanced on Sunday, while Brent fell sharply. The day’s move left five of six tracked commodities higher, with platinum the biggest gainer.
Gold and silver fall as Brent edges higher
On Tuesday, gold, silver and WTI traded lower while Brent was slightly higher. The day left precious metals weaker than crude, with six tracked commodities split between one gain and five declines or flat moves.
Gold and silver slide as oil edges lower
Commodities were mixed on Saturday, with gold and silver taking the heaviest losses while crude oil eased and copper was the only gainer. The day left six tracked markets mostly lower or flat, highlighting how quickly precious metals can move in percentage terms.