Oil jumps while gold and silver fall on the day
Crude oil rose sharply on Tuesday, while gold and silver retreated and copper also eased. The move left only two of six tracked commodities higher, underscoring a broad split in the day’s price action.
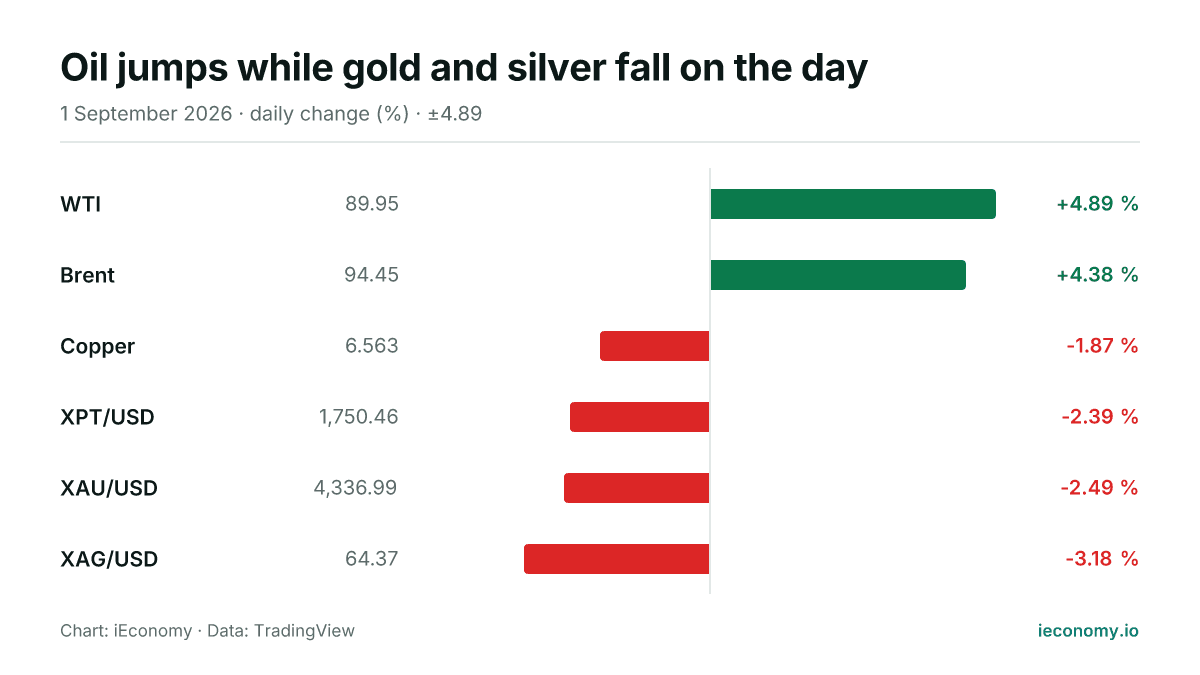
Chart: iEconomy · Data: TradingView
Tuesday’s commodity tape was mixed but skewed weaker outside crude. WTI and Brent advanced strongly, while gold, silver and copper all moved lower, leaving just two of the six tracked instruments in positive territory at the time of writing.
What moved and by how much
WTI led the upside, rising 4.89% to 89.95, with Brent up 4.38% to 94.45. Those gains stood in contrast to the rest of the complex, where the precious metals and copper were under pressure during the same trading day.
| Instrument | Last | Change |
|---|---|---|
| WTI | 89.95 | +4.89 % |
| Brent | 94.45 | +4.38 % |
| Copper | 6.563 | -1.87 % |
| XPT/USD | 1,750.46 | -2.39 % |
| XAU/USD | 4,336.99 | -2.49 % |
| XAG/USD | 64.37 | -3.18 % |
Gold fell 2.49% to 4,336.99 and silver dropped 3.18% to 64.37. Copper also slipped, declining 1.87% to 6.563, so the day’s price action was not confined to one corner of the market.
The standouts at each end
Oil was the clear outperformer, with both major benchmarks higher by more than 4% on the day. That kind of move matters mechanically because it changes the relative pricing between energy and other commodity classes within a single session.
Silver was the weakest of the group, followed by gold. In percentage terms, the gap between the strongest and weakest tracked contracts was wide enough to show distinct flows rather than a uniform commodities move.
What a long-term investor should take from one day
One day’s move should be read as a snapshot, not a verdict. For long-term holders, the main lesson is that commodities can diverge sharply even when they are discussed as one asset class, so daily performance often reflects contract-specific positioning and trading mechanics.
Price changes also need to be considered in context of the instrument itself. A stronger oil market alongside softer gold and silver shows that risk can be concentrated in one segment while another weakens, and that single-session volatility does not by itself establish a durable trend.
This article is not investment advice and recommends no asset, level or direction; a single session's move is not evidence of a trend. For background see Markets, Bear Market, BIST 100, and for terms the finance glossary.
Frequently asked questions
Which commodities were higher on Tuesday?
Which market lagged the most? Silver was the weakest mover in percentage terms, falling 3.18% to 64.37. Gold also declined, while copper eased by a smaller amount than either precious metal.
Which market lagged the most?
How should investors interpret a single day like this? A single session mainly shows how prices can diverge across related markets. It is useful for gauging momentum and relative strength, but it does not by itself explain the longer-term direction of any commodity.
Sources
Related News
Oil climbs as gold and silver ease on Monday
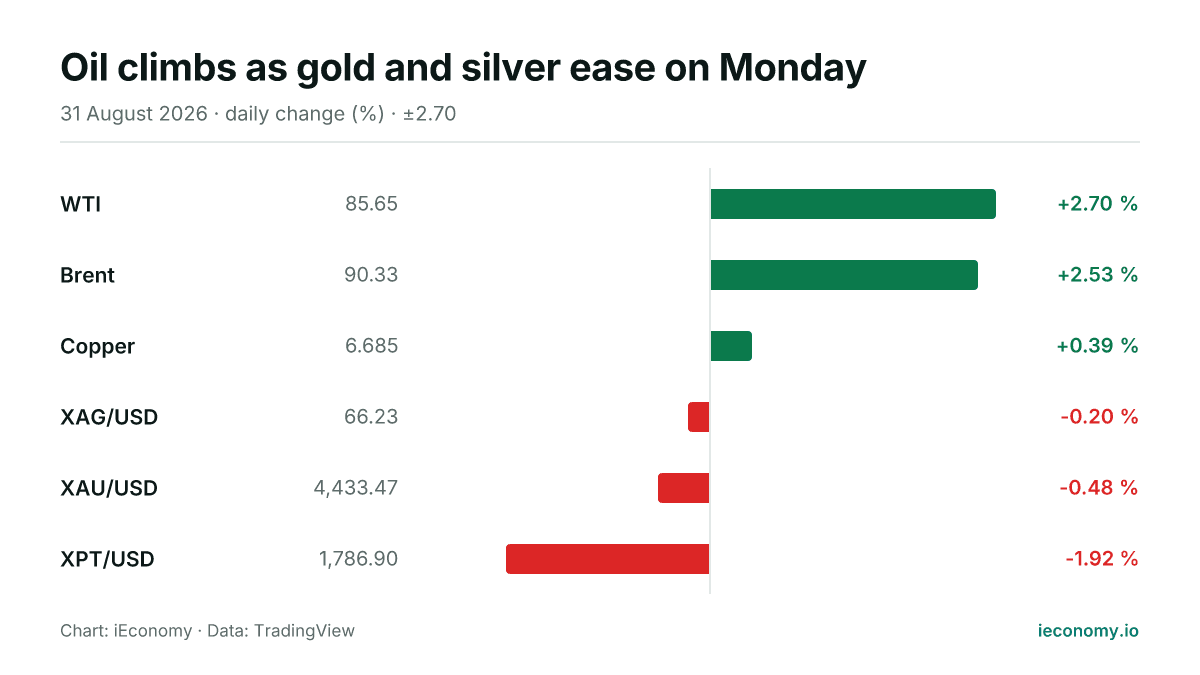
Crude oil advanced on Monday while gold and silver slipped, leaving the complex mixed across the day. The moves were modest in bullion and sharper in energy, with copper also firmer.
Gold and silver slide as oil edges lower
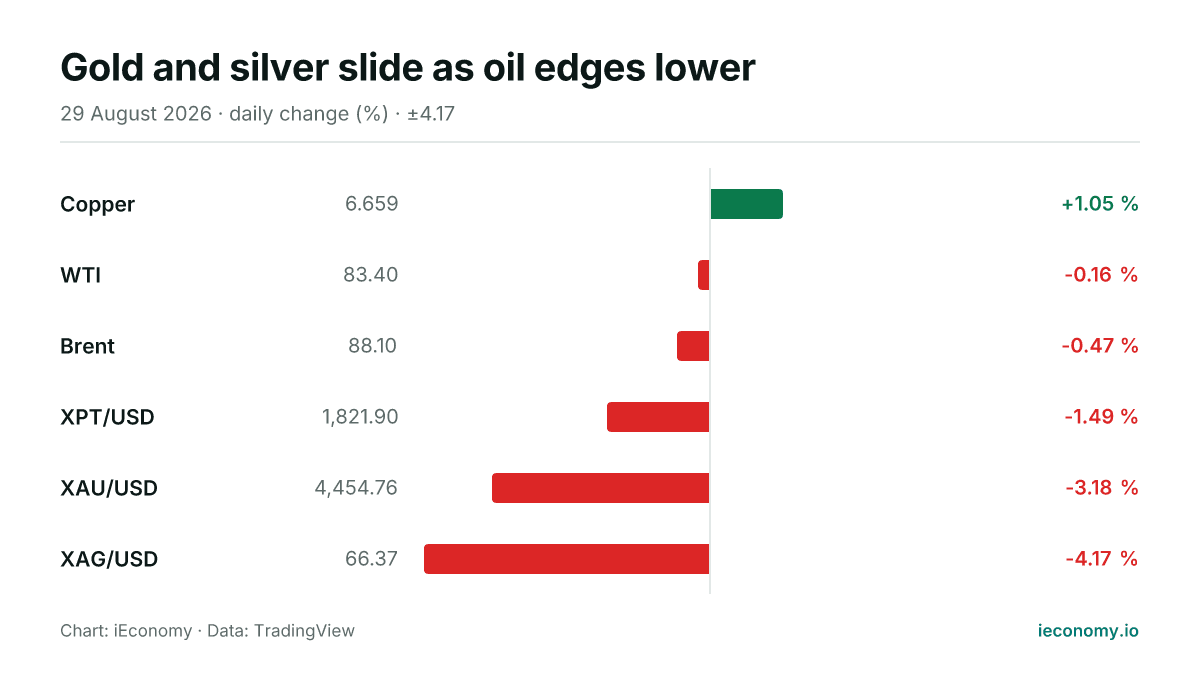
Commodities were mixed on Saturday, with gold and silver taking the heaviest losses while crude oil eased and copper was the only gainer. The day left six tracked markets mostly lower or flat, highlighting how quickly precious metals can move in percentage terms.
Gold, silver and oil slip as copper edges higher
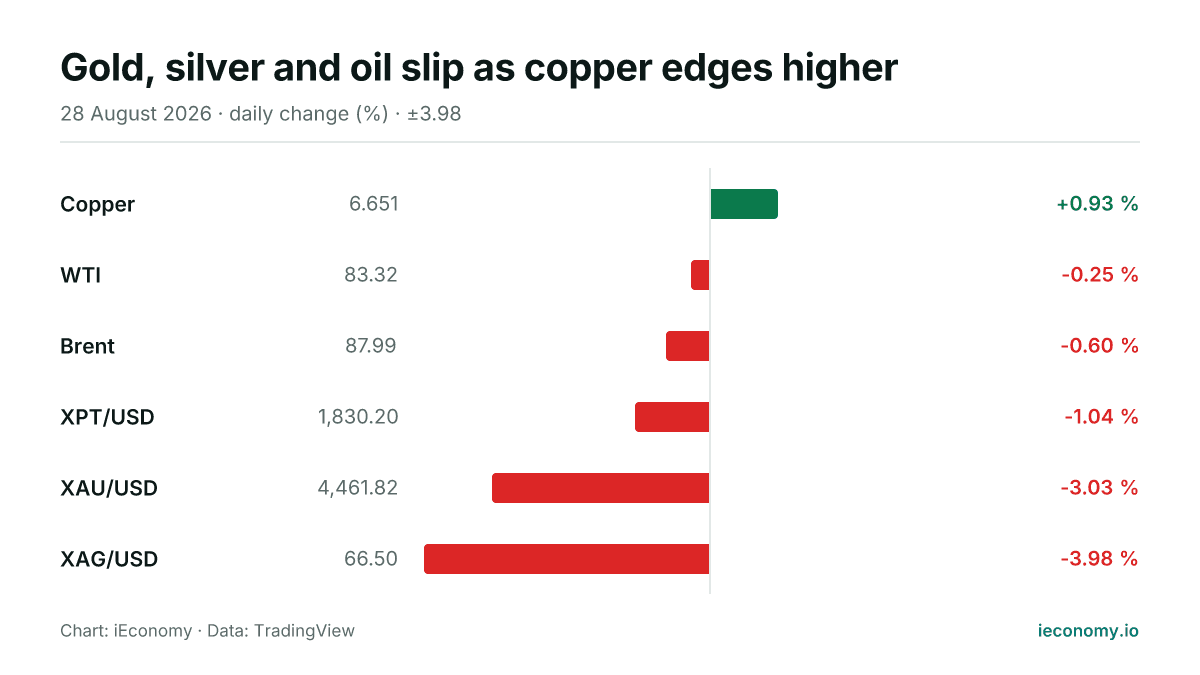
On Friday, gold and silver led losses in the tracked commodity set while crude oil also eased and copper was the only gainer. The move left five of six instruments lower or flat, with the heaviest declines in precious metals.
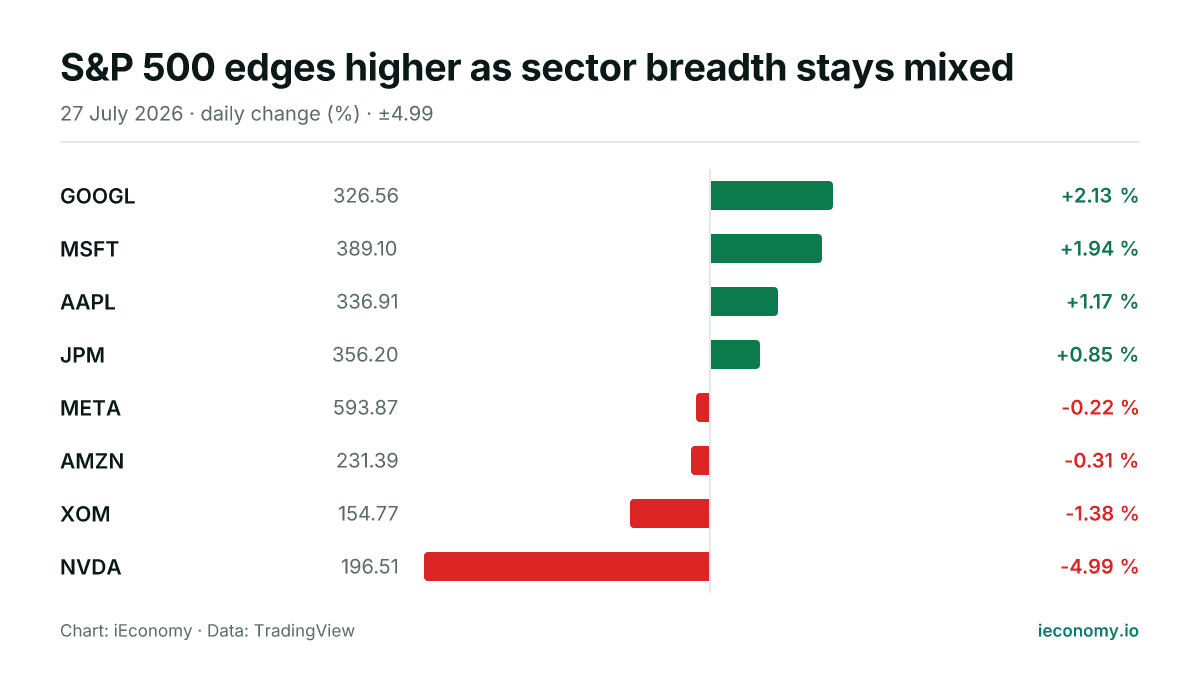
S&P 500 edges higher as sector breadth stays mixed
The S&P 500 finished Monday at 7,413.18, up 0.02%, with an even split among the eight tracked constituents. GOOGL was the strongest performer, while NVDA posted the steepest decline.
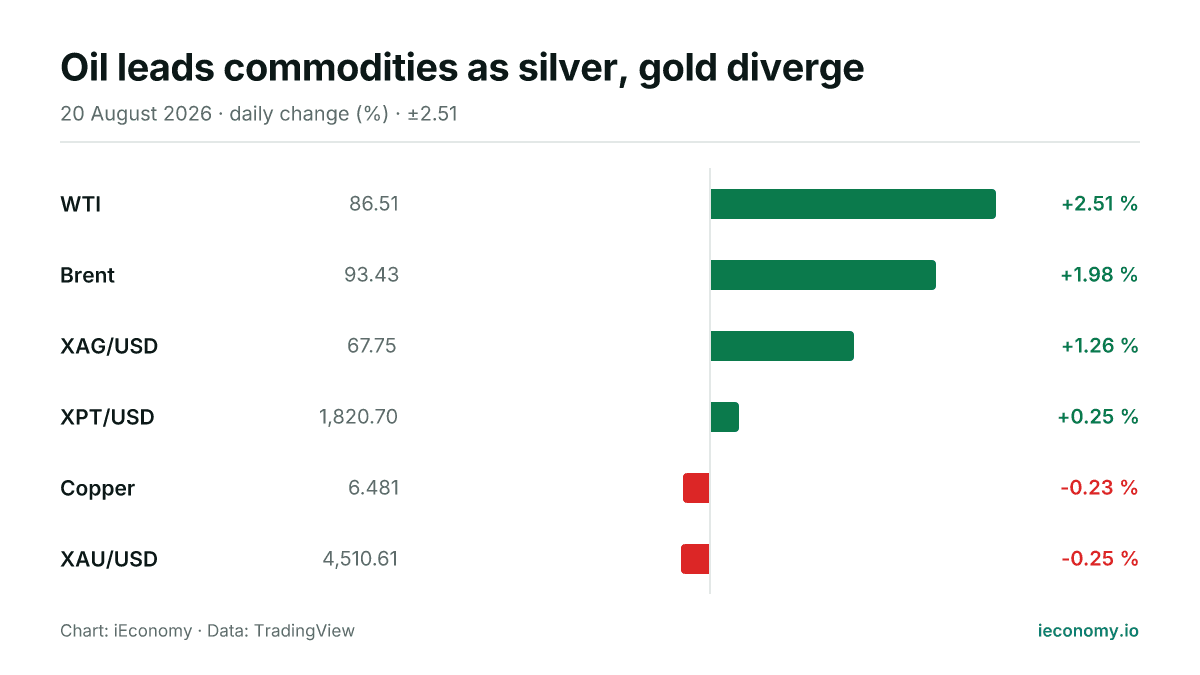
Oil leads commodities as silver, gold diverge
Crude oil rose sharply on Thursday and silver also firmed, while gold slipped modestly. The day left four of six tracked markets higher, with moves still best read as short-term price action rather than a broader verdict.
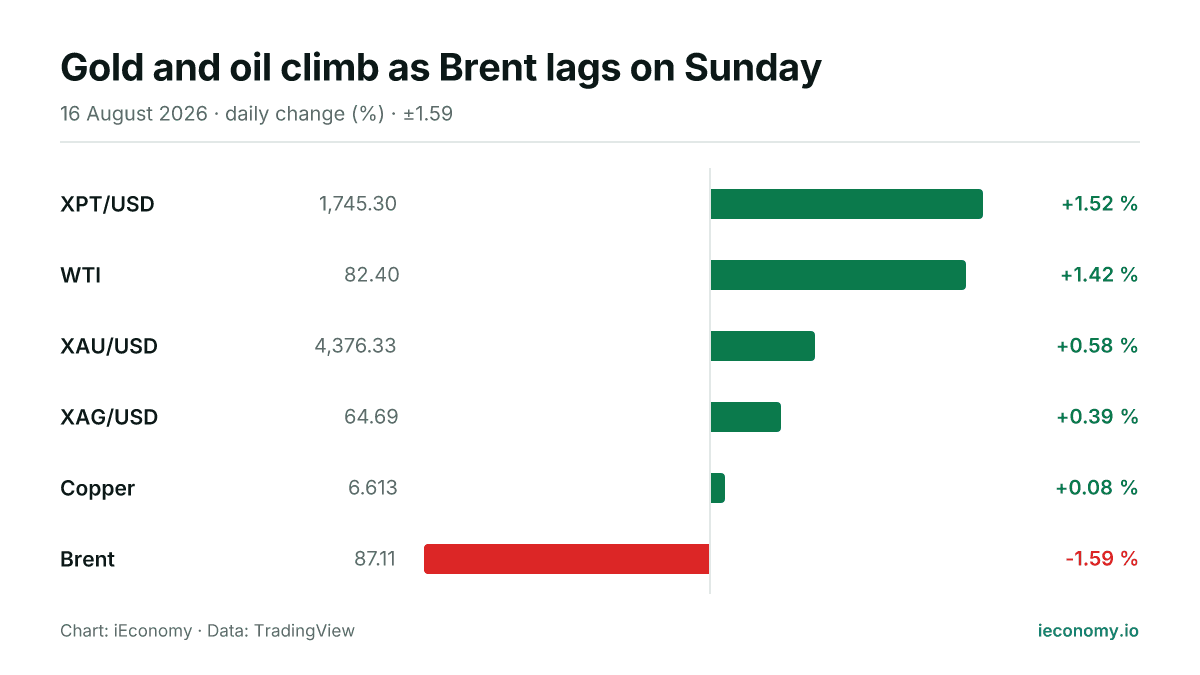
Gold and oil climb as Brent lags on Sunday
Gold, silver and WTI all advanced on Sunday, while Brent fell sharply. The day’s move left five of six tracked commodities higher, with platinum the biggest gainer.