Gold and silver slip as crude edges higher
Gold and silver were weaker on Sunday while Brent and WTI posted gains. The session showed a broad split across the metals and oil complex, with one-day moves that matter for positioning but not for long-term conclusions.
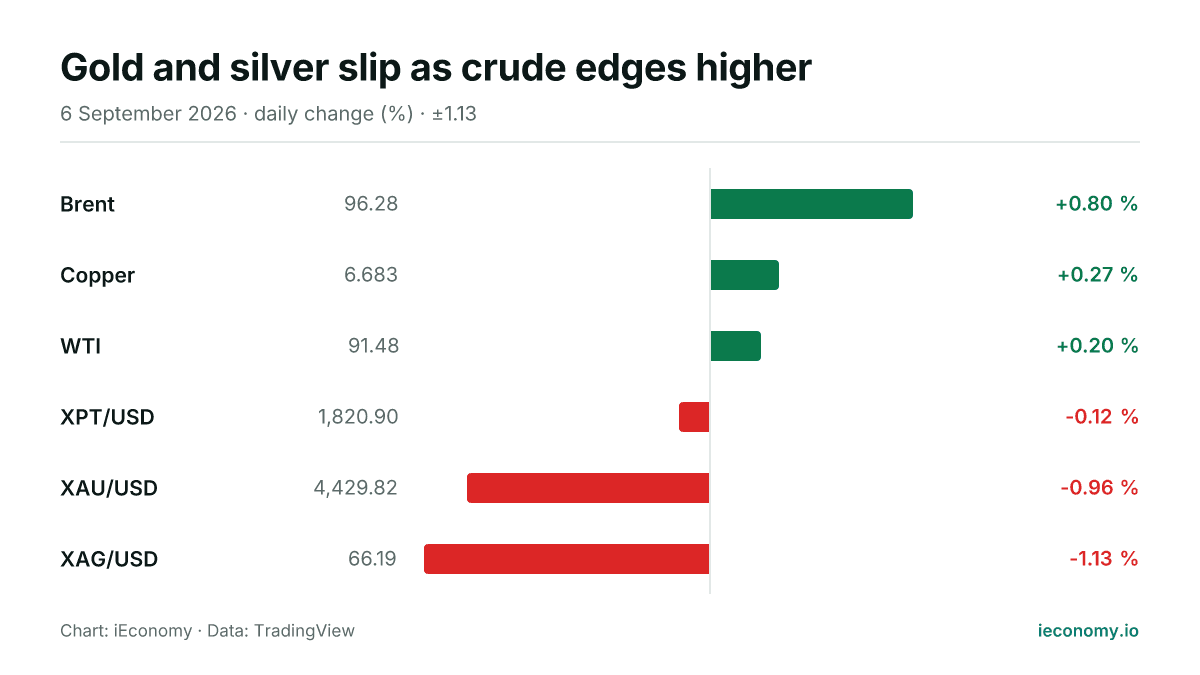
Chart: iEconomy · Data: TradingView
Gold and silver traded lower on Sunday, while crude oil finished the session firmer. The day left the commodity complex split, with three contracts higher and three lower or flat, and the moves were modest enough to read as a positioning day rather than a regime shift.
What moved and by how much
Brent rose 0.80% to 96.28 and WTI added 0.20% to 91.48. In metals, gold fell 0.96% to 4,429.82 and silver dropped 1.13% to 66.19, making the precious-metals leg the weaker side of the tape.
| Instrument | Last | Change |
|---|---|---|
| Brent | 96.28 | +0.80 % |
| Copper | 6.683 | +0.27 % |
| WTI | 91.48 | +0.20 % |
| XPT/USD | 1,820.90 | -0.12 % |
| XAU/USD | 4,429.82 | -0.96 % |
| XAG/USD | 66.19 | -1.13 % |
The broader list also showed copper up 0.27% and platinum down 0.12%. That mix matters because it shows the market was not moving in one clean direction: energy gained, precious metals lost ground, and industrial metals were close to flat.
The standouts at each end
The strongest move came from silver on the downside, with gold not far behind. On the upside, Brent was the clearest gainer among the contracts tracked, while WTI advanced more narrowly and did not match Brent’s pace.
That pattern points to different mechanics within the complex. Relative moves like these can reflect spread trading, currency effects, or changes in hedging activity, but the data alone do not identify a specific catalyst.
What a long-term investor should take from one day
A single session tells you more about short-term flow than about valuation. When the same day produces gains in crude and losses in gold and silver, it is a reminder that commodities do not trade as one block; each contract responds to its own market structure and positioning.
For a longer-term holder, the useful lesson is to separate signal from noise. One-day moves can change entry levels and mark-to-market values, but they are not enough on their own to justify a strategic conclusion without a broader trend.
That is especially true in markets that trade around the clock. Even on a quiet Sunday, prices can adjust as liquidity shifts, and risk remains that moves can widen quickly if participation thins.
This article is not investment advice and recommends no asset, level or direction; a single session's move is not evidence of a trend. For background see Markets, Bear Market, BIST 100, and for terms the finance glossary.
Frequently asked questions
Why did crude oil rise while gold and silver fell?
The digest shows the direction and size of the moves, but not the cause. In practice, different commodity groups often react to different flows, so it is possible for energy to strengthen while precious metals soften in the same session.
Does one day of trading change the long-term picture?
Not by itself. A single session can affect short-term positioning and performance, but longer-term investors usually need a wider run of data to judge whether a move reflects a durable shift or just temporary trading.
What is the main risk in reading this kind of move?
The main risk is over-interpreting a small sample. When only one day is in view, price changes can be driven by liquidity, hedging or spread activity, so the safest reading is to treat them as part of a larger market process rather than a conclusion.
Sources
Related News
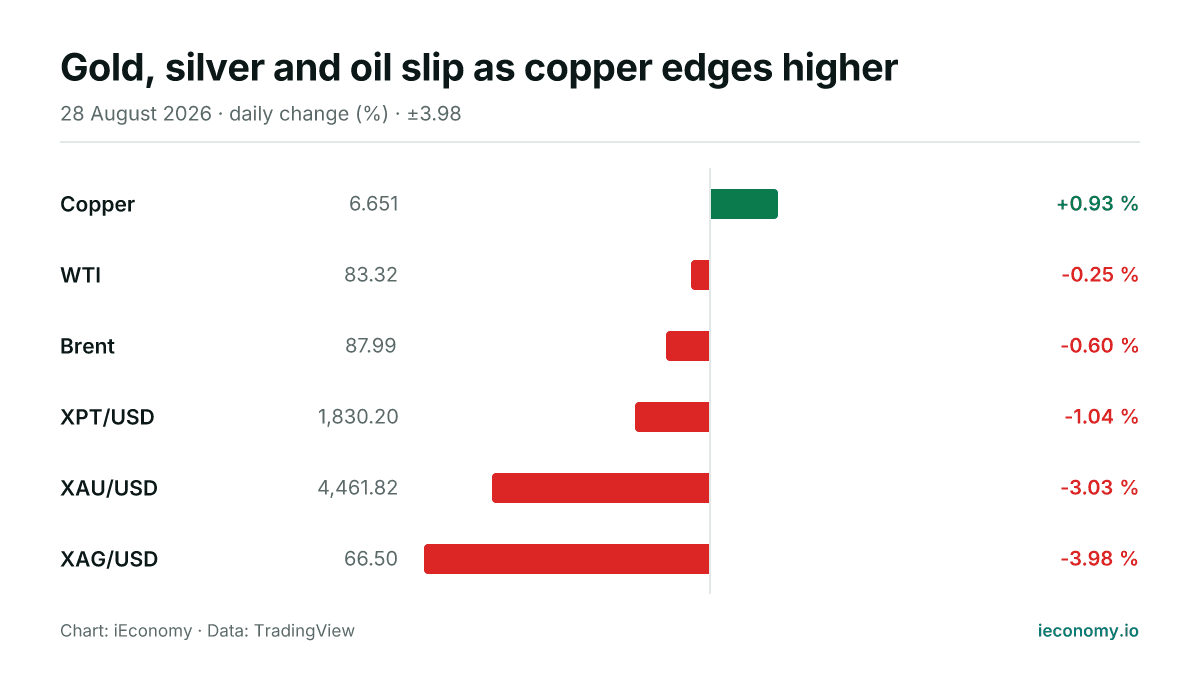
Gold, silver and oil slip as copper edges higher
On Friday, gold and silver led losses in the tracked commodity set while crude oil also eased and copper was the only gainer. The move left five of six instruments lower or flat, with the heaviest declines in precious metals.
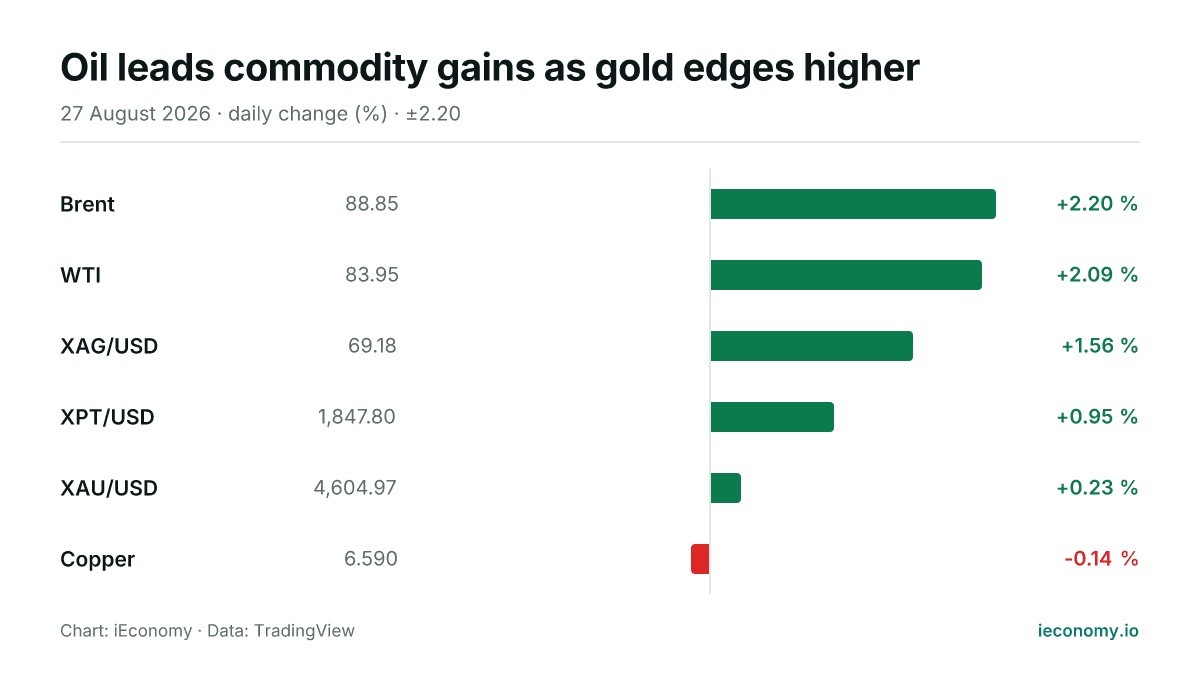
Oil leads commodity gains as gold edges higher
Crude oil outpaced the broader commodity board on Thursday, while silver and platinum also advanced. Gold rose more modestly and copper was the only tracked market to finish lower.
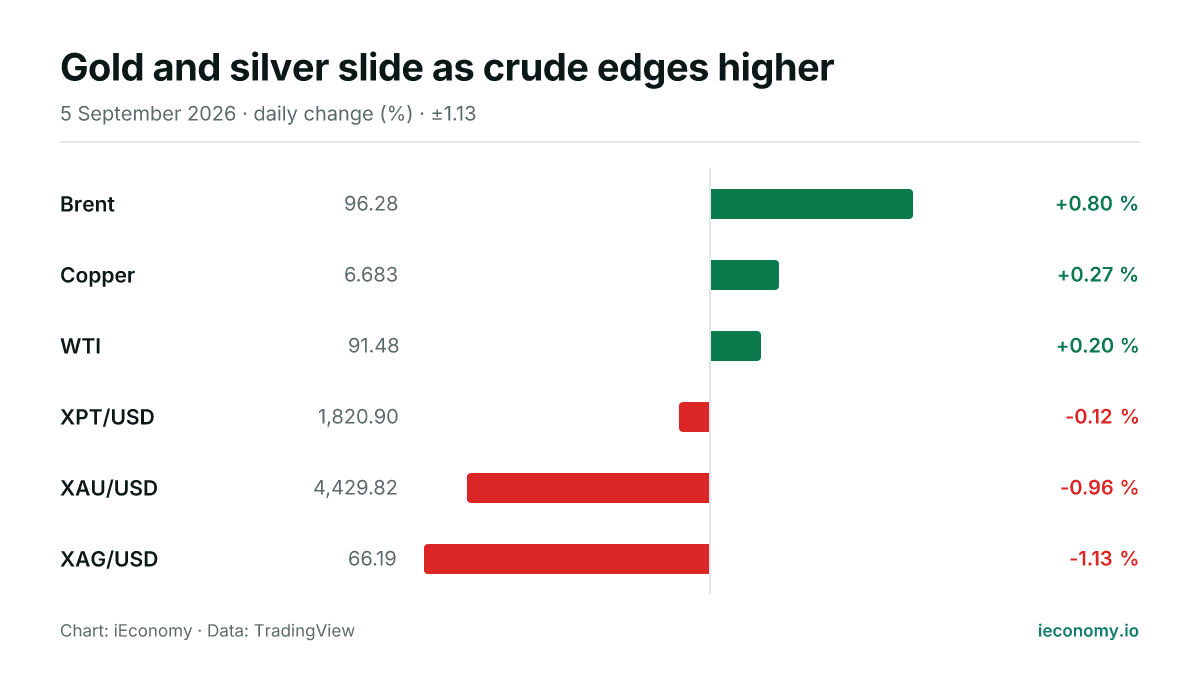
Gold and silver slide as crude edges higher
Gold and silver weakened on Saturday while Brent and WTI moved higher, leaving the complex mixed across six tracked contracts. The day’s moves were modest in crude and sharper in precious metals, with risk still tied to intraday trading conditions.
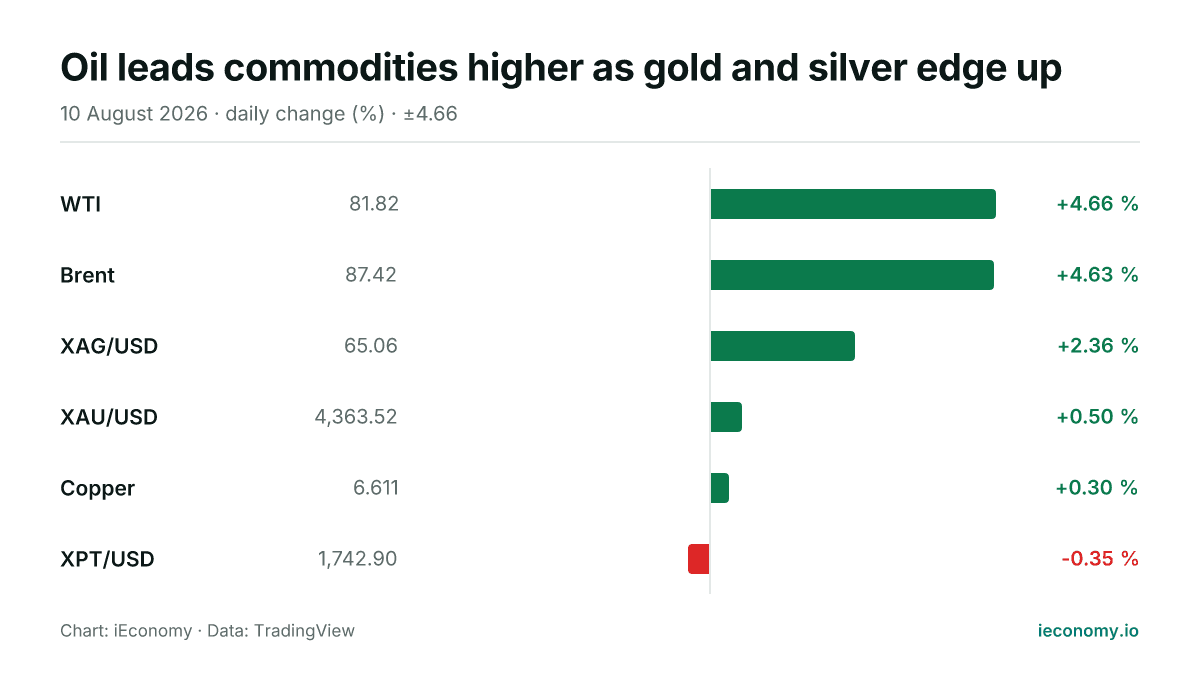
Oil leads commodities higher as gold and silver edge up
Crude oil posted the biggest gains in a broadly firmer commodity session, while gold and silver also advanced. Platinum was the only decliner among the six tracked contracts.
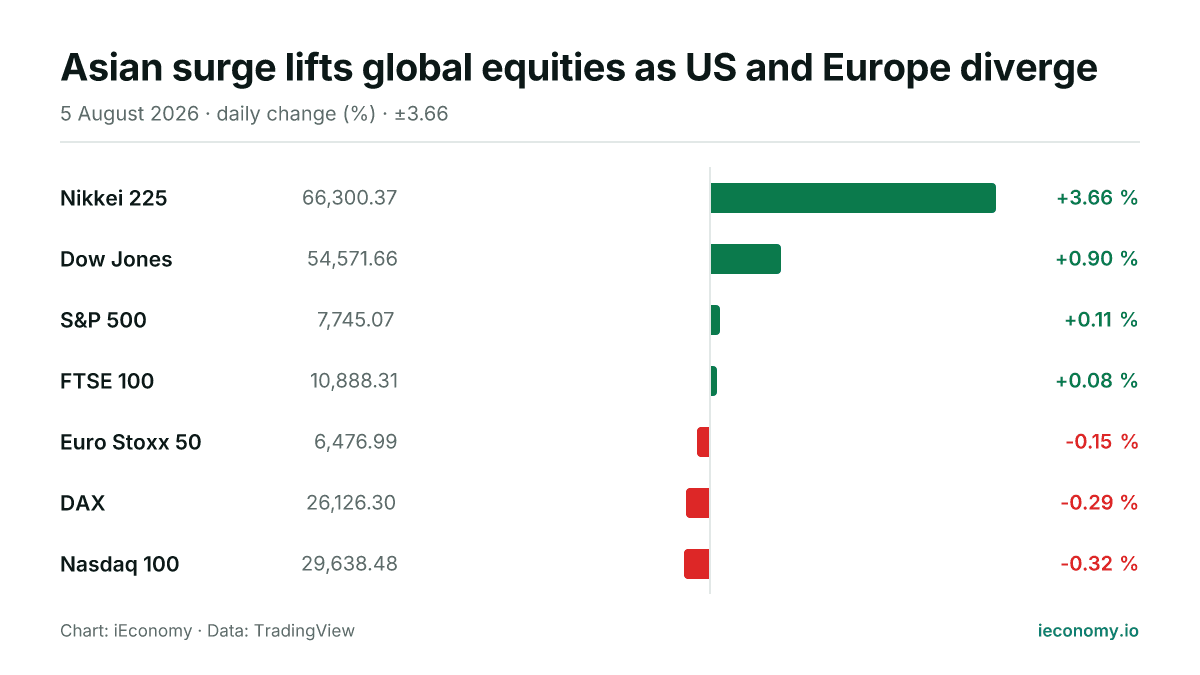
Asian surge lifts global equities as US and Europe diverge
World equity markets were mixed on Wednesday, with Japan leading gains and US benchmarks edging mostly higher while parts of Europe and the Nasdaq 100 slipped. The day left four of seven tracked indices in positive territory, but the moves were uneven across regions and styles.
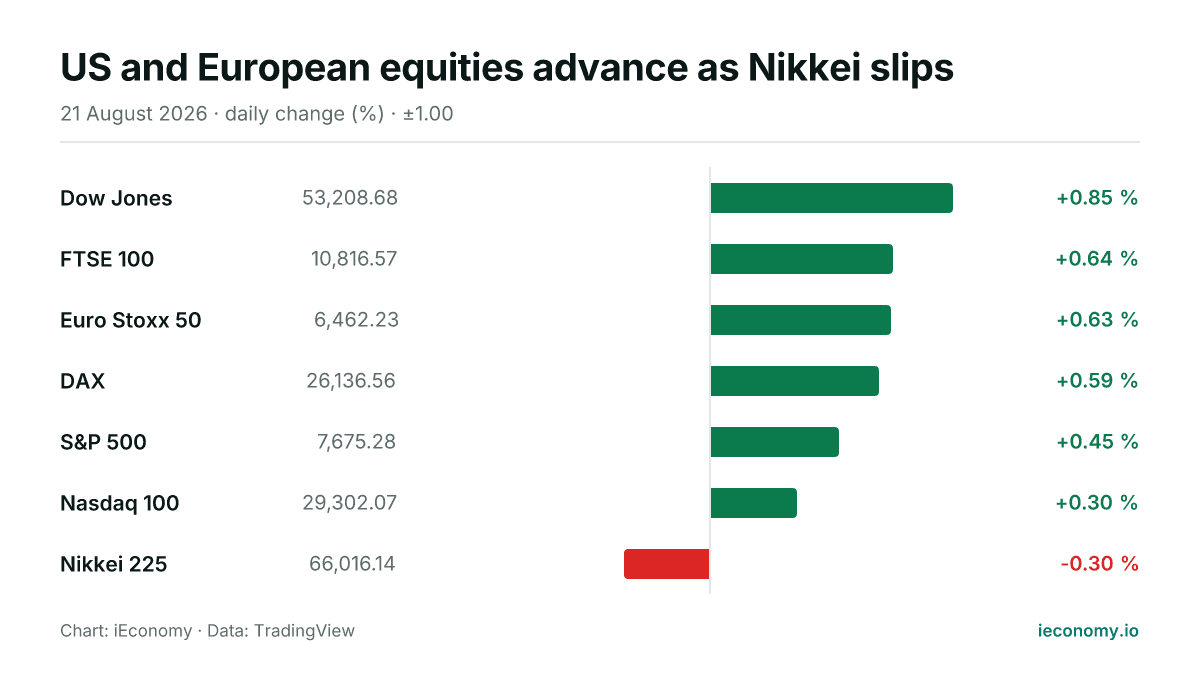
US and European equities advance as Nikkei slips
World equity markets were mostly firmer on Friday, with US and European benchmarks higher and Japan's Nikkei 225 lower. The moves were broad but modest, leaving risk appetite positive without being one-directional.