Gold and silver slide as crude edges higher
Gold and silver weakened on Saturday while Brent and WTI moved higher, leaving the complex mixed across six tracked contracts. The day’s moves were modest in crude and sharper in precious metals, with risk still tied to intraday trading conditions.
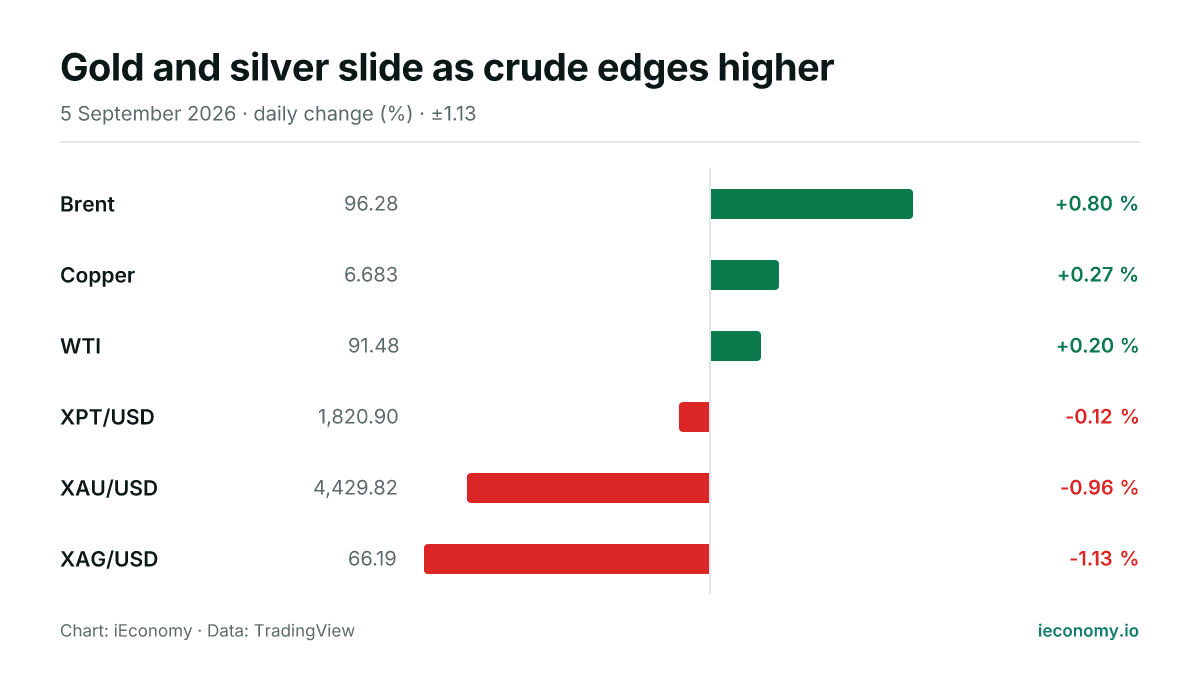
Chart: iEconomy · Data: TradingView
Commodities were mixed on Saturday, with crude oil firmer and precious metals under pressure. Brent and WTI both traded higher, while gold and silver fell, leaving three gains and three declines across the six tracked contracts.
What moved and by how much
Brent rose 0.80% to 96.28 and WTI added 0.20% to 91.48, pointing to a firmer tone in crude. The gains were not large, but they were enough to keep both benchmarks in positive territory as trading was still underway.
| Instrument | Last | Change |
|---|---|---|
| Brent | 96.28 | +0.80 % |
| Copper | 6.683 | +0.27 % |
| WTI | 91.48 | +0.20 % |
| XPT/USD | 1,820.90 | -0.12 % |
| XAU/USD | 4,429.82 | -0.96 % |
| XAG/USD | 66.19 | -1.13 % |
Gold slipped 0.96% to 4,429.82, while silver fell 1.13% to 66.19. Platinum, tracked as XPT/USD, was also lower, easing 0.12% to 1,820.90, so the softer side of the complex was concentrated in precious metals.
The standouts at each end
On the upside, Brent was the clearest mover among the contracts shown, and it was also the strongest of the crude benchmarks. The size of the move suggests a steady bid rather than a sharp breakaway, which matters when trading remains live.
On the downside, silver posted the largest percentage fall in the digest, followed by gold. That combination is notable because both are closely watched for sentiment, and their declines came even as crude held gains.
What a long-term investor should take from one day
A single session can change the short-term mix without altering the broader structure of a market. For long-term investors, the main lesson is that cross-commodity moves often diverge, so the direction of one asset class does not automatically carry through to another.
Mechanically, daily changes can reflect intraday order flow, position adjustment and liquidity conditions as much as any durable shift. That is why one day’s move should be read as a snapshot of pricing, not as a complete explanation of value or trend.
This article is not investment advice and recommends no asset, level or direction; a single session's move is not evidence of a trend. For background see Markets, Bear Market, BIST 100, and for terms the finance glossary.
Frequently asked questions
Which commodity was strongest on the day?
Brent was the strongest of the tracked contracts, rising 0.80% to 96.28. WTI also gained, but its increase was smaller, so crude finished firmer while precious metals weakened.
Which market was weakest?
Silver was the weakest, falling 1.13% to 66.19. Gold also declined, but silver’s larger percentage drop made it the day’s poorest performer in the digest.
What should readers keep in mind about this kind of move?
These changes describe conditions at the moment of writing, not a closed session. The important market mechanics are that different commodities can move in opposite directions on the same day, and short-term price action can be driven by trading flow as well as broader sentiment.
Sources
Related News
Oil jumps while gold and silver fall on the day
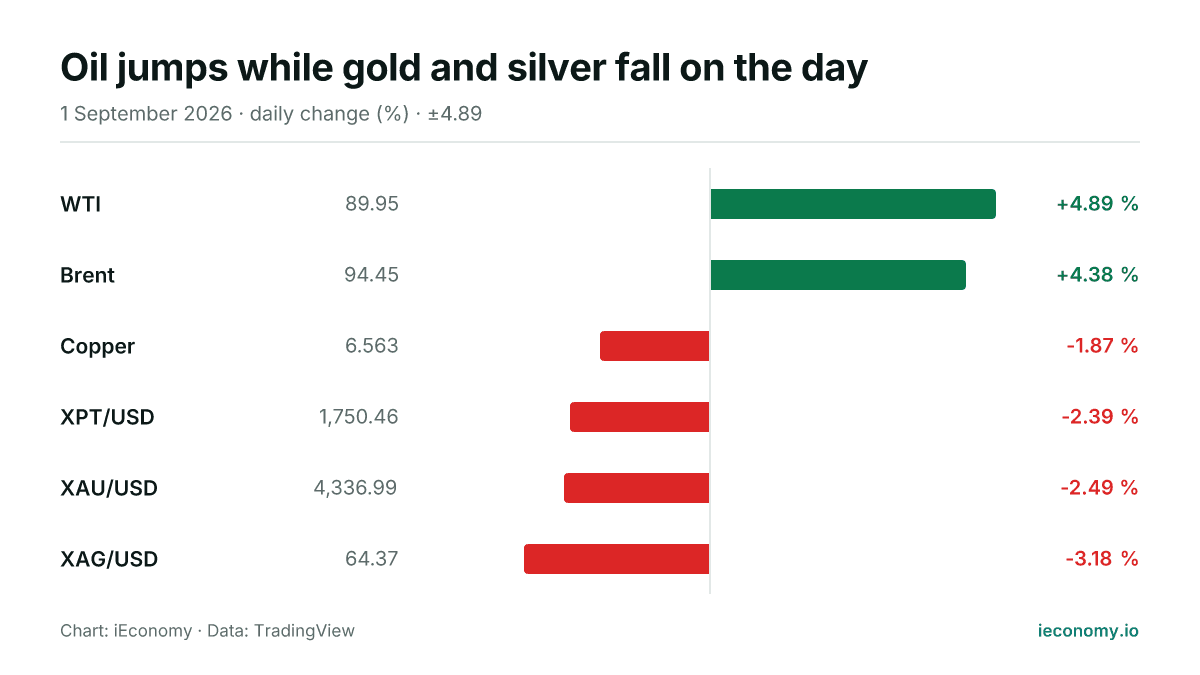
Crude oil rose sharply on Tuesday, while gold and silver retreated and copper also eased. The move left only two of six tracked commodities higher, underscoring a broad split in the day’s price action.
Oil climbs as gold and silver ease on Monday
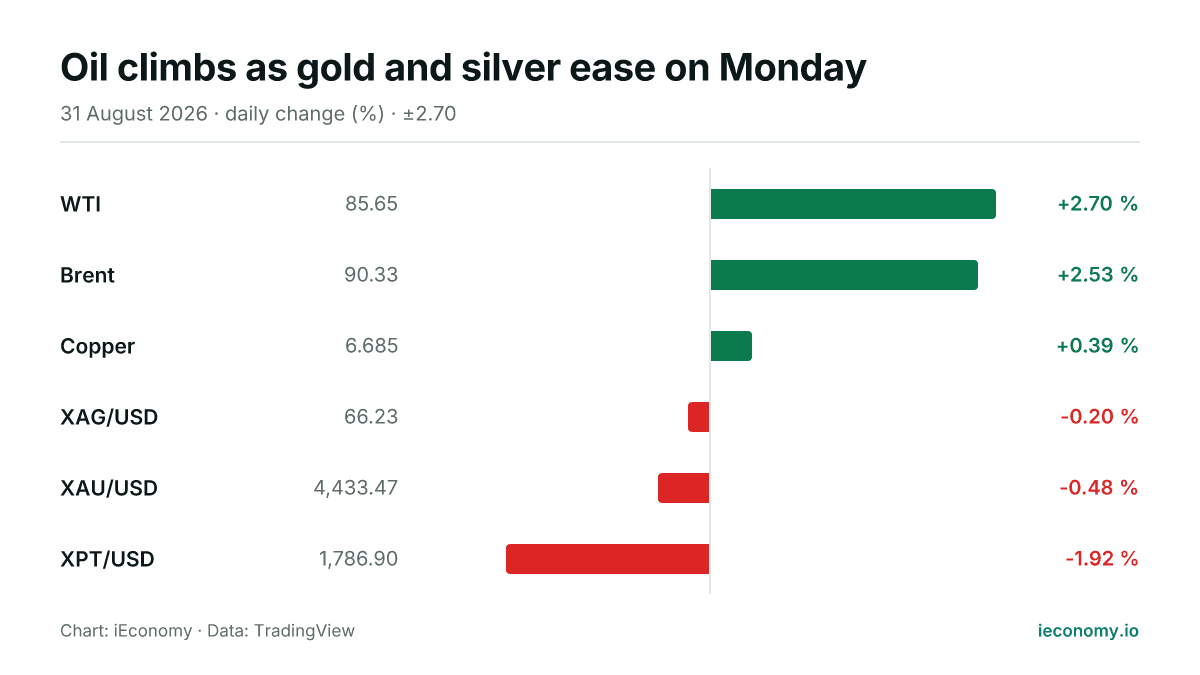
Crude oil advanced on Monday while gold and silver slipped, leaving the complex mixed across the day. The moves were modest in bullion and sharper in energy, with copper also firmer.
Gold and silver slide as oil edges lower
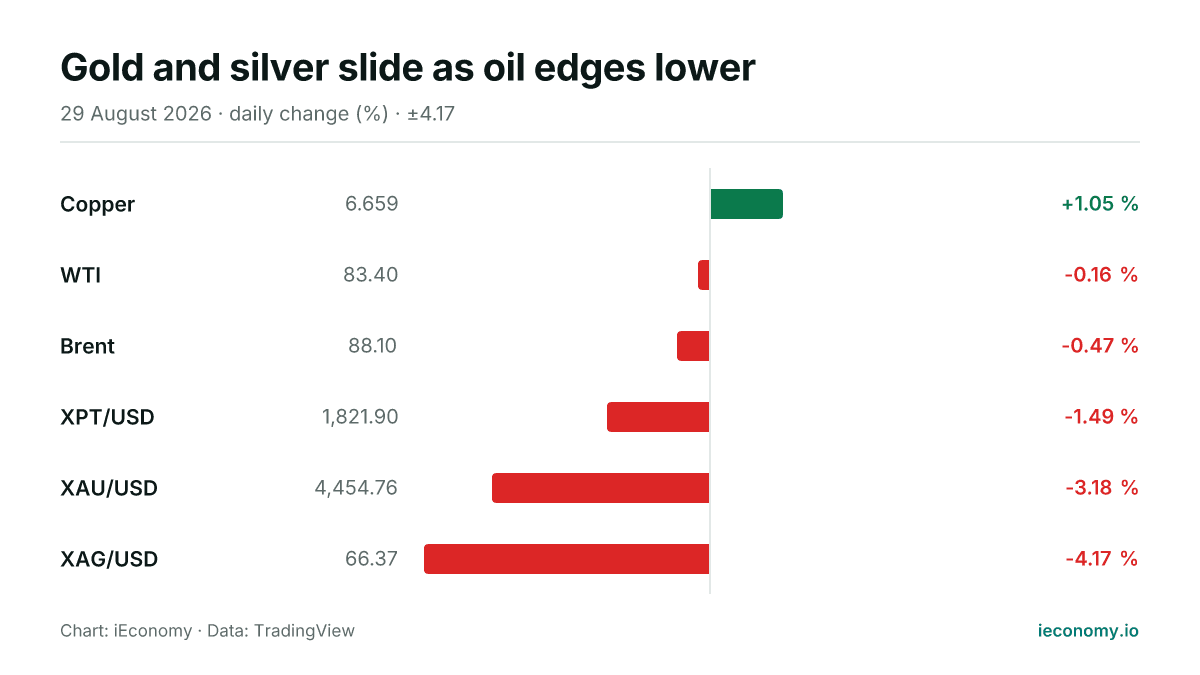
Commodities were mixed on Saturday, with gold and silver taking the heaviest losses while crude oil eased and copper was the only gainer. The day left six tracked markets mostly lower or flat, highlighting how quickly precious metals can move in percentage terms.
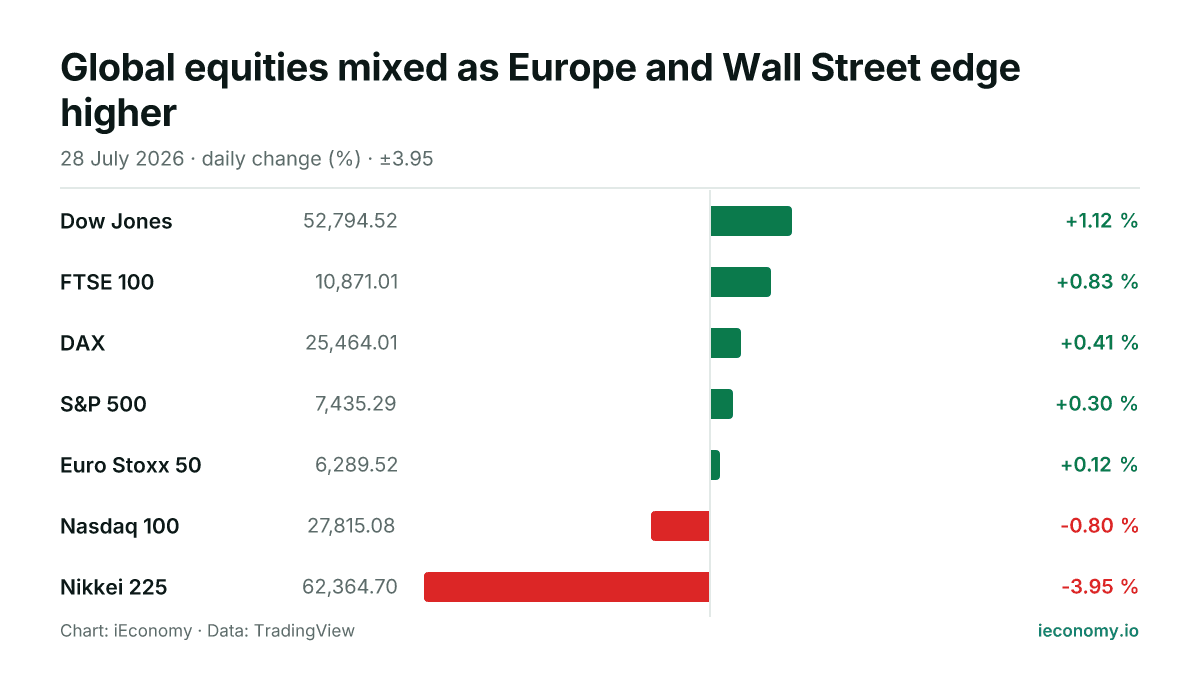
Global equities mixed as Europe and Wall Street edge higher
US and European indices mostly advanced on Tuesday, while Tokyo’s Nikkei 225 fell sharply. The day left a split picture across regions rather than a broad risk-off or risk-on move.
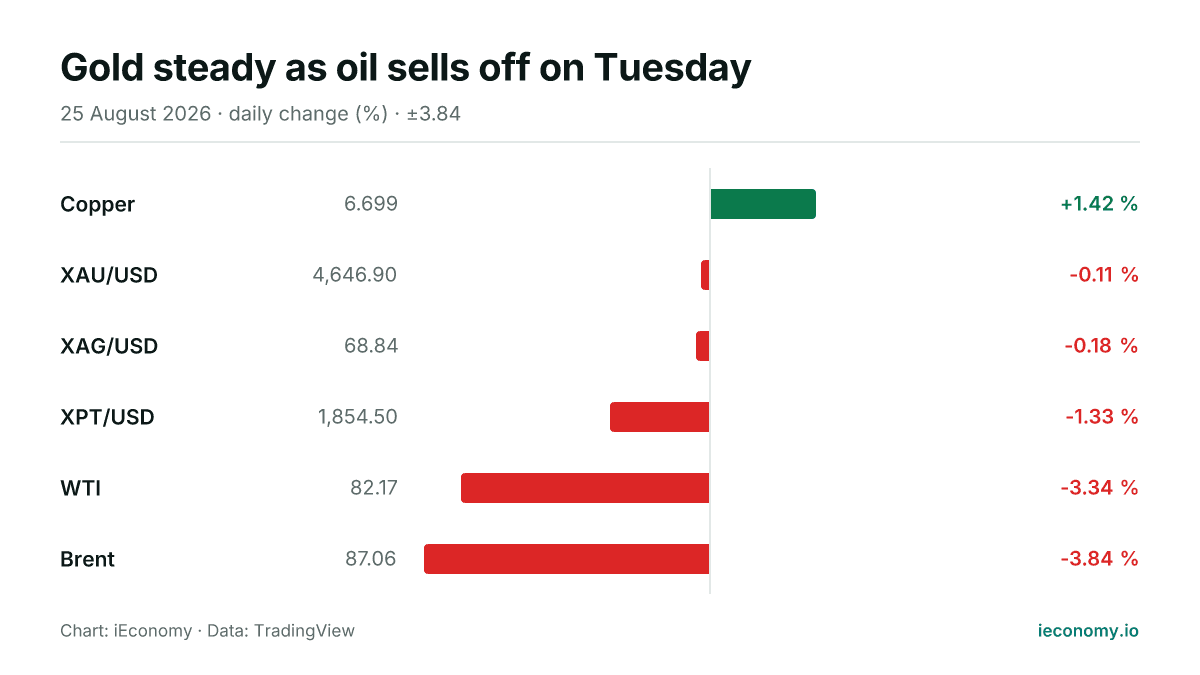
Gold steady as oil sells off on Tuesday
Gold and silver were little changed on Tuesday, while crude oil fell sharply and copper led the small group of gainers. The session left most tracked commodities lower or flat, with one clear outperformer.
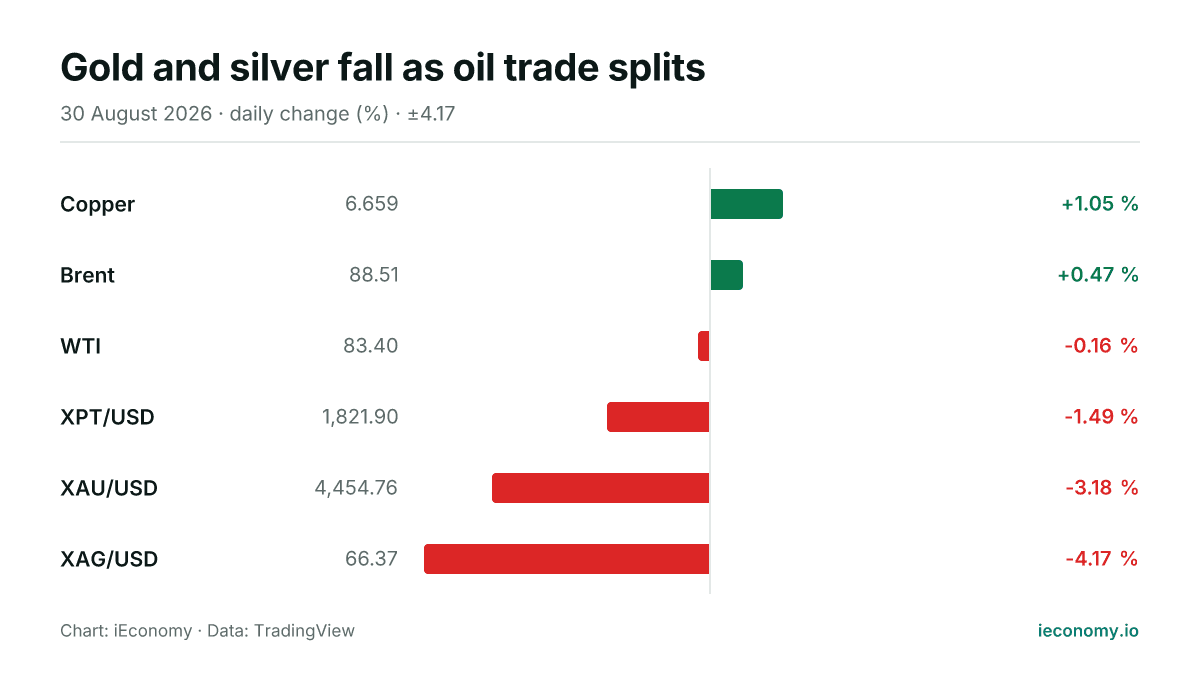
Gold and silver fall as oil trade splits
Gold and silver were weaker on Sunday, while Brent and copper held gains and WTI slipped. The day left the complex mixed, with moves driven by relative positioning rather than any disclosed catalyst.