How to Read Cryptocurrency Charts?
As crypto assets continue to be followed with interest all over the world, investors often use charts to open and close positions...
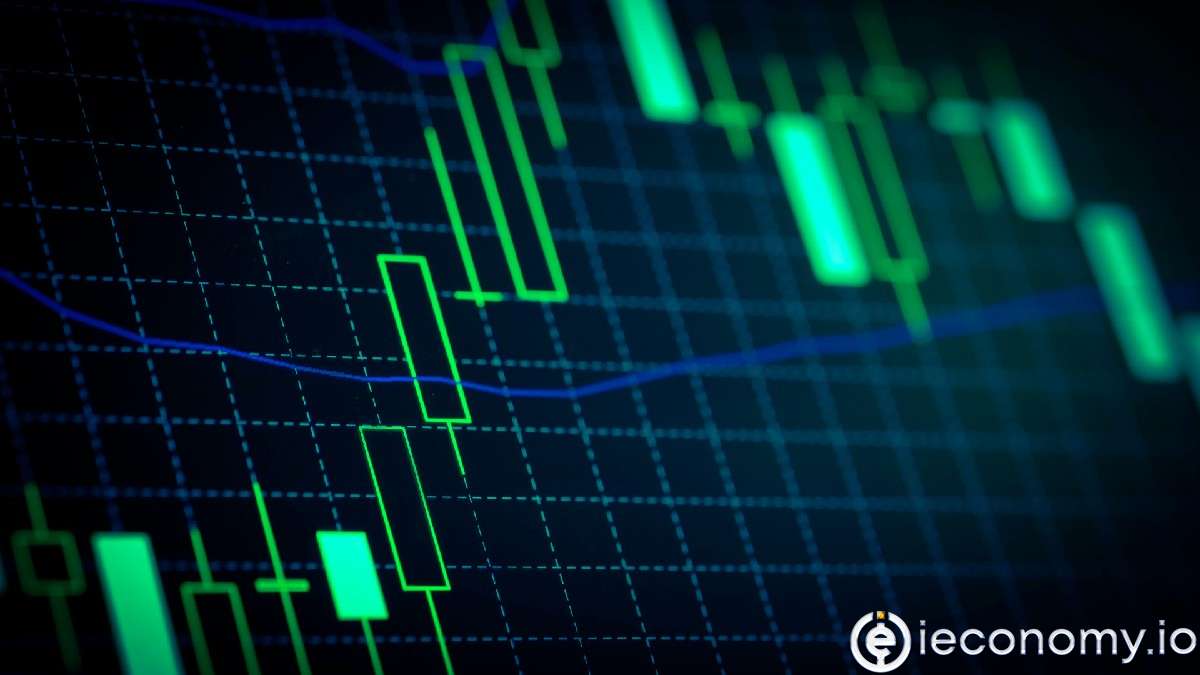

How to read a coin chart:
What is support and resistance?
When the price reaches a level that cannot be exceeded and acts as a kind of barrier to that level. In the case of support, the price reaches a "floor" and in the case of resistance, a "ceiling". Support = demand zone, resistance = supply zone. Resistance is the level at which an uptrend in the price of a cryptoasset ends with increased selling and profit-taking. Selling pressure is created by "bears" aiming for the price to fall or traders looking to take profits at the current level. Heavy selling at the top leads to the formation of a resistance line. Although support and resistance are generally shown as lines, they do not have precise lines. Another thing to keep in mind is that markets have no mechanism to avoid crossing a certain level. Since cryptocurrency traders and traders will encounter the same levels, there may be an increase in liquidity in these areas. It's easy to enter or exit support and resistance points, especially for whales that trade large volumes.What is a Trendline?
In the technical analysis of the price of any financial asset, the line formed over successive support or resistance values is called a trendline. Resistance levels start to form when the market is in an uptrend. The main element used for the trend line is the market's historical data. The strength of each support or resistance level and the trend line formed by them increases as they repeat over time. In other words, if the same price has worked as resistance or support multiple times, the strength and accuracy of the trend line that crosses it will increase.You may also be interested in this: What Are Candlestick Patterns Used in Technical Analysis? A candlestick chart is a chart that shows a specific period of time. Candlestick charts are created by taking into account the opening and closing prices of a financial asset's low and high. What are bullish candlestick patterns, stock market candlestick patterns used in the markets? https://ieconomy.io/teknik-analizlerde-kullanilan-mum-grafik-formasyonlari-nelerdir/ The investment information, comments and recommendations contained herein are not investment advice. Investment advisory services are provided individually, taking into account the risk and return preferences of individuals. The content, comments and recommendations contained herein, which are in no way directive in nature, are of a general nature. These recommendations may not be suitable for your financial situation and risk and return preferences. Therefore, making an investment decision based solely on the information contained herein may not produce results in line with your expectations.
Frequently asked questions
What are the main types of charts used in cryptocurrency trading?
The primary chart types for crypto trading are candlestick charts, line charts, and bar charts. Candlestick charts are the most popular as they visually convey key price data like open, close, high, and low within a specific time frame, which is essential for technical analysis.
How do you read a cryptocurrency candlestick chart?
Reading a candlestick chart involves interpreting the 'body' and 'wicks' of each candle. The body shows the opening and closing prices, while the wicks indicate the highest and lowest prices reached during that period; a green or white candle typically signifies a price increase, and a red or black candle indicates a decrease.
Why is technical analysis important for reading crypto charts?
Technical analysis is crucial because it uses historical price data and chart patterns to identify potential market trends and trading signals. In the volatile cryptocurrency market, correctly interpreting these charts helps traders make informed decisions about entry and exit points.
What is the difference between fundamental and technical analysis in crypto?
Fundamental analysis evaluates a cryptocurrency's intrinsic value based on news, sector developments, and broader financial factors. Technical analysis, in contrast, focuses solely on statistical trends derived from market activity and price charts to forecast future price movements.
Related News

Candlestick Patterns: Chart Formations and What They Mean
Single, two and three-candle patterns — doji, hammer, bullish engulfing, morning star — with the structure of each, the trend it is looked for in, and an original diagram for every one.

Stock Market Hours and Holidays: NYSE and Nasdaq Guide
A clear reference to regular U.S. stock market hours, pre-market and after-hours trading, early closes, holiday closures, and how bond-market holidays differ.

How to Cash In Savings Bonds: Electronic and Paper
Learn how to redeem U.S. savings bonds through TreasuryDirect or a bank, when penalties apply, how partial redemptions work, and what to do with inherited or lost bonds.

“How to Trade” with GCM Forex
It is known that there are 58 country stock exchanges that are members of the World Stock Exchange Federation, excluding affiliates and...

What is a Foreign Currency? Which Factors Determine the Exchange Rate?
What is a foreign currency? Which factors determine the exchange rate? This week, we'll cover what a foerign currency is with contributions of Investing.com.

What is Expected from New US Treasury Secretary Yellen?
What is expected from the new US Treasury Secretary Yellen? Janet Yellen will present at the Senate today.