Candlestick Patterns: Chart Formations and What They Mean
Single, two and three-candle patterns — doji, hammer, bullish engulfing, morning star — with the structure of each, the trend it is looked for in, and an original diagram for every one.

Unknown author / Wikimedia Commons (CC0)
Candlestick patterns are recognizable arrangements of candles that combine a financial asset’s open, close, high and low prices into a single bar over a given time period. They can consist of a single candle or of two or three candles; each one tells how the struggle between buyers and sellers ended during that period.
This guide introduces single-candle, two-candle and three-candle patterns with original diagrams; it explains the trend context in which each pattern becomes meaningful, what confirmation means, and where patterns fall short. None of the sections here contains trading advice; the aim is to read correctly what the shape seen on the chart is telling us.
Candlestick anatomy: what does a candle show?
A candlestick chart is a price chart that shows each time period’s open, close, high and low with a single shape. The body is the distance between the open and the close, while the thin wicks extending beyond the body show the extreme prices reached during that period. If the close is higher than the open, a bullish candle forms; if it is lower, a bearish candle forms.
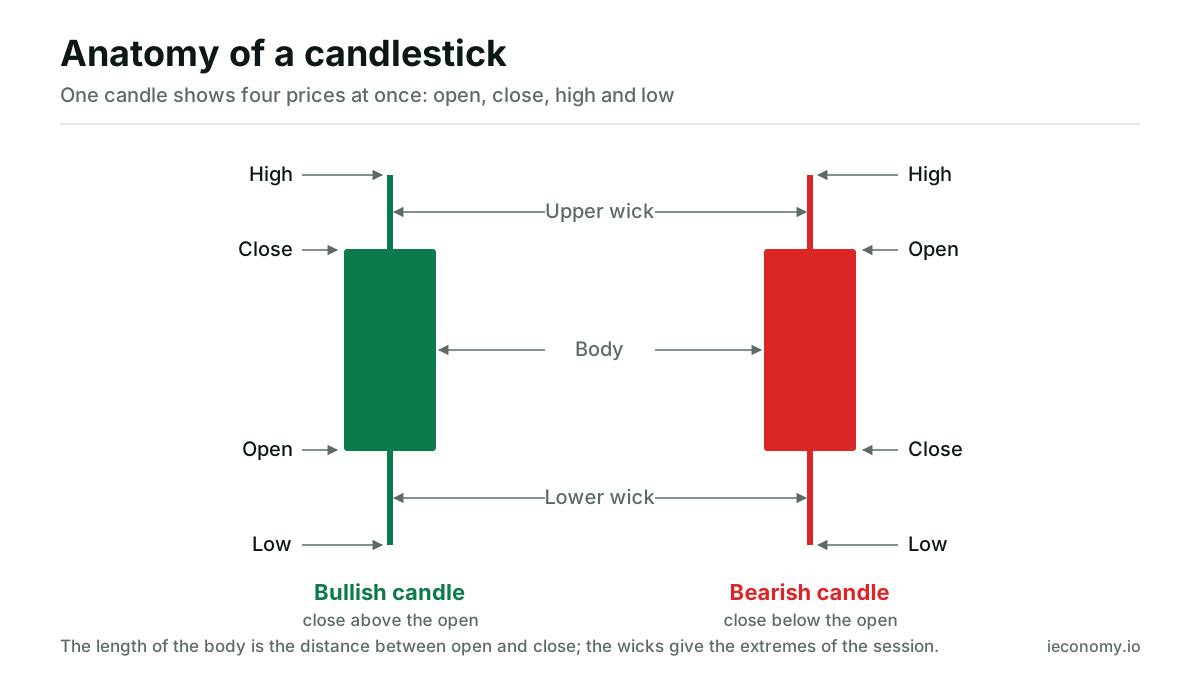
The length of the body and the length of the wicks are read together. A long body shows a strong move in one direction from open to close; a short body and long wicks show that price swung both ways and closed near where it started. The duration covered by a candle depends on the chart’s timeframe: on a daily chart, one candle is one session; on an hourly chart, it is one hour. The same pattern tells a different story on different timeframes.
Why do candlestick charts carry more information than line charts?
A line chart connects only closing prices; a candlestick chart shows all four prices for each period. This makes it possible to see at a glance where price started, how high it rose, how low it fell and where it closed. These details, which disappear entirely in a line chart, are the basis of patterns.
One example makes the difference clear: an asset that drops sharply during the day and recovers by the close leaves an almost flat point on a line chart. On the same day, on a candlestick chart, it appears as a candle with a small body and a very long lower wick. That is exactly what patterns describe: where buyers and sellers stepped in on the way to the close.
What Are Single-Candlestick Patterns?
Single-candlestick patterns are formations read solely from the body and wick proportions of one candle. Doji and its variants, hammer, inverted hammer, hanging man, shooting star, marubozu and spinning top belong to this group. In all of them, three measurements are decisive: the length of the body, where the body sits within the candle, and the ratio of the wicks to the body.
What Is a Doji?
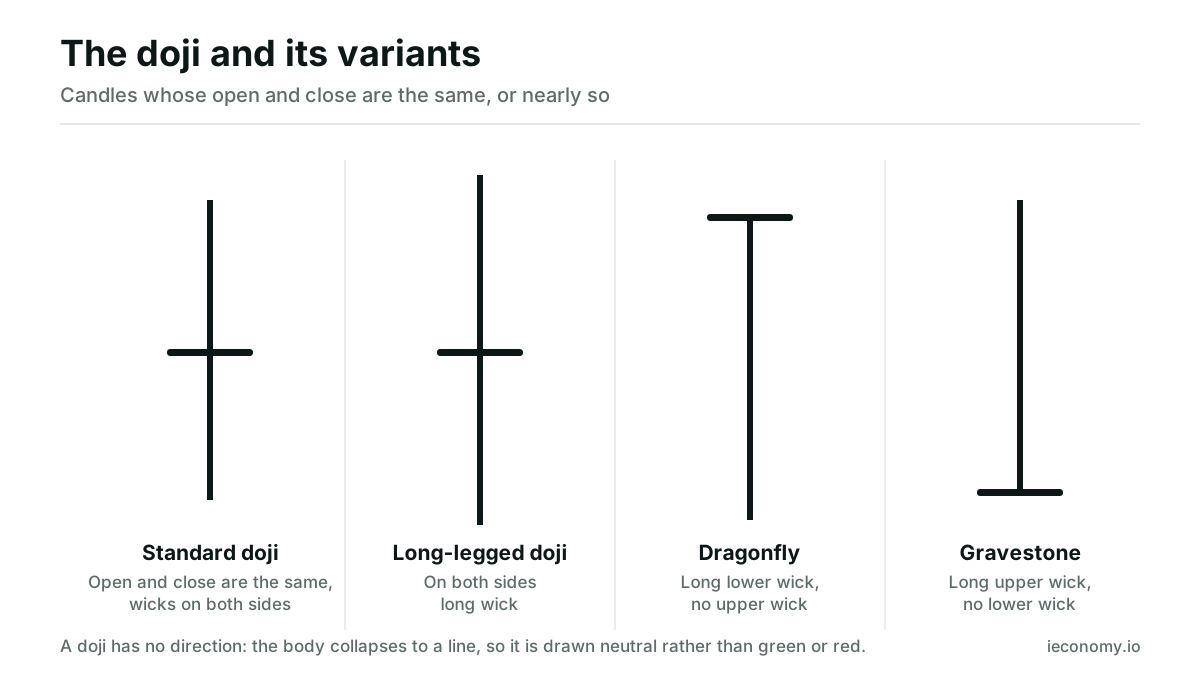
A doji is a candle in which the open and close are the same or very close to each other, so its body shrinks almost to a line. Buyers and sellers have failed to establish dominance during the period, and the price has returned to where it started. A doji does not indicate direction on its own; its meaning comes from the length of its wicks and the trend in which it forms.
What Are the Types of Doji?
Doji types are distinguished according to the distribution of the wicks. In a standard doji, the body is in the middle and there are wicks of similar length on both sides. In a long-legged doji, both wicks are distinctly long. In a dragonfly doji, the body is at the very top with only a lower wick, while in a gravestone doji, the body is at the very bottom with only an upper wick.
What Is a Long-Legged Doji?
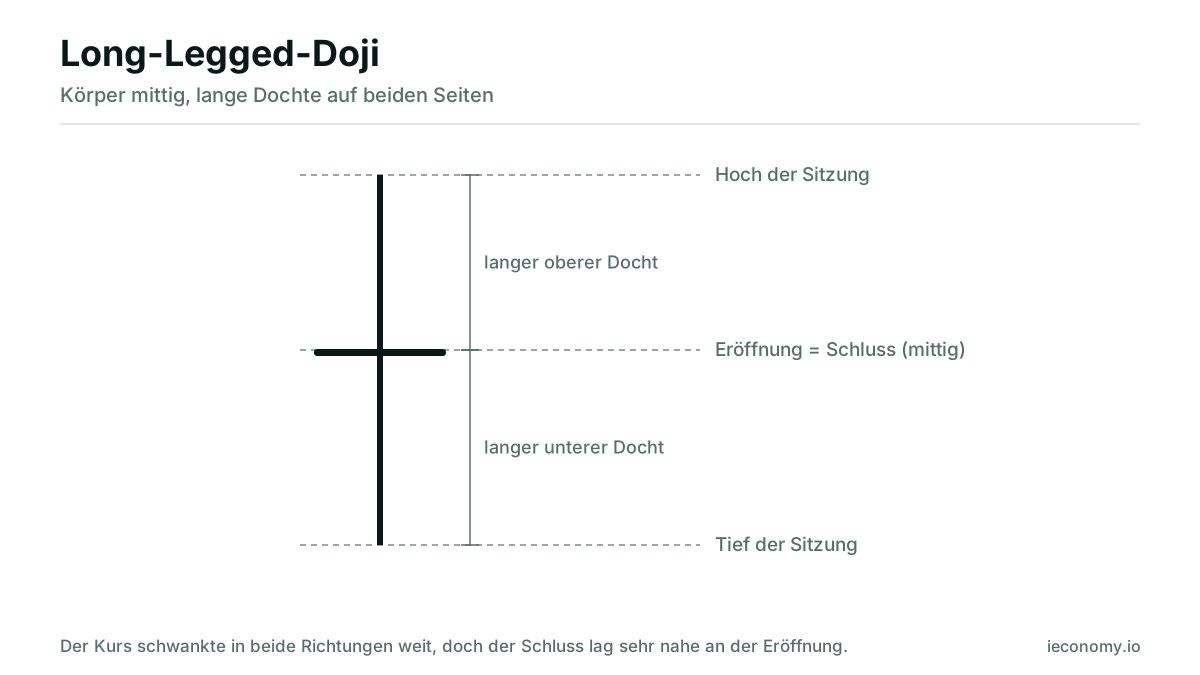
A long-legged doji is a doji in which the open and close meet near the middle of the body and long wicks extend both upward and downward. When the open and close overlap exactly in the middle, this shape is also called a rickshaw man in Nison's literature. The price has swung in both directions over a wide range during the period, but by the close it has returned to the opening level. It is the doji form in which indecision is most clearly visible.
What is a dragonfly doji?
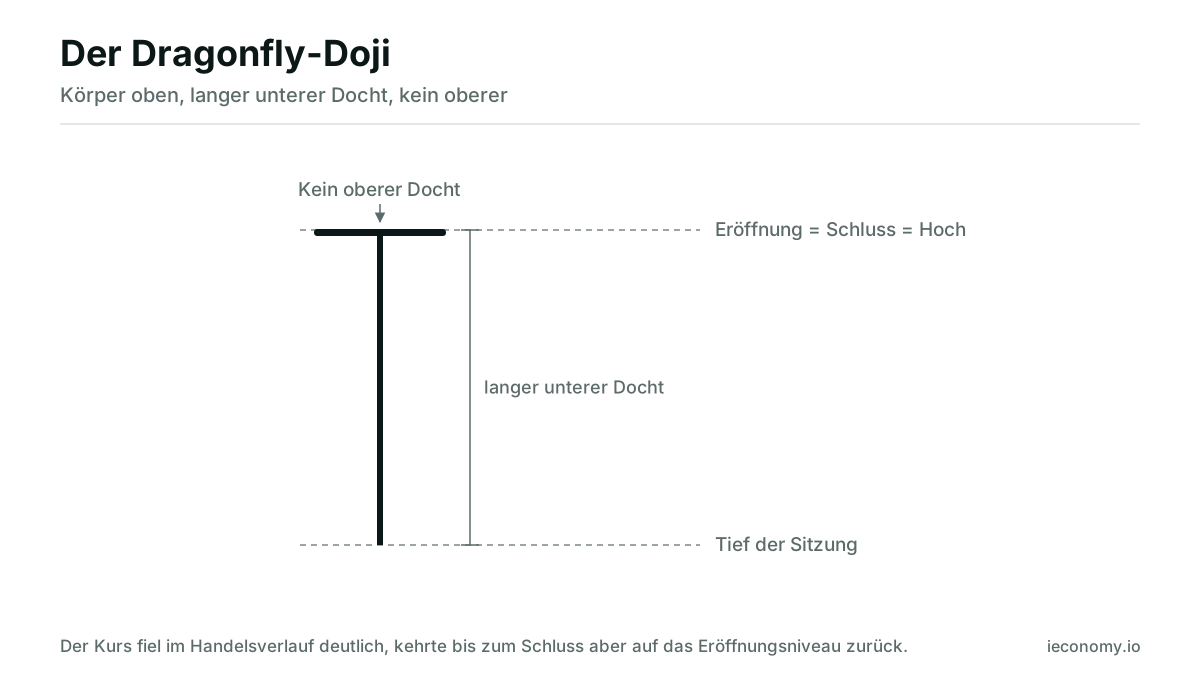
A dragonfly doji is a doji in which the open and close coincide at the high of the period, with a long lower shadow extending below the body and no upper shadow. Price fell noticeably during the period, then all of that decline was retraced, so the close took place near the high.
What is a gravestone doji?
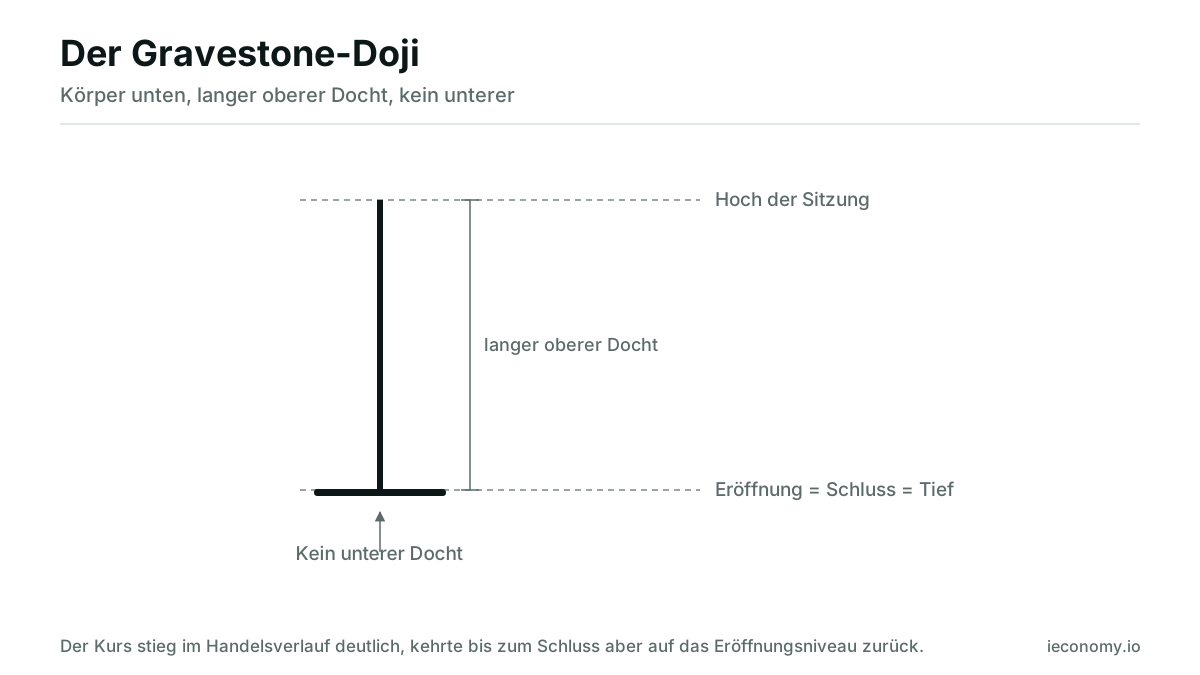
A gravestone doji is a doji in which the open and close coincide at the low of the period, with a long upper shadow extending above the body and no lower shadow. Price rose noticeably during the period, but all of that advance was given back, so the close formed near the low.
What is a hammer pattern?
A hammer is a single-candle pattern with a small body at the upper part of the candle, no upper shadow or a very short one; a lower shadow at least twice the body’s length is a common threshold, while Nison describes a range of 2 to 3 times. It is sought at the bottom of a downtrend. Price was sold off sharply, then much of that move was recovered by the close.
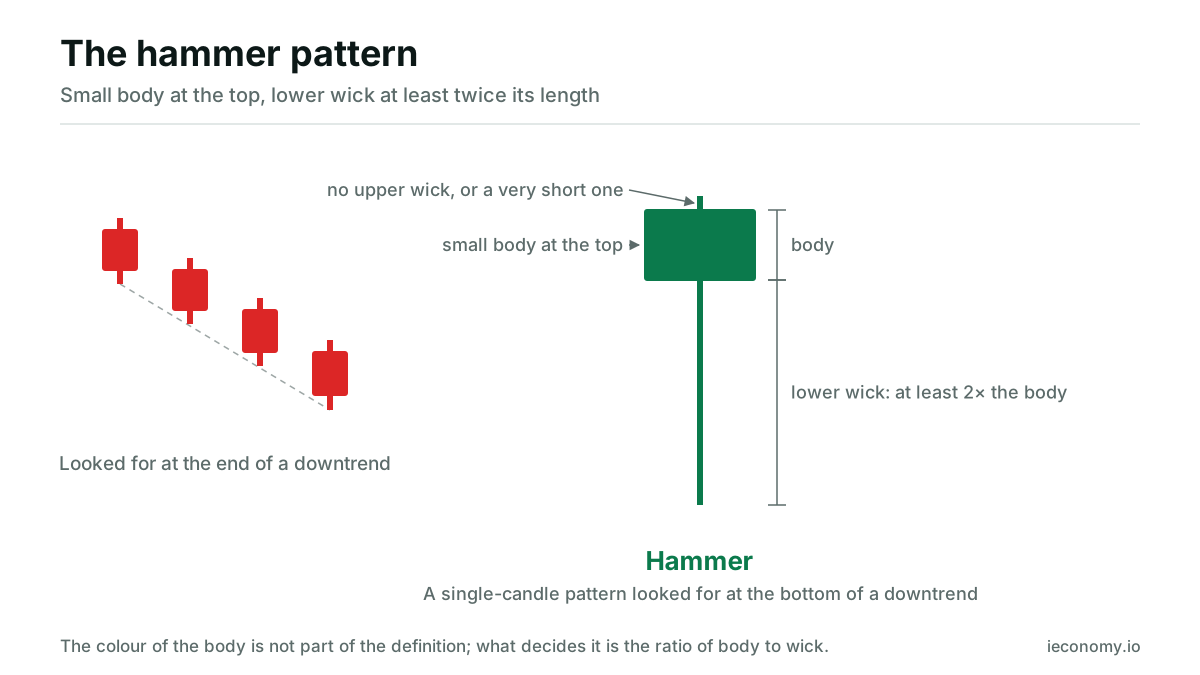
The color of the hammer’s body is not part of the definition; what matters is the ratio between the body and the lower shadow. Both the name and the meaning of the pattern depend on the trend in which it appears: when the same shape appears at the top of an uptrend, it is no longer called a hammer but a hanging man.
What is an inverted hammer pattern?
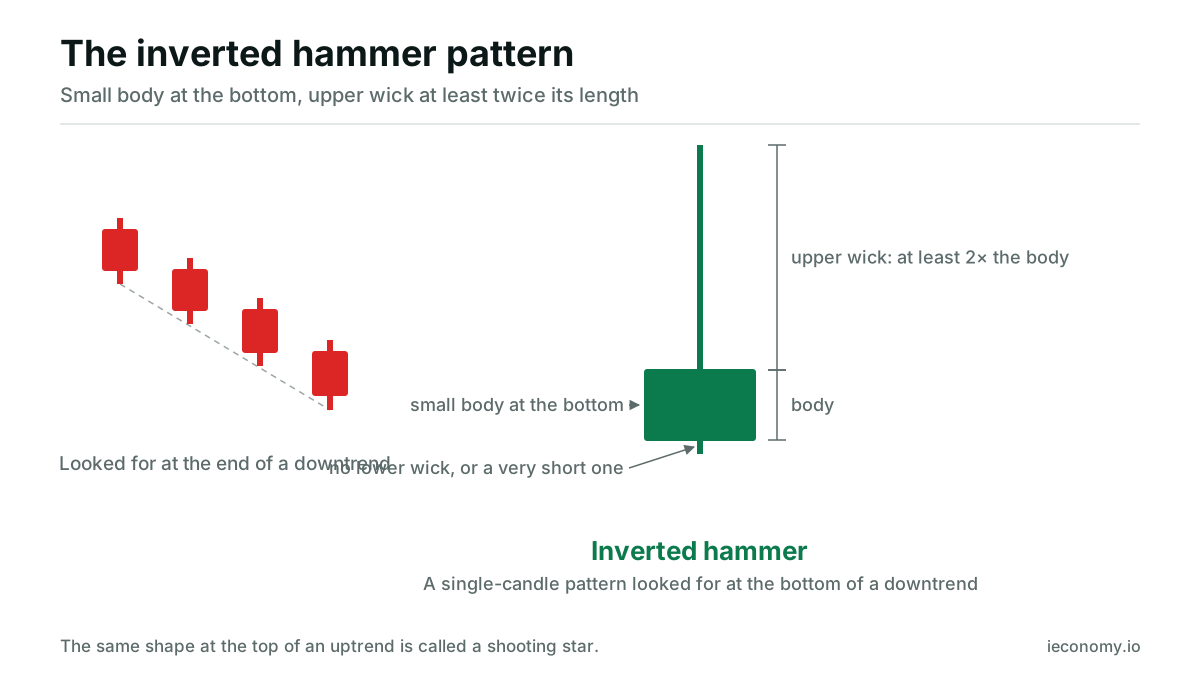
The inverted hammer is a single-candlestick formation with a small body at the lower end of the candle and no lower shadow, or a very short one; a common threshold is for the upper shadow to be at least twice the length of the body, while Nison describes a range of 2 to 3 times. It is looked for at the bottom of a downtrend. Price has been pushed up during the period, but the close has taken place near the opening level.
What is the hanging man pattern?
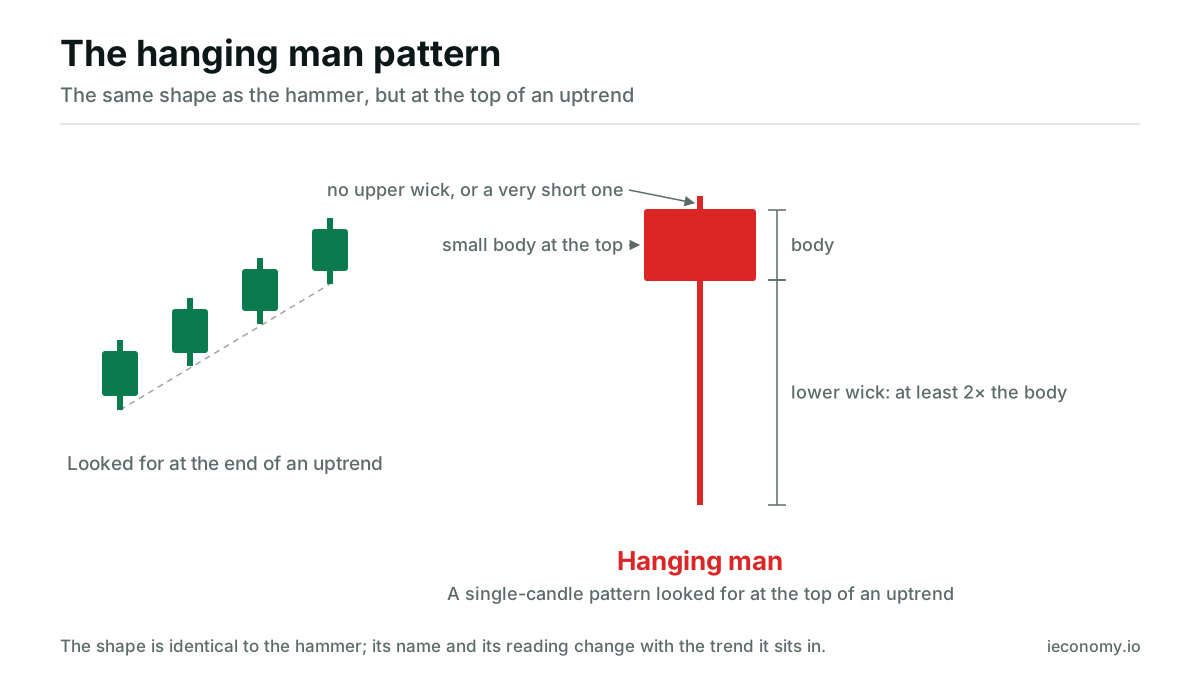
The hanging man is a candle with exactly the same shape as the hammer, that is, a small body at the top and a lower shadow at least twice the length of the body. The only difference is its location: it forms at the top of an uptrend. It shows that significant selling pressure was seen during the day in a rising market.
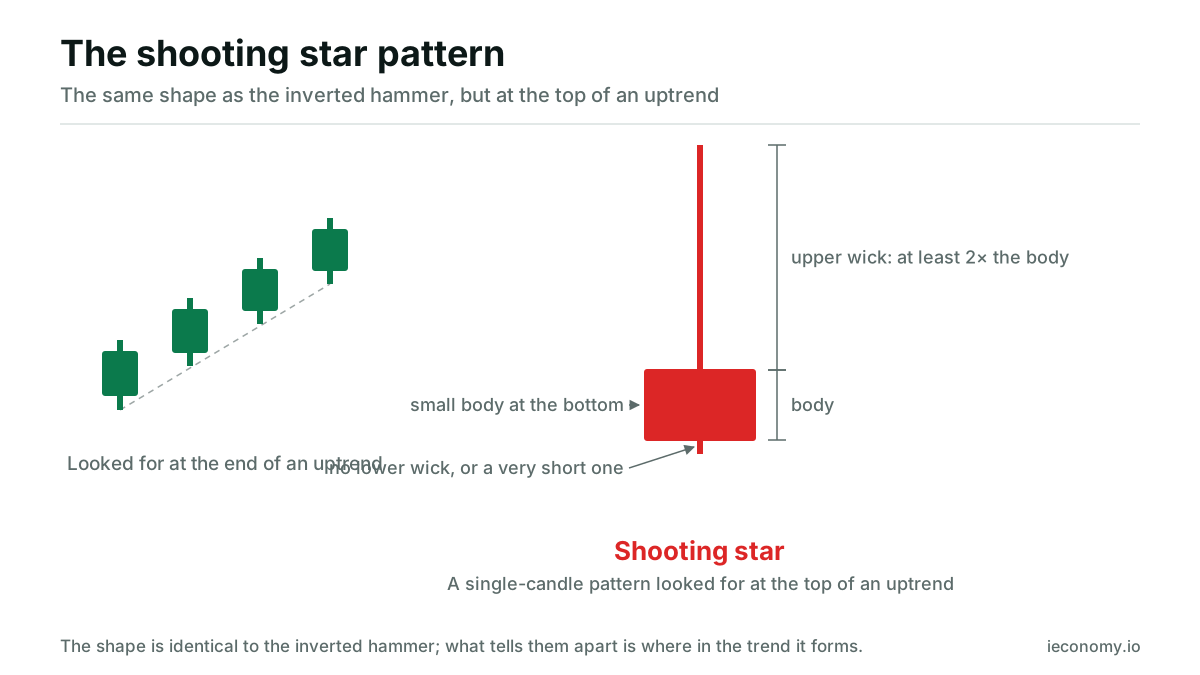
What is the shooting star pattern?
The shooting star is a candle with exactly the same shape as the inverted hammer, that is, a small body at the bottom and an upper shadow at least twice the length of the body. The only difference from the inverted hammer is that it forms at the top of an uptrend. Price has been pushed up, but most of the gains have been given back by the close.
What is a marubozu?
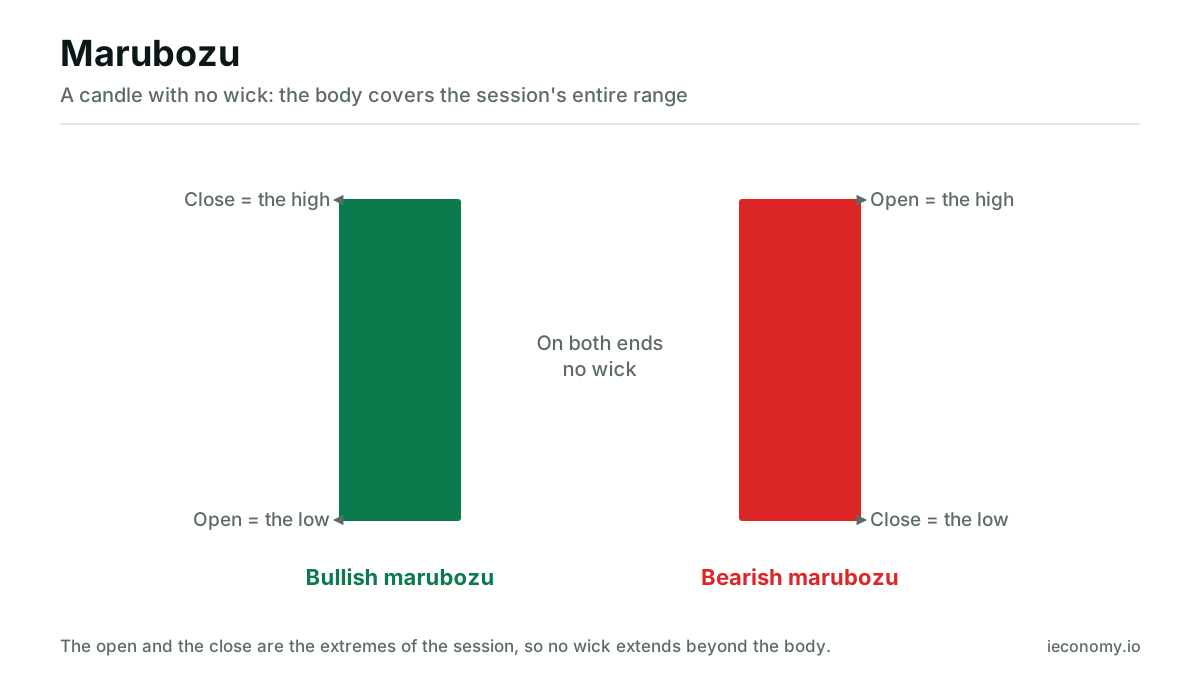
A marubozu is a candle with no shadow, whose body covers the entire trading range of the period. In an up marubozu, the open is at the low and the close is at the high; in a down marubozu, the opposite applies. It means that price moved in one direction from open to close and there was no pullback at the extremes.
What is a spinning top?
A spinning top is a candlestick whose defining feature is a small body; there are wicks on both sides of the body, but it is not necessary for these wicks to be longer than the body. Unlike a doji, the open and close do not coincide exactly; instead, there is a visible but narrow gap between them. It shows that price moved in both directions and closed without establishing a clear advantage.
What are two-candlestick patterns?
Two-candlestick patterns are read from the relative positions of the bodies of 2 consecutive candles. Bullish engulfing, bearish engulfing, piercing pattern, dark cloud cover, harami and tweezers belong to this group. What matters is that the second candle covers the body of the first candle, remains inside it, or retraces a certain proportion of the body.
What is a bullish engulfing pattern?
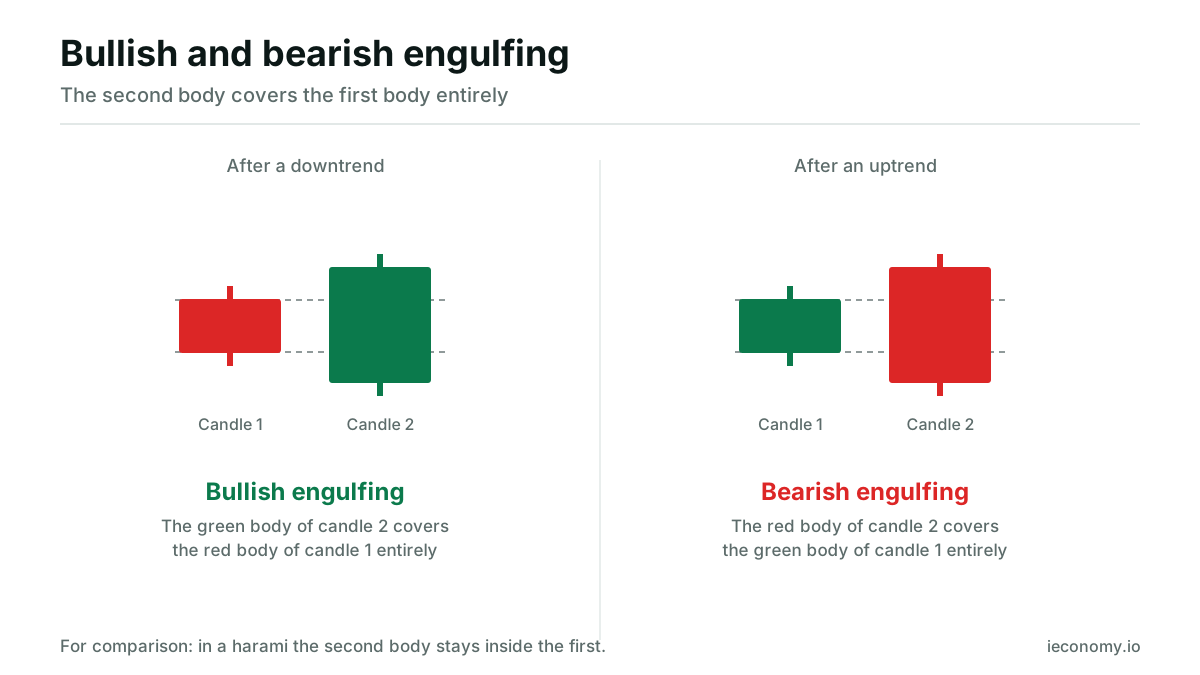
A bullish engulfing pattern is a two-candlestick formation that follows a downtrend and in which the green body of the second candle completely covers the red body of the first candle. The second candle opens below the first candle’s close and closes above the first candle’s open. It shows a reversal in direction over a short period.
What is a bearish engulfing pattern?
A bearish engulfing pattern is a two-candlestick formation that follows an uptrend and in which the red body of the second candle completely covers the green body of the first candle. The engulfing condition is sought for the bodies; covering the wicks as well is not required by the classical definition. It shows buyers handing over their advantage to sellers in a single period.
What is a piercing pattern (piercing line)?
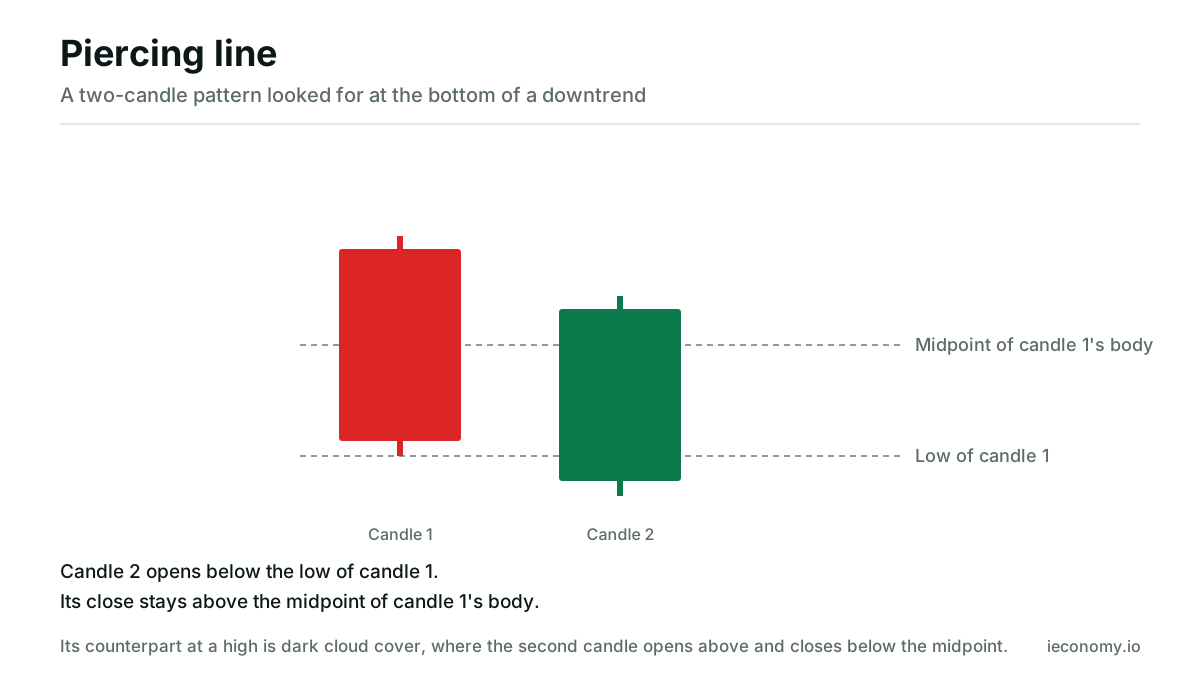
The piercing pattern is sought at the bottom of a downtrend and is a two-candlestick formation in which the first candle has a long red body and the second candle is green. In the classic definition, the second candle opens below the low of the first candle, but closes above the midpoint of the first candle’s body and below its opening.
What is the dark cloud cover?
Dark cloud cover is a two-candlestick formation sought at the top of an uptrend and in which the first candle has a long green body and the second candle is red. In the classic definition, the second candle opens above the high of the first candle, but closes below the midpoint of the first candle’s body. It is the top-of-the-chart counterpart to the piercing pattern.
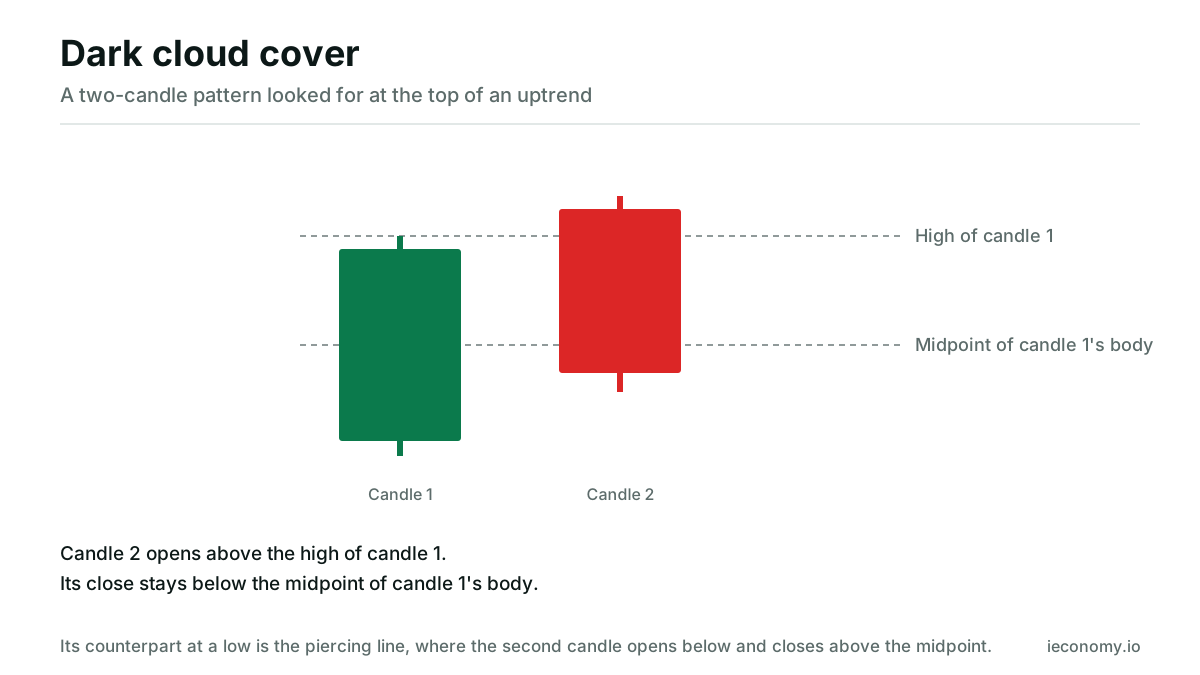
The classic definition of these two formations requires the second candle to open beyond the extreme of the previous candle. Some sources relax this condition and consider opening beyond the previous close sufficient. Because gaps are difficult to form in continuously traded markets, the strict definition rarely occurs exactly as such in 24-hour markets such as forex.
What is the harami pattern?
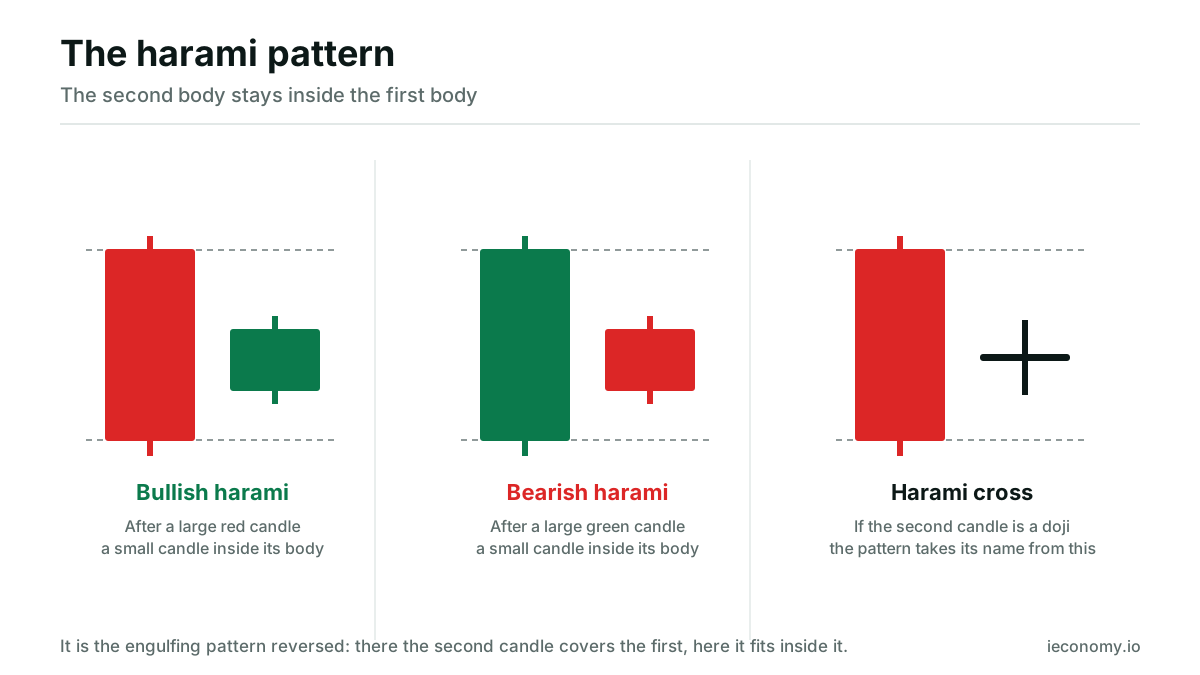
The harami pattern is a two-candlestick formation in which the small body of the second candle remains entirely within the large body of the first candle. It is the exact opposite of the engulfing pattern: there the second candle covers the first, here it fits inside it. It is a pause pattern showing that momentum has stalled after a strong move.
What is a harami cross?
A harami cross is a special form of the harami pattern in which the second candle is a doji. The small-bodied candle is replaced by a doji, where the open and close coincide, and this doji still remains within the body of the first candle. It creates a clearer picture of indecision, where the pause is more pronounced.
What are tweezer tops and tweezer bottoms?
A tweezer top is when 2 consecutive candles make almost the same high; a tweezer bottom is when these 2 candles make almost the same low. Because the pattern shows price reversing twice from the same level, it is directly linked to the reading of support and resistance.
What are three-candle candlestick patterns?
Three-candle patterns are formations made up of 3 consecutive candles. Morning star, evening star, three white soldiers, three black crows, along with three inside and three outside, belong to this group. The third candle often carries separate weight because it is the candle that confirms or overturns the story told by the first 2 candles.
What is the morning star pattern?
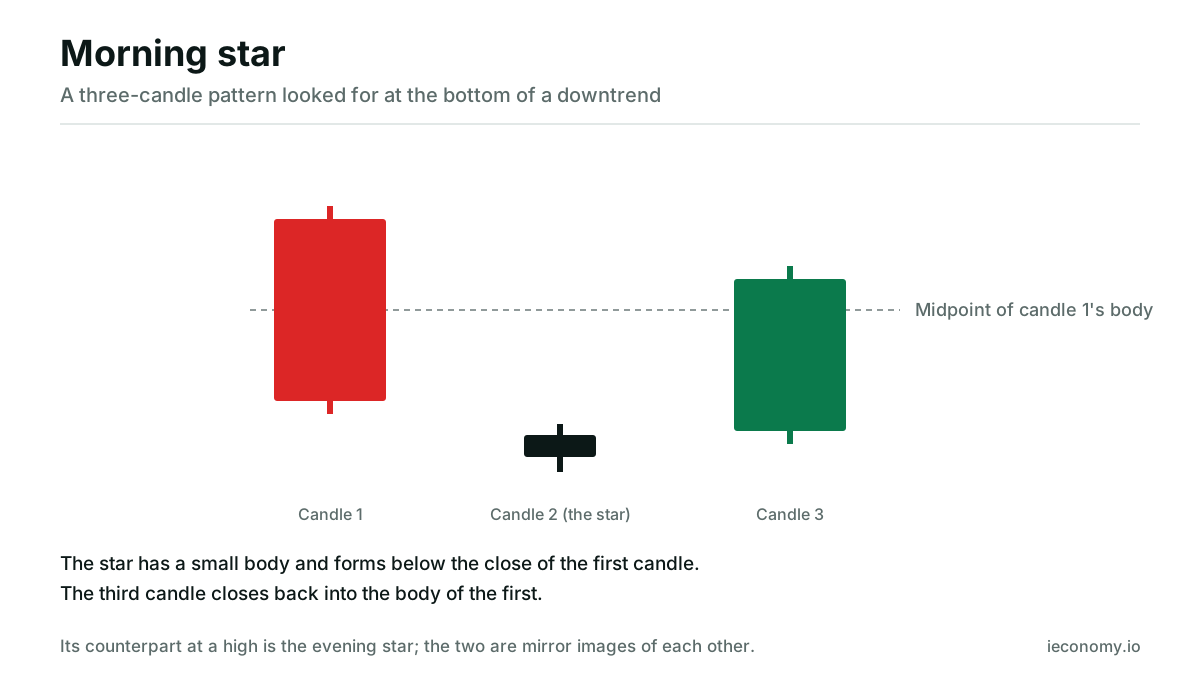
The morning star is a three-candle pattern sought at the bottom of a downtrend. The first candle has a long body and is red. The second candle has a small body and forms below the close of the first candle. The third candle is green, and its close moves into the body of the first candle, up to above the midpoint of the body.
What is the evening star pattern?
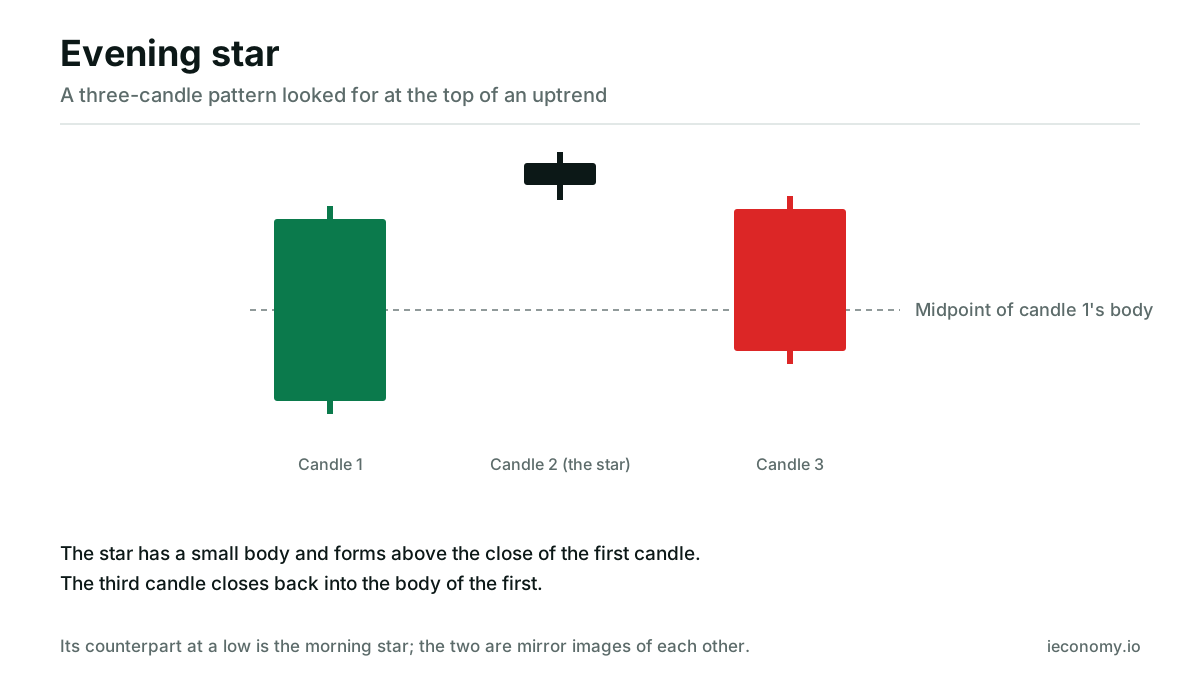
The evening star is a three-candle pattern sought at the top of an uptrend. The first candle has a long body and is green. The second candle has a small body and forms above the close of the first candle. The third candle is red, and its close falls below the midpoint of the body of the first candle. It is the mirror image of the morning star.
What is Three White Soldiers?
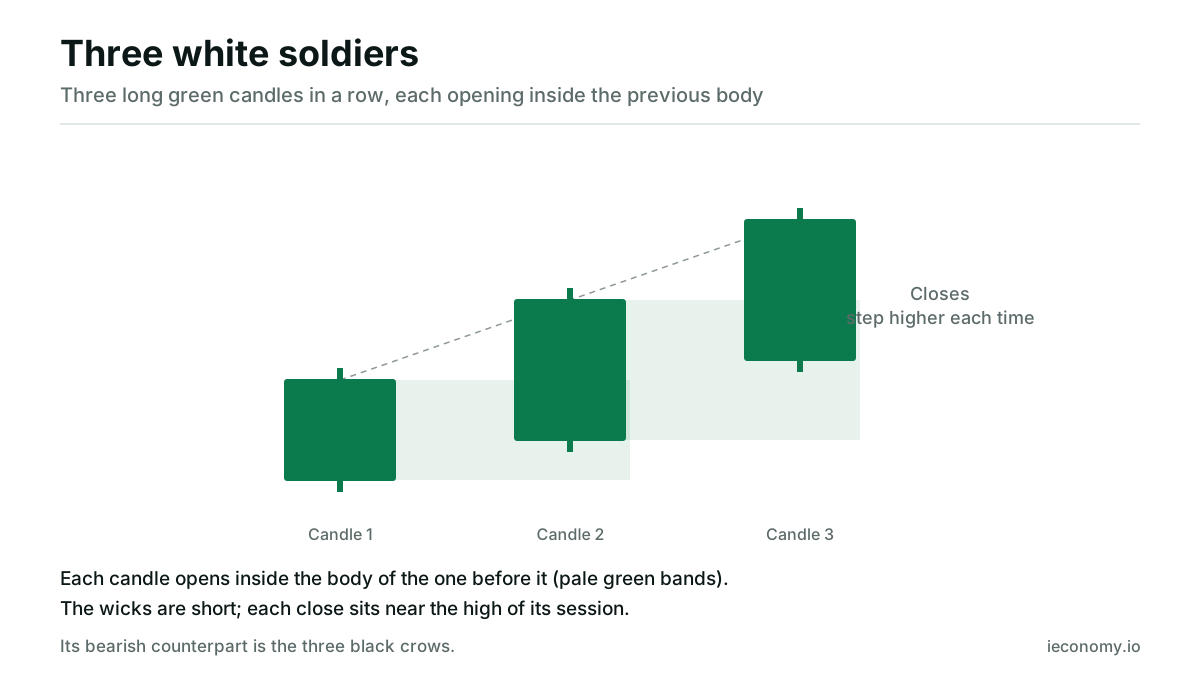
Three White Soldiers is a formation consisting of 3 consecutive long-bodied green candlesticks. Each candle opens within the body of the previous candle and closes higher than it. The wicks are short, meaning the closes occur near the period’s high, and buying pressure continues uninterrupted for 3 periods.
What is Three Black Crows?
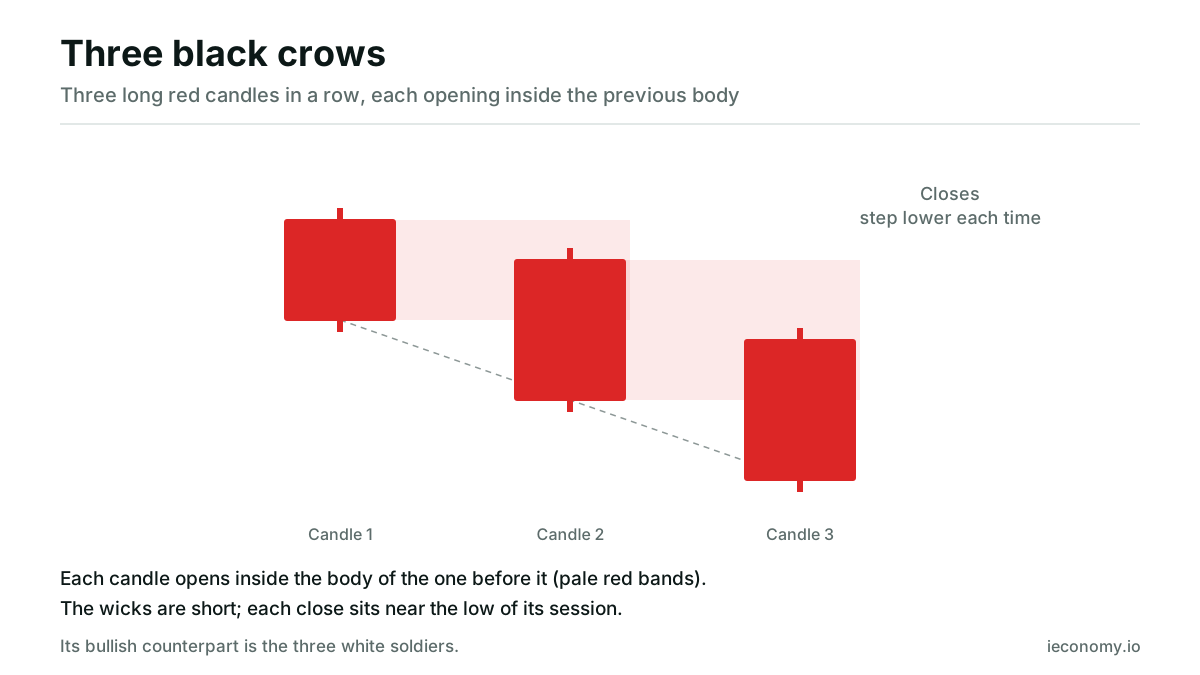
Three Black Crows is a formation consisting of 3 consecutive long-bodied red candlesticks. Each candle opens within the body of the previous candle and closes lower than it. Short wicks show that the closes occur near the period’s low and that selling pressure continues uninterrupted.
What are Three Inside and Three Outside?
Three Inside is the three-candle confirmation version of the pregnant pattern; Three Outside is the three-candle confirmation version of the engulfing pattern. In both sequences, the third candle closes in the direction indicated by the first 2 candles and completes the pattern. They are therefore examples where the idea of confirmation is embedded in the pattern name.
Why does the same shape get different names at the top and bottom of a trend?
In candlestick patterns, the shape alone is not enough; where the pattern forms within the trend changes its name and interpretation. A small-bodied candlestick with a long lower wick is called a hammer at the bottom of a downtrend and a hanging man at the top of an uptrend. The same distinction also applies between an inverted hammer and a shooting star.
The reason is that the story told by the pattern changes with context. A long lower wick says that price was sold during the period and then bought back. In a market that has been falling for a long time, this behavior signals that sellers are getting tired; in a market that has been rising for a long time, it signals the first serious wave of selling. That is why the trend is identified before looking for the pattern: the first question answered is whether the direction is a bull market or a bear market.
What does confirmation mean in candlestick patterns?
Confirmation means that the direction indicated by a pattern is supported by data outside the pattern itself. There are 3 common sources of confirmation: the candle following the pattern closing in the same direction, trading volume increasing noticeably on the pattern candle, and the pattern forming at a technically meaningful level. A pattern read without confirmation rests on a single shape.
The close of the next candle is the most direct confirmation: a candle that follows a hammer and closes higher shows that the reversal described by the pattern is continuing. Volume shows participation behind the move; a pattern formed in a thinly traded asset may be misleading because of low liquidity. Level confirmation means that the pattern forms at a support and resistance area, at a prior bottom or top, or above a moving average.
Another tool often used for confirmation is momentum indicators. For example, if divergence between a price and an indicator such as RSI points in the same direction as the loss of momentum described by the pattern, the reading is strengthened. Confirmation never creates certainty; it only reduces the fragility of an interpretation based on a single shape.
What are the most common mistakes in candlestick patterns?
The most common mistake is reading the pattern outside its trend context. Four mistakes follow from this: treating every small-bodied candle as a pattern, interpreting noise on very short time frames as if it were a pattern, defining the pattern before the close is complete, and building expectations on unverified success rates circulating on the internet.
There is no pattern before the candle closes. During the day, a candle that looks like a hammer can expand its body by the close and turn into a completely different shape. Likewise, the definition of a pattern is structural: for a hammer, the lower wick must be at least 2 times the body; calling a candle a hammer when it does not meet that ratio is reading your own expectation, not the pattern.
Unverified statistics are a separate issue. A percentage circulating online about candlestick pattern success rates is meaningless unless it states which market, which timeframe, which definition, how many observations, and which exit rule were used to measure it. The same pattern behaves differently across assets, timeframes, and volatility conditions; a single ratio cannot represent all of these variables.
What are the limitations of candlestick patterns?
Candlestick patterns describe past price action; they do not provide any guarantee about the future. Their limitations can be grouped under three headings: a pattern looks only at price data and does not see factors such as news, earnings, or interest-rate decisions; definitions can vary from source to source; and patterns that require gaps do not form with the same frequency in every market.
The gap issue is especially important. In the classic definition of the morning star and evening star, the star candle must be separated from the previous candle by a gap; this gap is sought between the bodies, and the wicks may overlap. While gaps between sessions are common in equity markets, this condition often does not occur in continuously traded markets. This difference between session-based markets such as VIOP and the stock market, and continuous markets, changes how often the same pattern appears.
Candlestick charting is a price-display method of Japanese origin, and it became widespread in Western markets with Steve Nison’s 1991 book Japanese Candlestick Charting Techniques. Most of the pattern names used today are based on this tradition; however, the fact that a definition is old and established does not, by itself, mean it provides a measurable edge.
This content is for educational purposes and is not investment advice. Patterns do not say that an asset should be bought or sold; they only describe how price behaved over a certain timeframe.
Frequently asked questions
The most common questions about candlestick patterns fall into three areas: how reliable the patterns are, how to distinguish shapes that look similar, and which timeframe should be used. The 7 headings below answer these questions, based solely on the structural definitions of the patterns, without resorting to unverified success rates.
Do candlestick patterns really work?
Candlestick patterns are interpretive tools used to read price action; on their own, they do not guarantee an outcome. How meaningful a pattern is depends on the trend in which it forms, the timeframe, volume, and the level. For this reason, patterns are generally assessed together with confirmation, not on their own.
Which candlestick pattern is the most reliable?
There is no sourceable, universally valid ranking of reliability. Success-rate lists circulating online usually do not state in which market or with which definition they were measured. The difference between patterns is not a reliability percentage, but how many candles they consist of and how strict a structural condition they require.
What does a doji candle mean?
A doji indicates a period in which the open and close are the same, or nearly the same, and therefore buyers and sellers are in balance. By itself, it does not indicate direction. Its meaning depends on the length of its wicks and on whether the doji forms within a trend or in a sideways area.
What is the difference between a hammer and a hanging man?
There is no difference in shape: in both, the small body is at the top, and the lower wick is at least 2 times the length of the body. The only difference is position. If the same shape forms at the bottom of a downtrend, it is called a hammer; if it forms at the top of an uptrend, it is called a hanging man, and the story it tells changes accordingly.
What is the difference between a hammer and a shooting star?
These two patterns both have small bodies and long upper wicks; the body sits in the lower part of the candlestick, and their shapes are exactly identical. The hammer forms at the bottom of a downtrend, while the shooting star forms at the top of an uptrend. What determines the name of the pattern is not the candlestick itself, but the direction of the price movement beforehand.
What is the difference between a bullish engulfing pattern and a harami?
Both consist of 2 candlesticks, but the position of the bodies relative to each other is reversed. In a bullish engulfing pattern, the body of the second candlestick completely covers the body of the first candlestick. In a harami, the body of the second candlestick remains inside the body of the first candlestick. One describes a change in direction, the other a pause in the move.
On which time frame are candlestick patterns considered?
Patterns can form in every period, but the scale of the event they describe changes according to the period. A hammer on a monthly chart does not describe an event of the same size as a hammer on a 5-minute chart. Because noise increases on shorter periods, pattern-like shapes appear much more frequently.
iEconomy Academy
This article is a lesson in: Reading a chart · Lesson 1/4
Related News

What Is Compound Interest? Why Starting Early Can Matter More Than the Rate
Compound interest is when your returns start earning returns of their own. Starting early can beat a higher rate — we show the exact math with a worked example.

Stock Market Hours and Holidays: NYSE and Nasdaq Guide
A clear reference to regular U.S. stock market hours, pre-market and after-hours trading, early closes, holiday closures, and how bond-market holidays differ.

How to Cash In Savings Bonds: Electronic and Paper
Learn how to redeem U.S. savings bonds through TreasuryDirect or a bank, when penalties apply, how partial redemptions work, and what to do with inherited or lost bonds.
What Is an Indicator? Technical Analysis Indicator Types
What is an indicator, what types exist, and how are they used? We explain what RSI, MACD, moving averages, and volume tools actually measure.
Technical Analysis What is MACD and How to Interpret it?
MACD, one of the most frequently used technical analysis indicators, stands for Moving Average Convergence Divergence.

What is Alpacadabraz NFT?
Alpacadabraz, an NFT project that started in October 2021 with the genesis collection, is one of the collections linked to smart contracts.