S&P 500 falls 1.52% to 7,316.15 on Wednesday
The S&P 500 ended Wednesday lower at 7,316.15, with six of eight tracked constituents declining. Energy outperformed while technology lagged, leaving the session narrowly negative in breadth but clearly weak in the headline index.
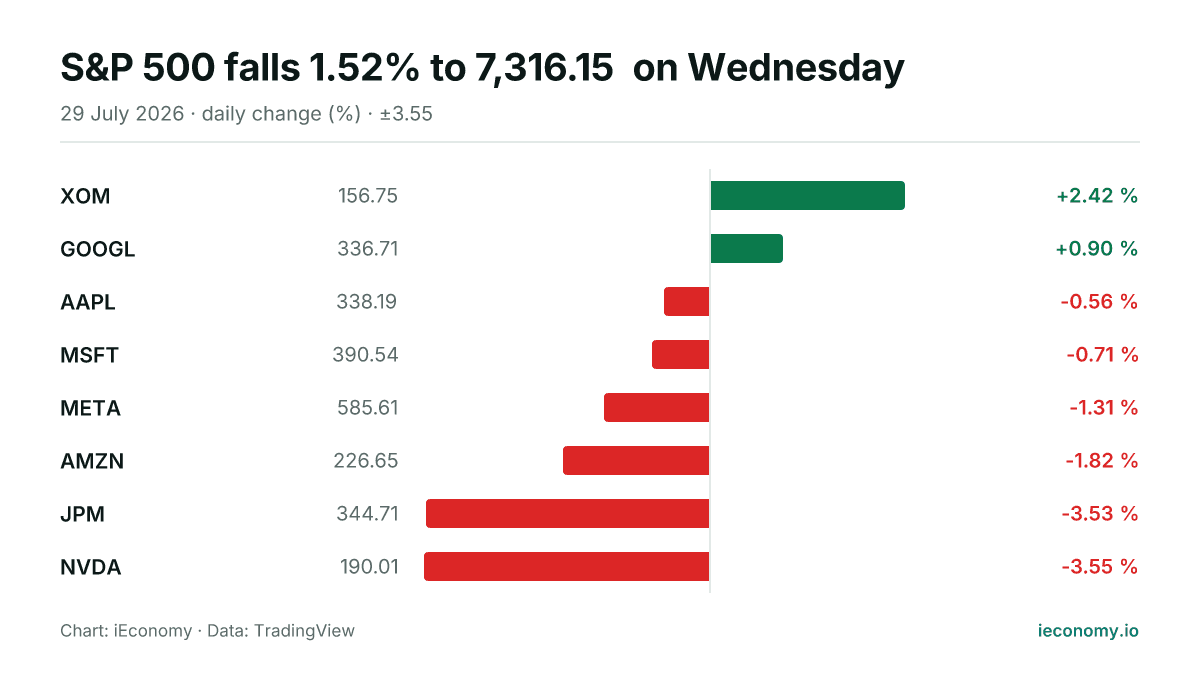
Chart: iEconomy · Data: TradingView
Wednesday’s session left the S&P 500 at 7,316.15, down 1.52% on the day. The move was not broad enough to suggest uniform selling across everything, but the balance was still negative: six of the eight tracked constituents finished lower, while only two rose.
Index move and breadth
The index’s decline reflected a session in which losers clearly outnumbered gainers among the tracked names. That kind of setup matters because a falling headline index with weak breadth usually points to pressure concentrated in more influential components, even if some areas remain resilient. In practical terms, the session was one of net risk reduction rather than a selective rotation into all parts of the market.
| Stock | Last | Change |
|---|---|---|
| XOM | 156.75 | +2.42 % |
| GOOGL | 336.71 | +0.90 % |
| AAPL | 338.19 | -0.56 % |
| MSFT | 390.54 | -0.71 % |
| META | 585.61 | -1.31 % |
| AMZN | 226.65 | -1.82 % |
| JPM | 344.71 | -3.53 % |
| NVDA | 190.01 | -3.55 % |
Standout performers
Among the tracked constituents, XOM was the strongest performer, rising 2.42% to 156.75. At the other end, NVDA was the weakest, falling 3.55% to 190.01. The spread between the best and worst performers underlines how uneven the day was, with energy showing relative strength while a major technology name weighed on the tone.
What long-term investors should take from it
For long-term investors, a single session mainly offers information about mechanics, not a durable signal. Index-level moves can be driven by a small number of large constituents, so a down day does not automatically mean the entire market is deteriorating in a lasting way. What matters more is whether weakness is persistent across sessions, whether breadth keeps narrowing, and whether leadership keeps shifting. One day of trading can still be relevant for positioning and risk control, but it should be treated as a snapshot rather than a conclusion.
Sources
Related News
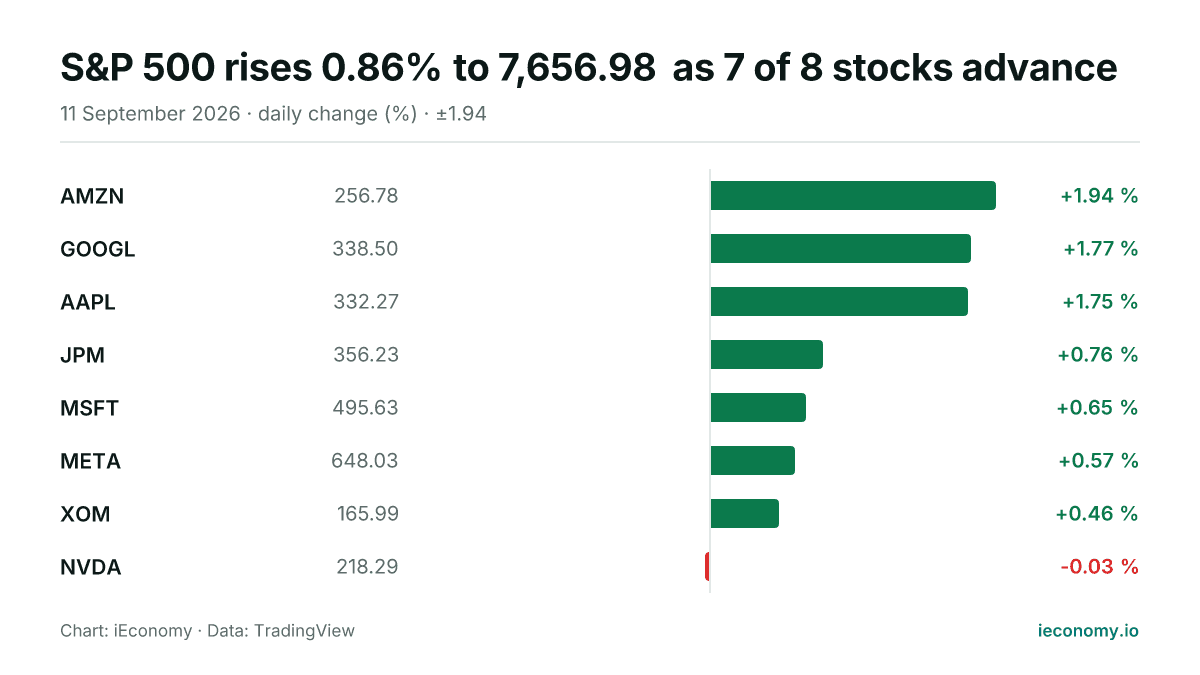
S&P 500 rises 0.86% to 7,656.98 as 7 of 8 stocks advance
The S&P 500 finished higher on Friday, with a broad majority of the tracked constituents in positive territory. AMZN led the group, while NVDA was the only decliner among the eight names monitored.
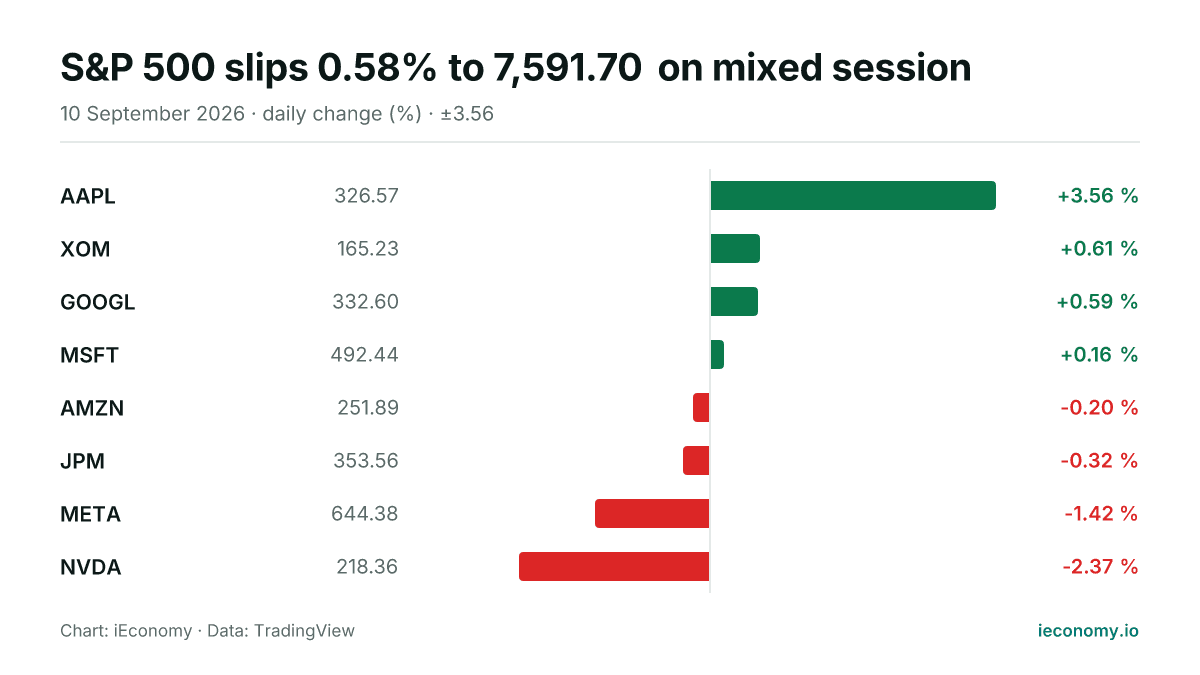
S&P 500 slips 0.58% to 7,591.70 on mixed session
The S&P 500 ended Thursday lower at 7,591.70, with a narrow split among the eight tracked constituents showing four gainers and four decliners. Apple was the strongest performer, while Nvidia was the weakest.
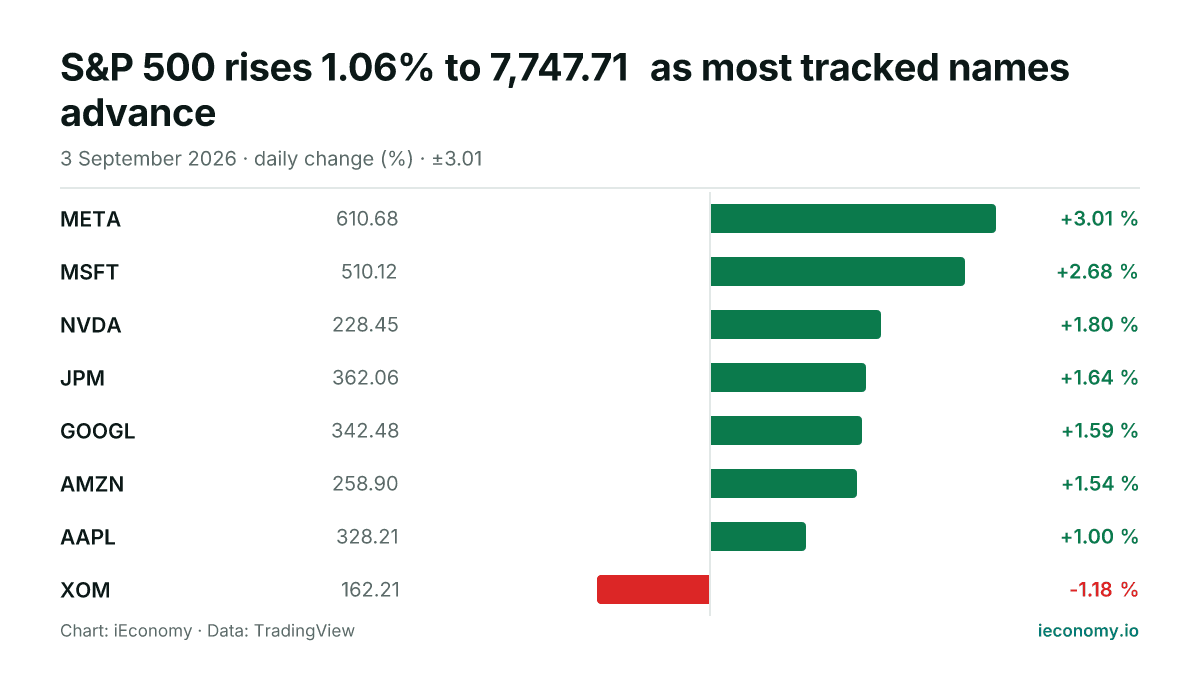
S&P 500 rises 1.06% to 7,747.71 as most tracked names advance
The S&P 500 finished Thursday higher, with 7 of 8 tracked constituents in positive territory. META was the strongest performer, while XOM was the only decliner among the names tracked in the digest.
S&P 500 slips 0.69% as breadth stays mixed
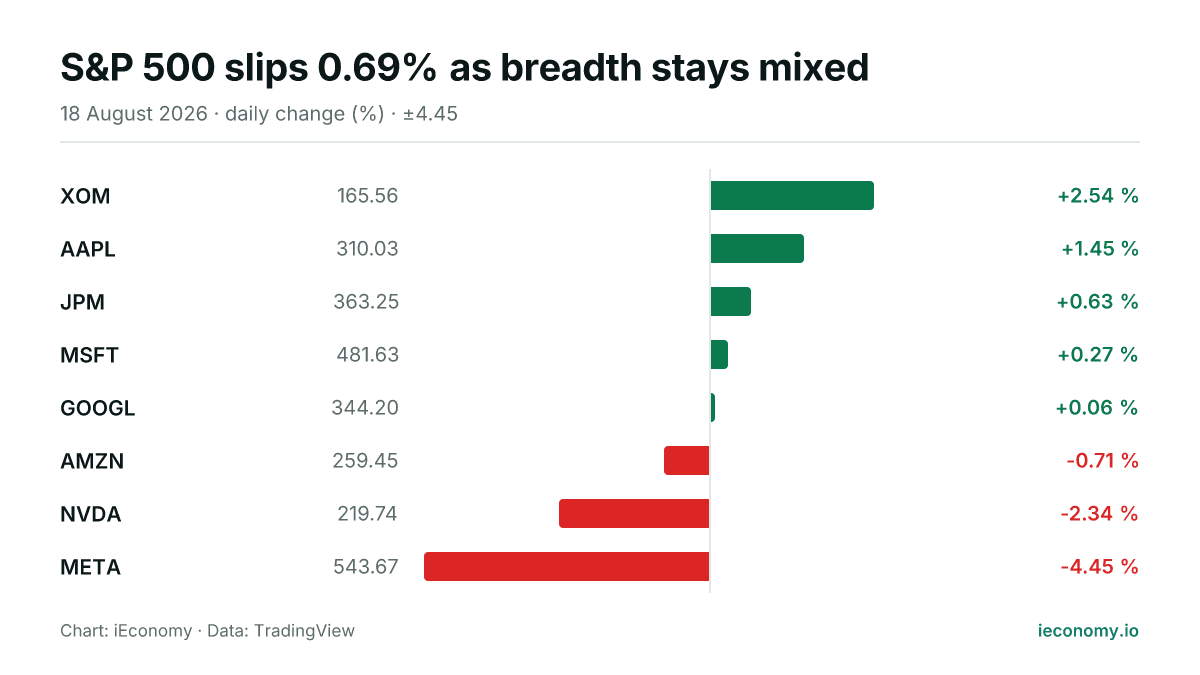
The S&P 500 finished Tuesday at 7,691.76, down 0.69% on the session. Among the eight tracked constituents, five advanced and three declined, with XOM the strongest and META the weakest.
S&P 500 edges lower as most tracked names rise
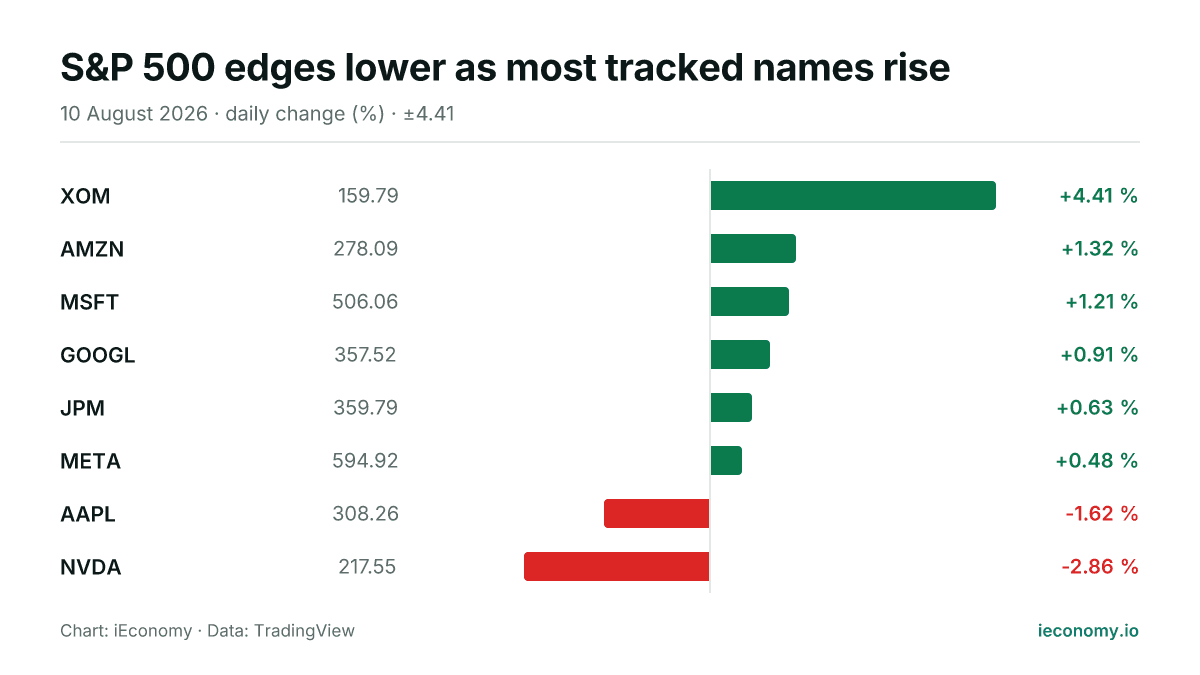
The S&P 500 closed at 7,753.11 on Monday, down 0.06% as six of the eight tracked constituents finished higher. XOM was the strongest performer, while NVDA was the weakest.
Asia and Europe firm as US indices ease
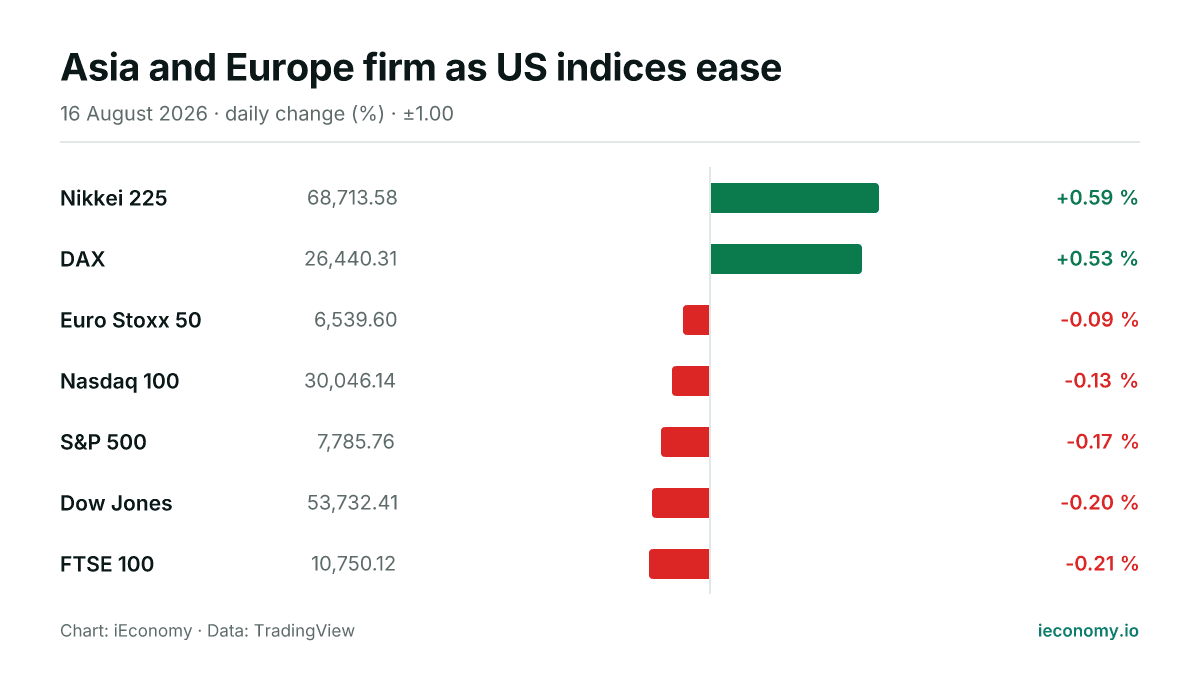
Japanese and German equities led a mixed global session, while US benchmarks slipped modestly. The day left seven tracked markets split between small gains and broad-but-shallow declines.