S&P 500 slips 0.58% to 7,591.70 on mixed session
The S&P 500 ended Thursday lower at 7,591.70, with a narrow split among the eight tracked constituents showing four gainers and four decliners. Apple was the strongest performer, while Nvidia was the weakest.
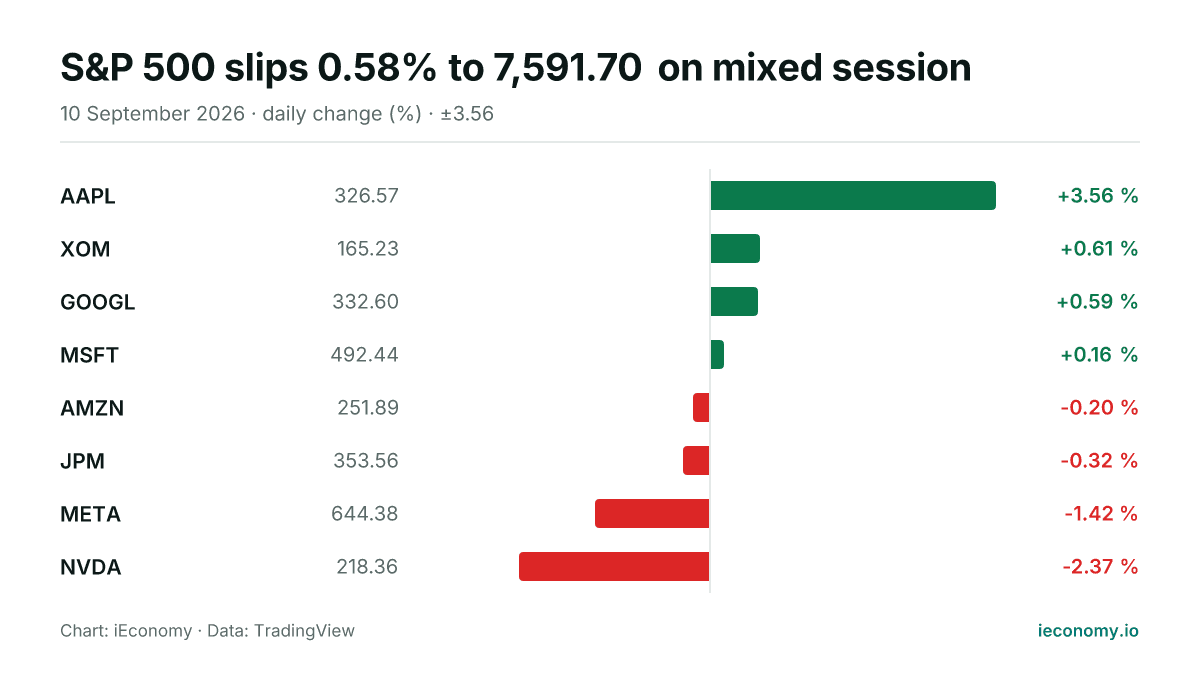
Chart: iEconomy · Data: TradingView
The S&P 500 finished Thursday at 7,591.70, down 0.58% on the day. The move was modest in percentage terms, but the breadth picture was evenly split, with four of the eight tracked constituents higher and four lower.
How the index moved and how broad it was
The index spent the session under pressure and closed lower, indicating a mildly negative tone rather than a disorderly selloff. With only eight constituents tracked in the digest, the split was balanced, so the headline decline came from enough weakness in the heavier contributors to outweigh the gains.
That kind of session matters mechanically because an index can fall even when a substantial share of names rises. What counts is the combined weighted move, not simply the count of advancers versus decliners.
| Stock | Last | Change |
|---|---|---|
| AAPL | 326.57 | +3.56 % |
| XOM | 165.23 | +0.61 % |
| GOOGL | 332.60 | +0.59 % |
| MSFT | 492.44 | +0.16 % |
| AMZN | 251.89 | -0.20 % |
| JPM | 353.56 | -0.32 % |
| META | 644.38 | -1.42 % |
| NVDA | 218.36 | -2.37 % |
Standout individual performers
Apple was the strongest performer among the names tracked, rising 3.56% to 326.57. Nvidia was the weakest, falling 2.37% to 218.36.
Those moves show how a single large stock can influence sentiment around the broader benchmark even when the index itself is only moderately lower. A sharp advance in one heavyweight does not necessarily offset weakness elsewhere if the index weights and price moves do not line up in the same direction.
What a long-term investor should take from one session
A single day like this is mainly a reminder that index-level performance is an aggregation of many different stock-level moves. The balance between winners and losers can look even while the weighted result still points down.
For long-term investors, the useful takeaway is to separate short-term noise from portfolio mechanics. Daily swings are part of market behaviour, and one session by itself does not define the underlying trend.
Sources
Related News
S&P 500 rises 1.06% to 7,747.71 as most tracked names advance
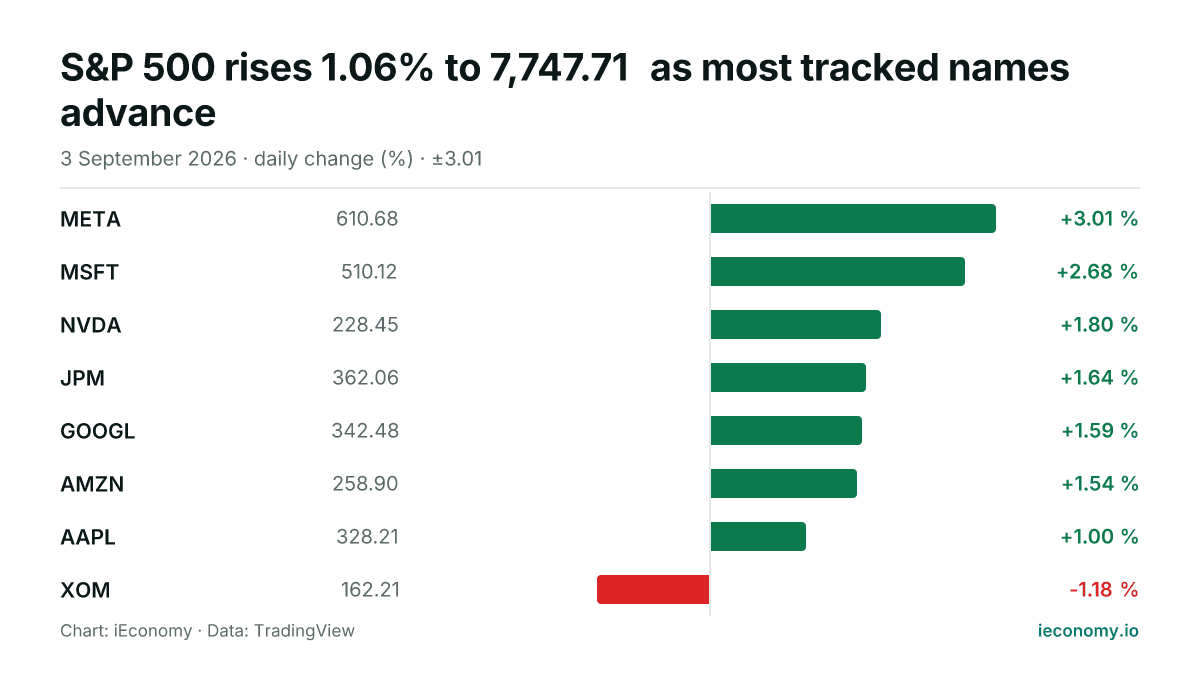
The S&P 500 finished Thursday higher, with 7 of 8 tracked constituents in positive territory. META was the strongest performer, while XOM was the only decliner among the names tracked in the digest.
S&P 500 slips 0.33% as most tracked names fall
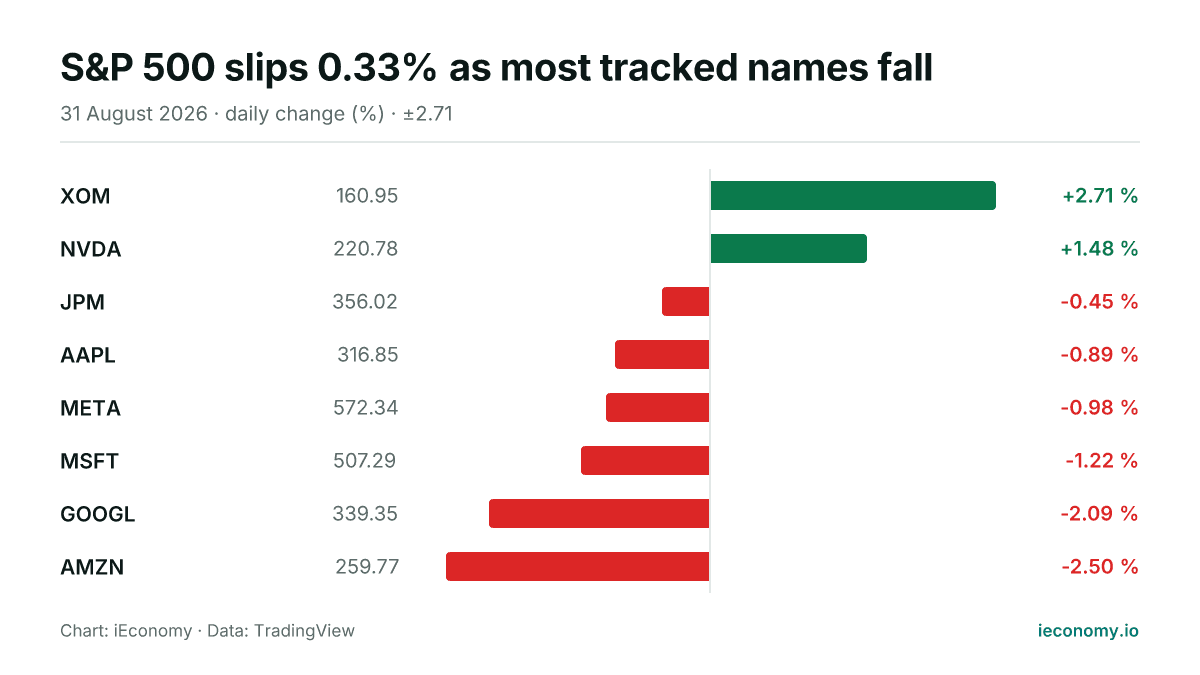
The S&P 500 ended Monday at 7,686.14, down 0.33% on the session. In the small set of tracked constituents, six fell and two rose, with Exxon Mobil the strongest and Amazon the weakest.
S&P 500 slips 0.48% to 7,636.36 in mixed trade
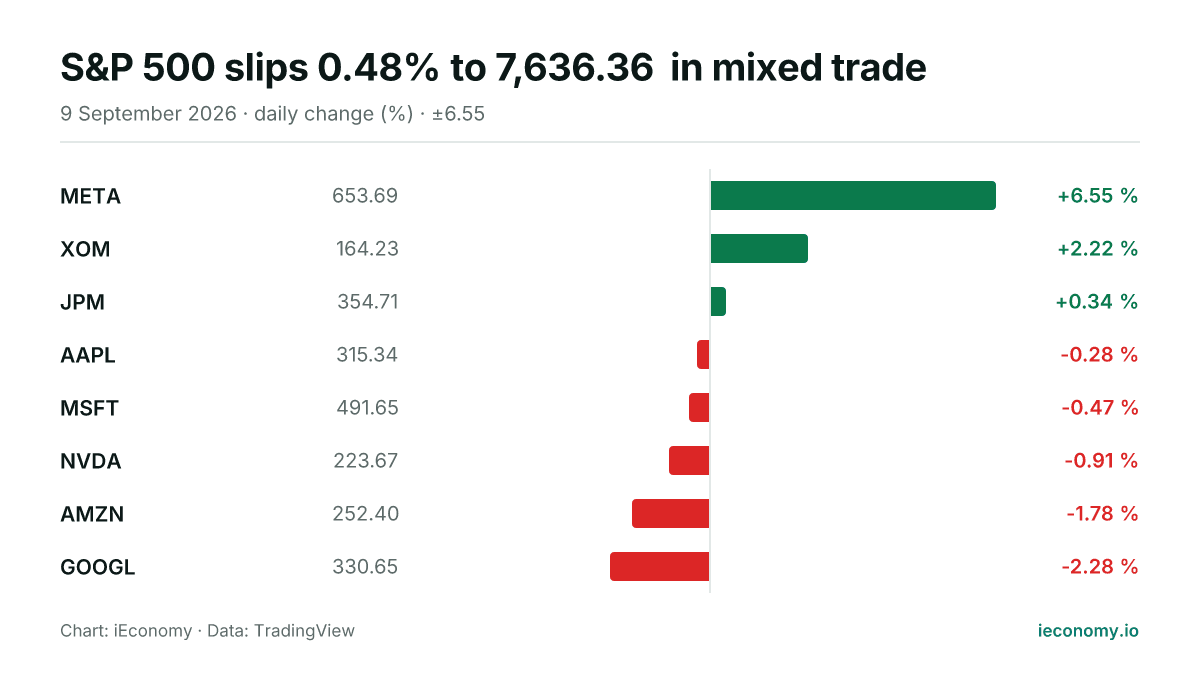
The S&P 500 ended the Wednesday, 2026-09-09 session lower, with 3 of 8 tracked constituents advancing and 5 declining. META was the best performer, while GOOGL was the weakest.
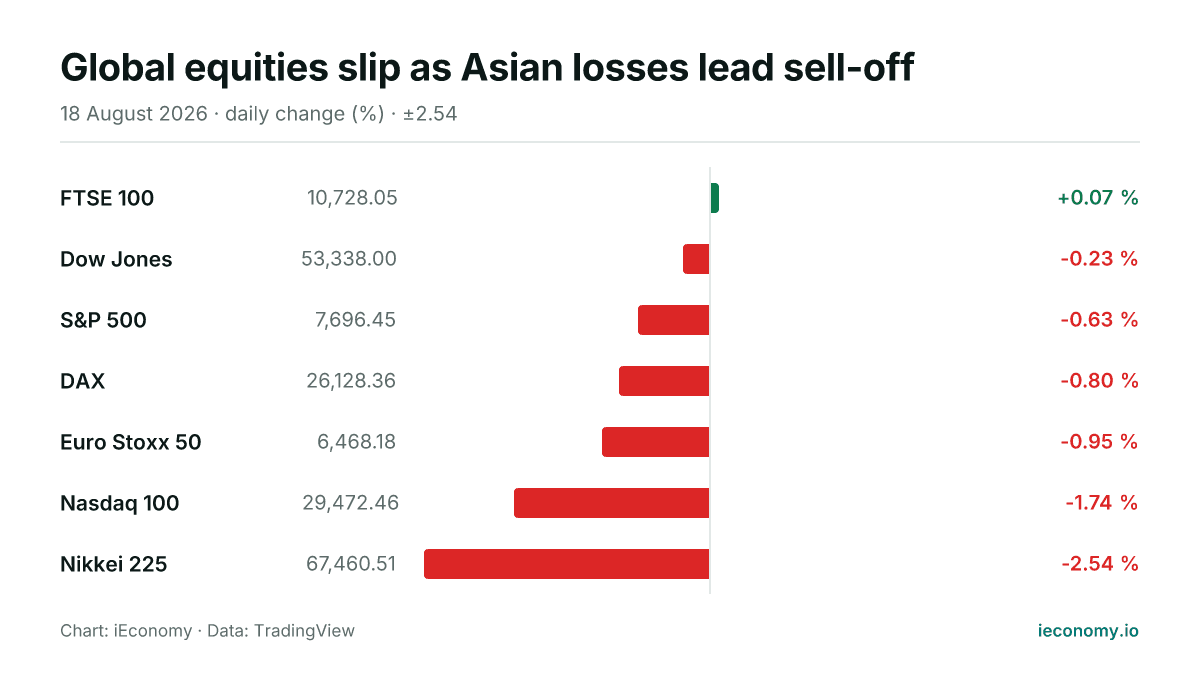
Global equities slip as Asian losses lead sell-off
US shares eased, Europe traded lower and Tokyo fell sharply, leaving only the FTSE 100 modestly higher in a broad but uneven equity retreat on Tuesday.
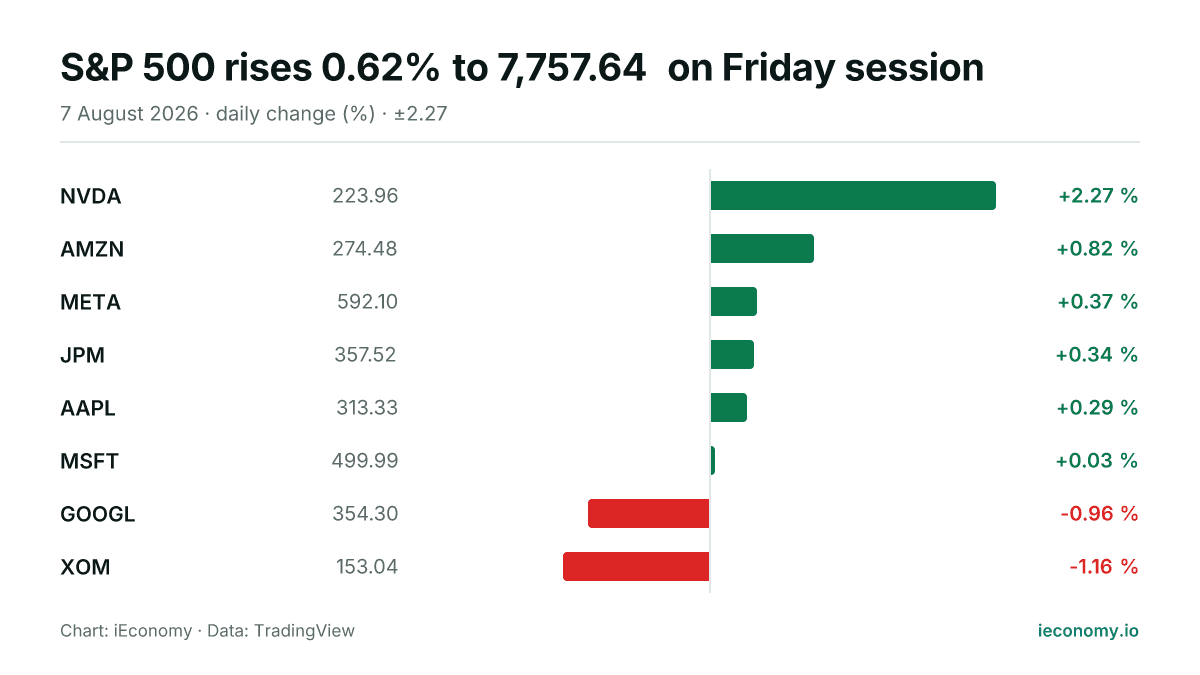
S&P 500 rises 0.62% to 7,757.64 on Friday session
The S&P 500 finished higher on Friday, with 6 of the 8 tracked constituents advancing. Nvidia led the gainers, while Exxon Mobil was the weakest name in the sample.
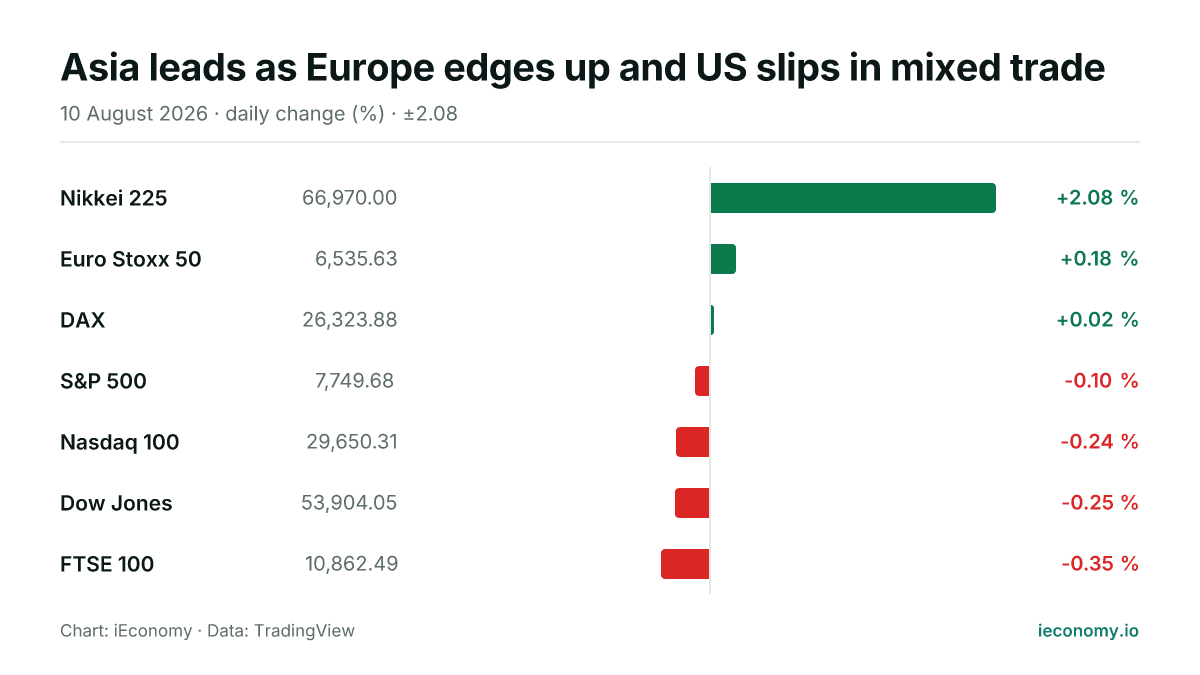
Asia leads as Europe edges up and US slips in mixed trade
Asian equities outperformed on Monday, led by a sharp rise in Tokyo, while Europe was broadly firmer and US benchmarks eased. The moves were modest in most cases, but they left the day’s tone mixed across regions.