S&P 500 slips 0.25% as most tracked names rise
The S&P 500 finished Friday at 7,711.76, down 0.25% on the day. Breadth was positive among the tracked constituents, but a sharp fall in NVDA offset gains elsewhere.
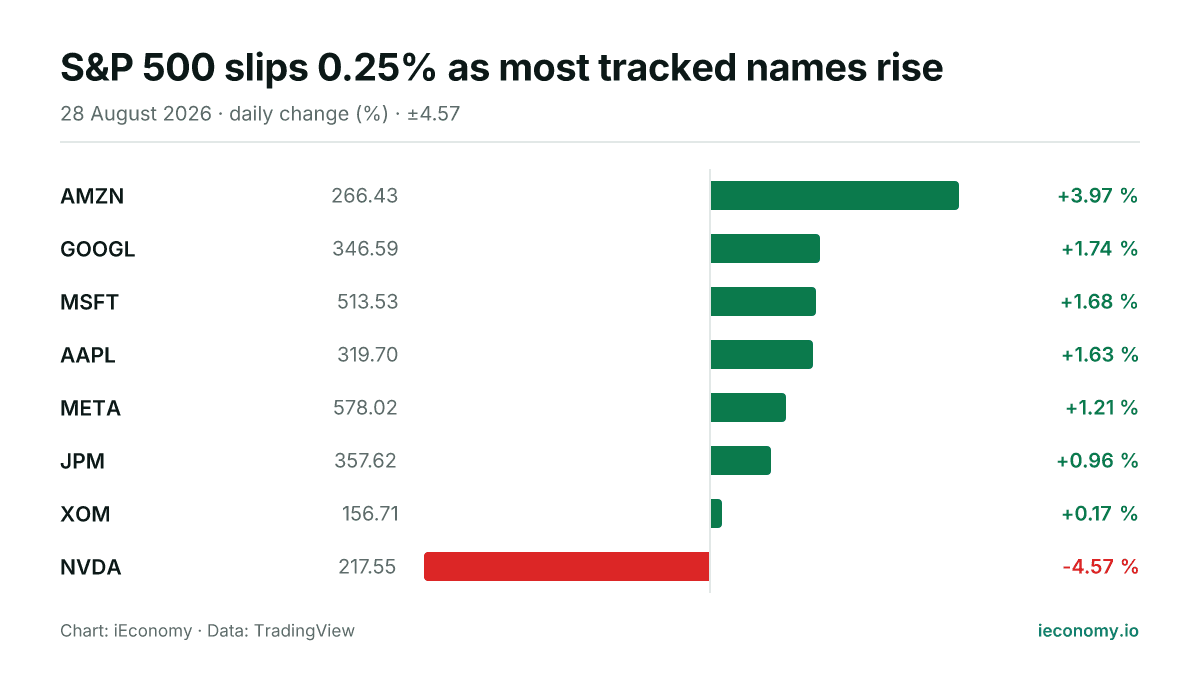
Chart: iEconomy · Data: TradingView
The S&P 500 ended Friday at 7,711.76, down 0.25% on the day. The move was modest, but it showed how a small number of large swings can outweigh broader gains across tracked constituents.
Index drifted lower despite positive breadth
Among the eight tracked constituents, seven finished higher and one closed lower. That breadth points to a generally firm session underneath the index headline, even though the benchmark itself still edged down.
| Stock | Last | Change |
|---|---|---|
| AMZN | 266.43 | +3.97 % |
| GOOGL | 346.59 | +1.74 % |
| MSFT | 513.53 | +1.68 % |
| AAPL | 319.70 | +1.63 % |
| META | 578.02 | +1.21 % |
| JPM | 357.62 | +0.96 % |
| XOM | 156.71 | +0.17 % |
| NVDA | 217.55 | -4.57 % |
The mechanics matter: when one large constituent falls enough, it can more than offset several smaller advances. That is especially true in a market benchmark dominated by heavyweight stocks.
Amazon led; Nvidia was the clear laggard
AMZN was the strongest performer, rising 3.97% to 266.43. At the other end, NVDA fell 4.57% to 217.55, making it the main drag on the group.
With only eight names tracked here, the dispersion between the best and weakest performers was wide. That gap helps explain why an index can decline even when most constituents are advancing.
What long-term investors should take from one session
One day’s move rarely changes the long-term case for an index. For investors with a longer horizon, the more useful signal is how price action is distributed: broad participation is generally healthier than a narrow advance, even if the headline index is slightly lower.
This session also underlines concentration risk. When a benchmark is influenced by a small set of major names, short-term outcomes can be driven by individual stock swings rather than a clean read on the overall market.
That does not by itself improve or weaken the longer-term outlook. It simply shows that single-session moves are often more about index mechanics and weighting than about a broad verdict on the market.
Sources
Related News
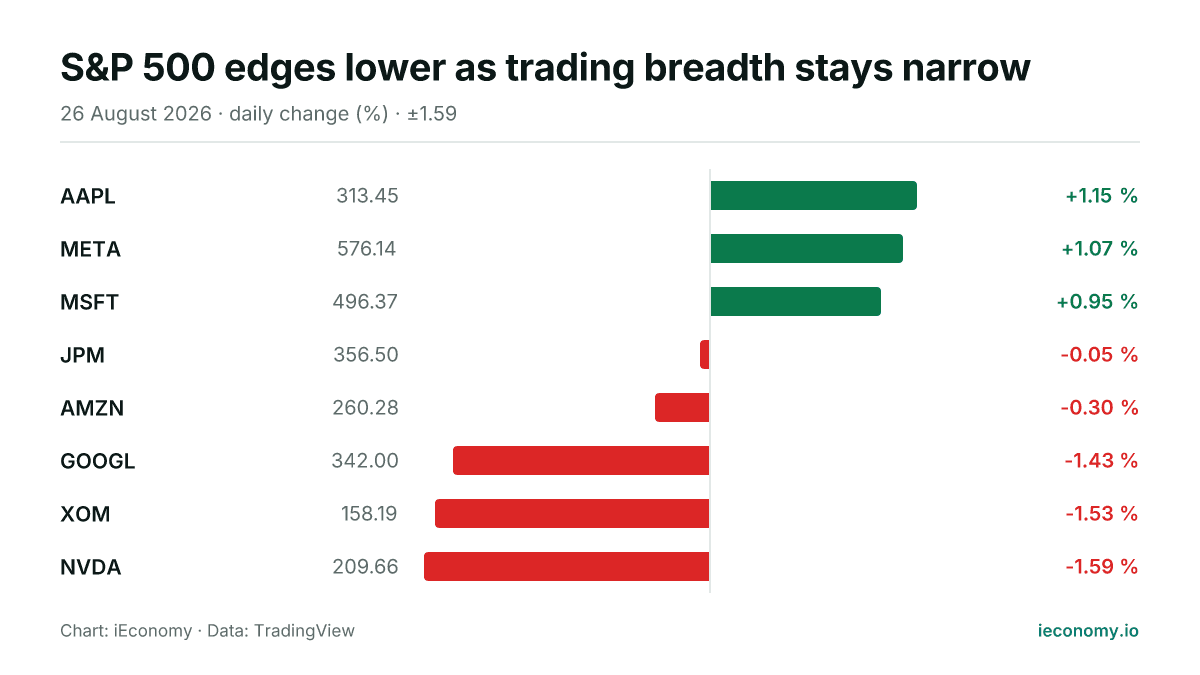
S&P 500 edges lower as trading breadth stays narrow
The S&P 500 ended Wednesday at 7,675.70, down 0.02% as five of the eight tracked constituents fell and three rose. Apple was the strongest performer, while Nvidia was the weakest.
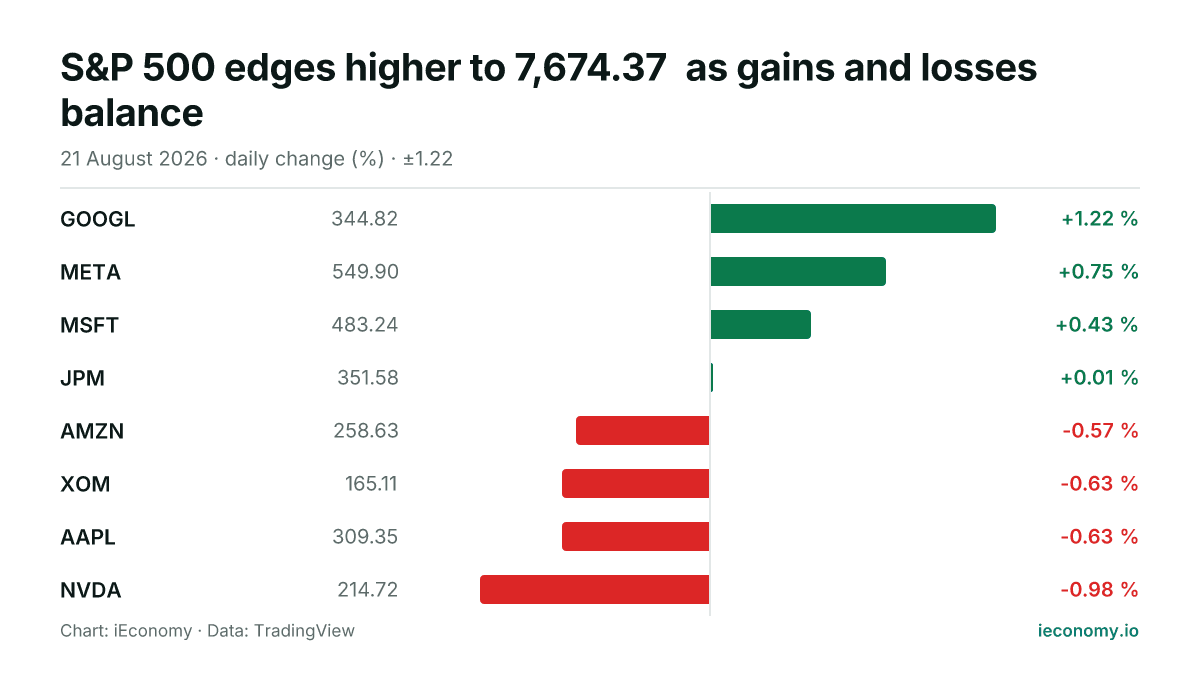
S&P 500 edges higher to 7,674.37 as gains and losses balance
The S&P 500 rose 0.43% to 7,674.37 on Friday. Among the eight tracked constituents, four finished higher and four lower, with GOOGL the strongest and NVDA the weakest.
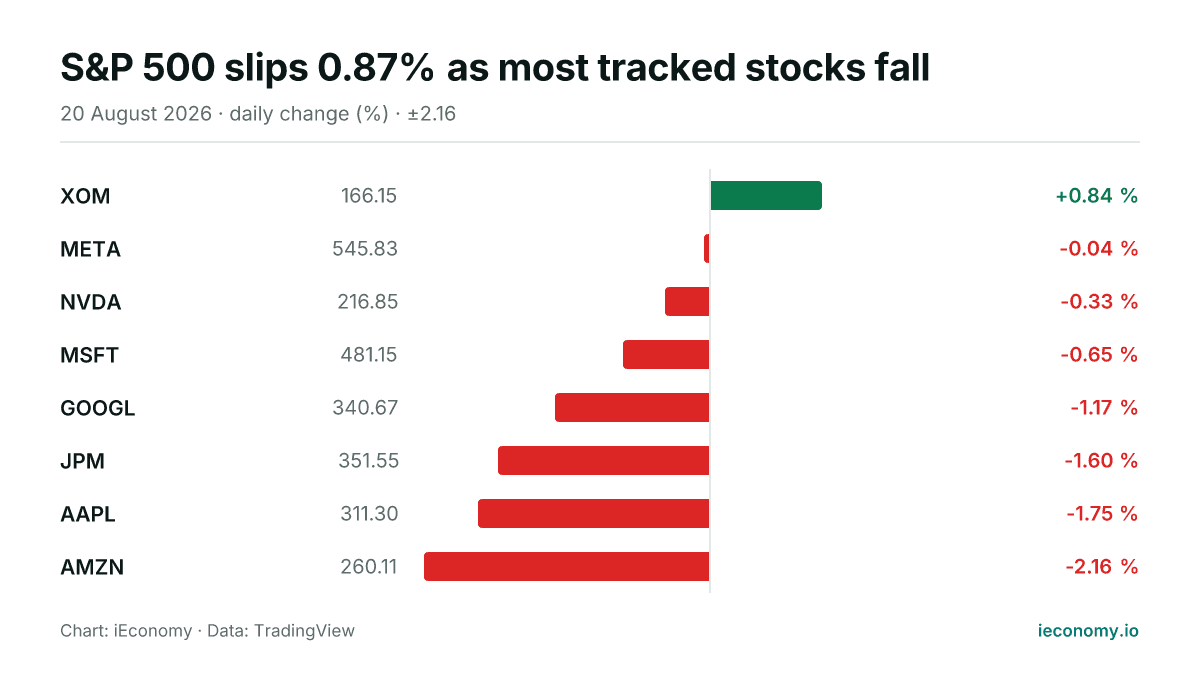
S&P 500 slips 0.87% as most tracked stocks fall
The S&P 500 ended Thursday at 7,641.16, down 0.87% on the session. Among the eight tracked constituents, one finished higher and seven were lower, with AMZN the weakest and XOM the strongest.
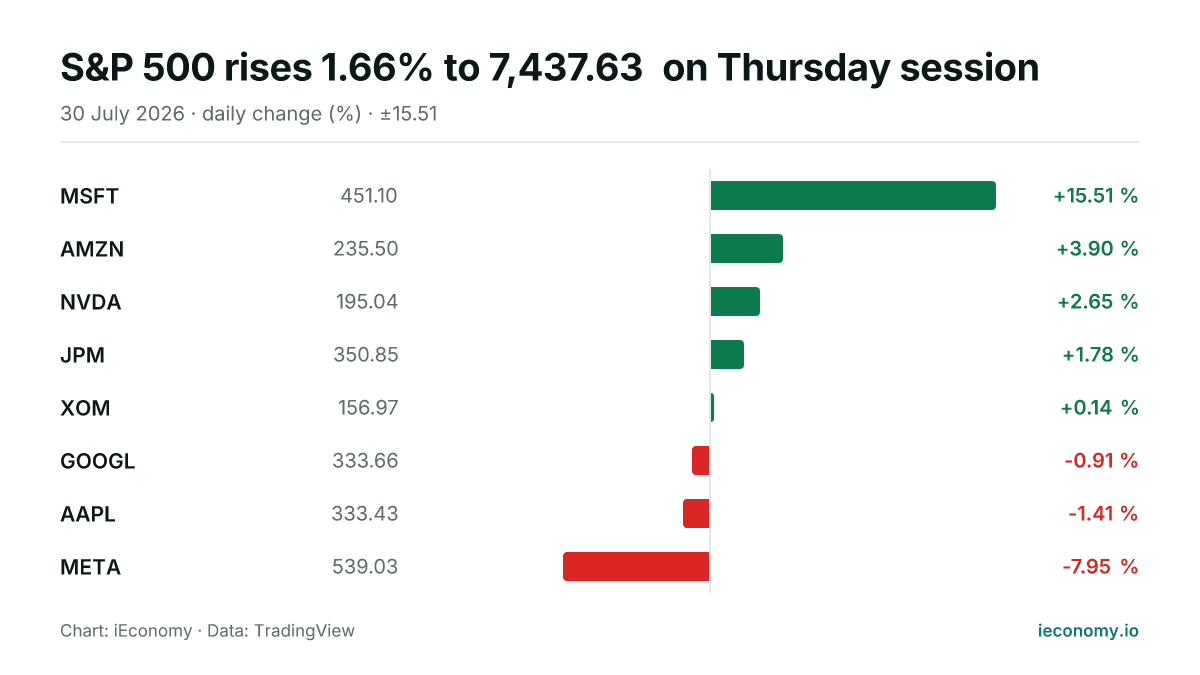
S&P 500 rises 1.66% to 7,437.63 on Thursday session
The S&P 500 finished Thursday at 7,437.63, up 1.66%, with five of eight tracked constituents advancing. MSFT was the strongest performer, while META was the weakest.
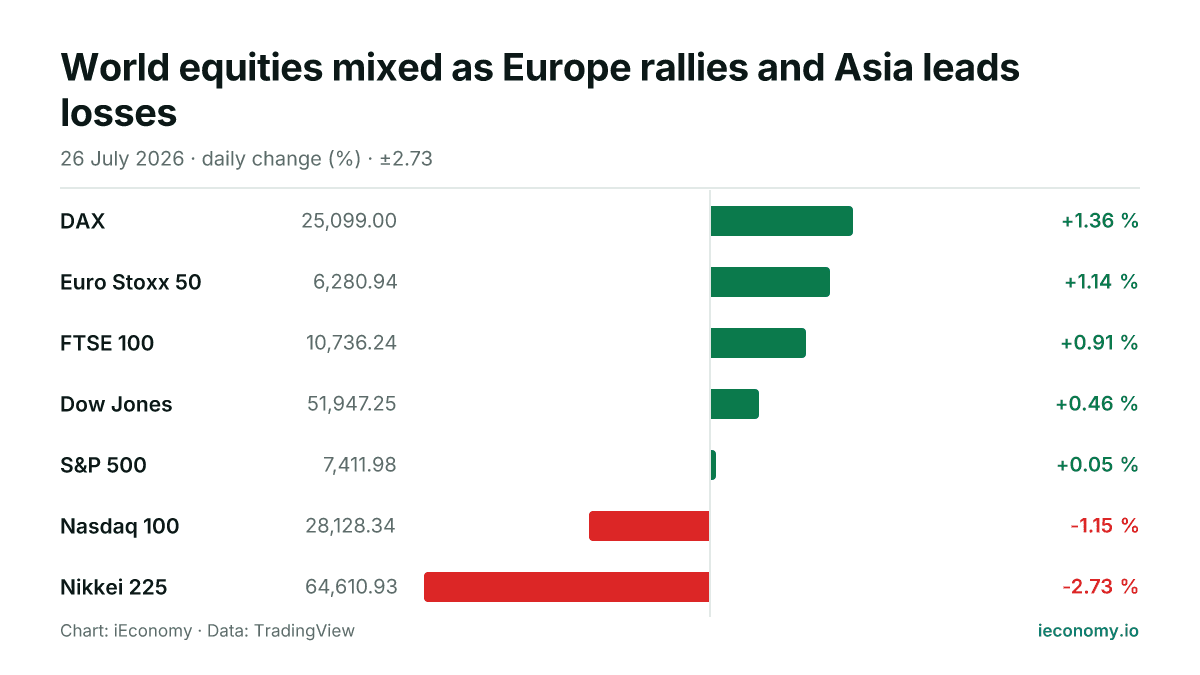
World equities mixed as Europe rallies and Asia leads losses
European benchmarks advanced while US indexes were broadly firmer and Asia finished lower, with the Nasdaq 100 and Nikkei 225 lagging. The day left 5 of 7 tracked indices higher, but the dispersion was wide.
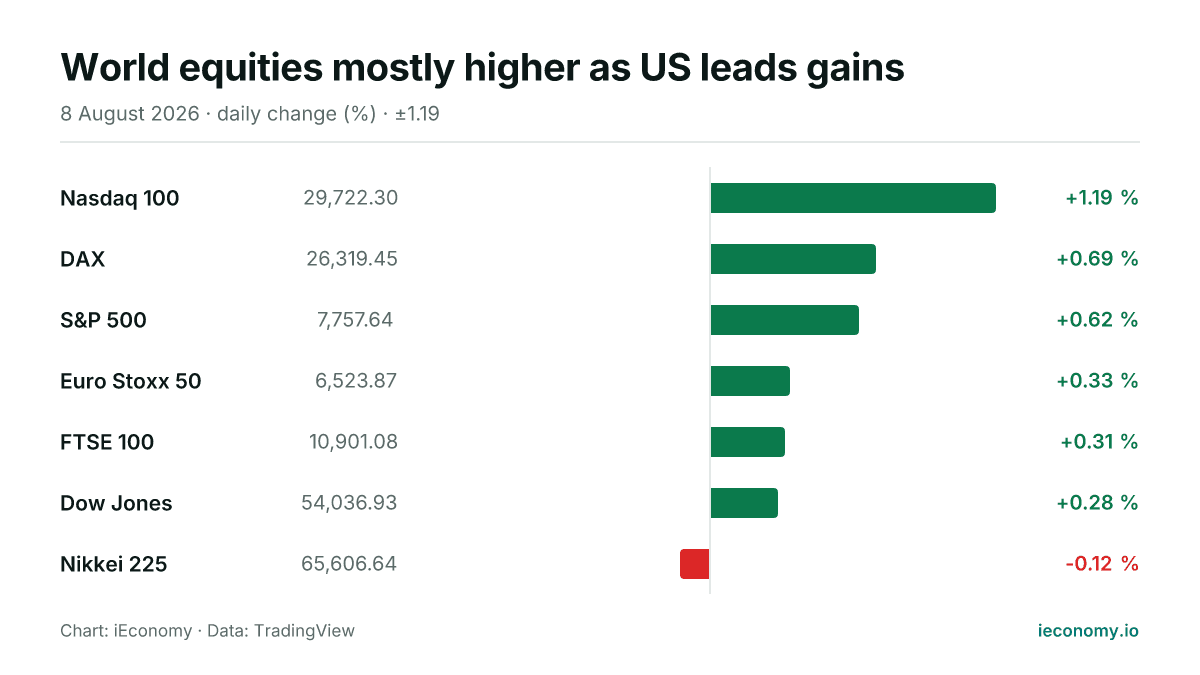
World equities mostly higher as US leads gains
Global stock markets were broadly firmer on Saturday, with six of seven tracked indices in positive territory. The Nasdaq 100 outperformed, while the Nikkei 225 was the only major gauge to edge lower.