S&P 500 rises 1.66% to 7,437.63 on Thursday session
The S&P 500 finished Thursday at 7,437.63, up 1.66%, with five of eight tracked constituents advancing. MSFT was the strongest performer, while META was the weakest.
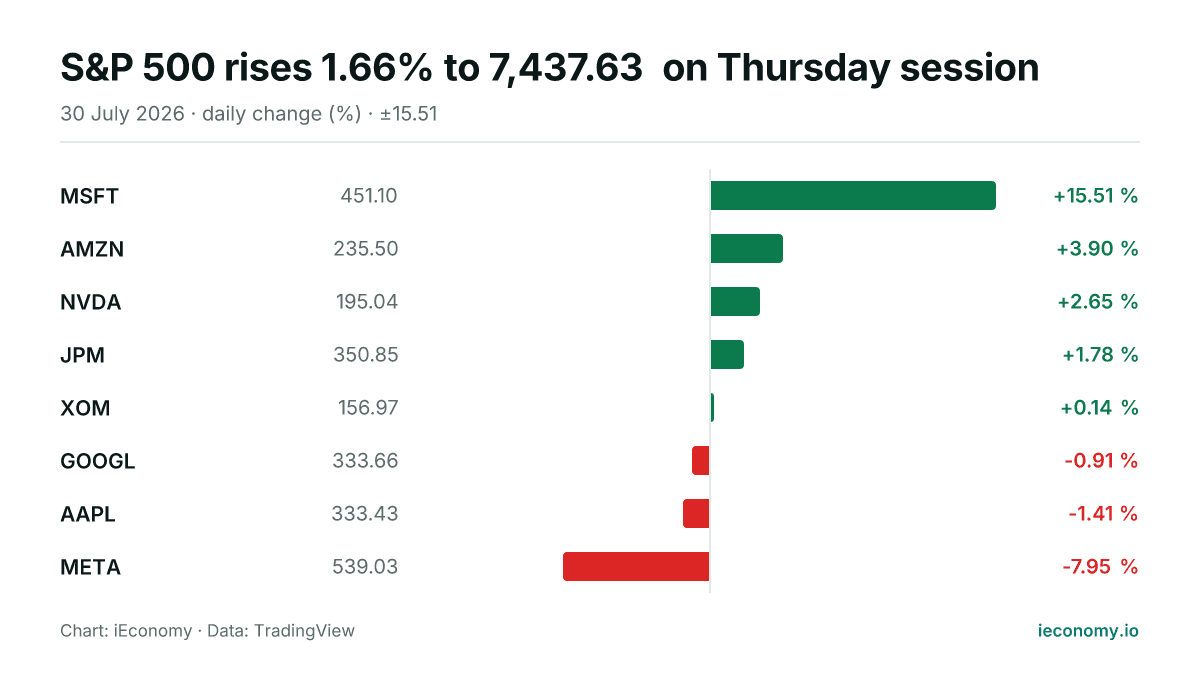
Chart: iEconomy · Data: TradingView
The S&P 500 ended Thursday at 7,437.63, up 1.66% on the day. Among the eight tracked constituents, five closed higher and three lower, leaving the index with a positive but not uniform advance.
How the index moved and how broad the move was
The session was straightforward in mechanical terms: the benchmark gained ground and the majority of the tracked names participated, which helped keep the index firmly in positive territory. Breadth was constructive rather than overwhelming, with 5 of 8 constituents higher and 3 lower. That pattern matters because an index can rise on the back of a small number of large movers, but broader participation usually indicates a more balanced session. Here, the advance was supported by more than one name, though not by the whole group.
The standout individual performers
MSFT was the clear leader, rising to 451.10, up 15.51%. At the other end, META fell to 539.03, down 7.95%, making it the weakest performer in the tracked set. The gap between the best and weakest names shows how a single session can contain both sharp gains and sharp losses at the same time. For index readers, the key point is that strong performance in one constituent can coincide with weakness in another without canceling out the overall move.
What a long-term investor should take from one session
One day’s move is best treated as a snapshot of market mechanics, not as a thesis in itself. Index levels reflect the combined effect of constituent moves and their weights, so a rising S&P 500 does not mean every stock rose equally, only that the aggregate effect was positive. For a long-term investor, the useful takeaway is to focus on participation, dispersion and consistency across sessions rather than the emotion of a single close. A strong day can still contain sharp reversals in individual names, and that is normal market behaviour rather than a signal to overreact.
| Stock | Last | Change |
|---|---|---|
| MSFT | 451.10 | +15.51 % |
| AMZN | 235.50 | +3.90 % |
| NVDA | 195.04 | +2.65 % |
| JPM | 350.85 | +1.78 % |
| XOM | 156.97 | +0.14 % |
| GOOGL | 333.66 | -0.91 % |
| AAPL | 333.43 | -1.41 % |
| META | 539.03 | -7.95 % |
Sources
Related News
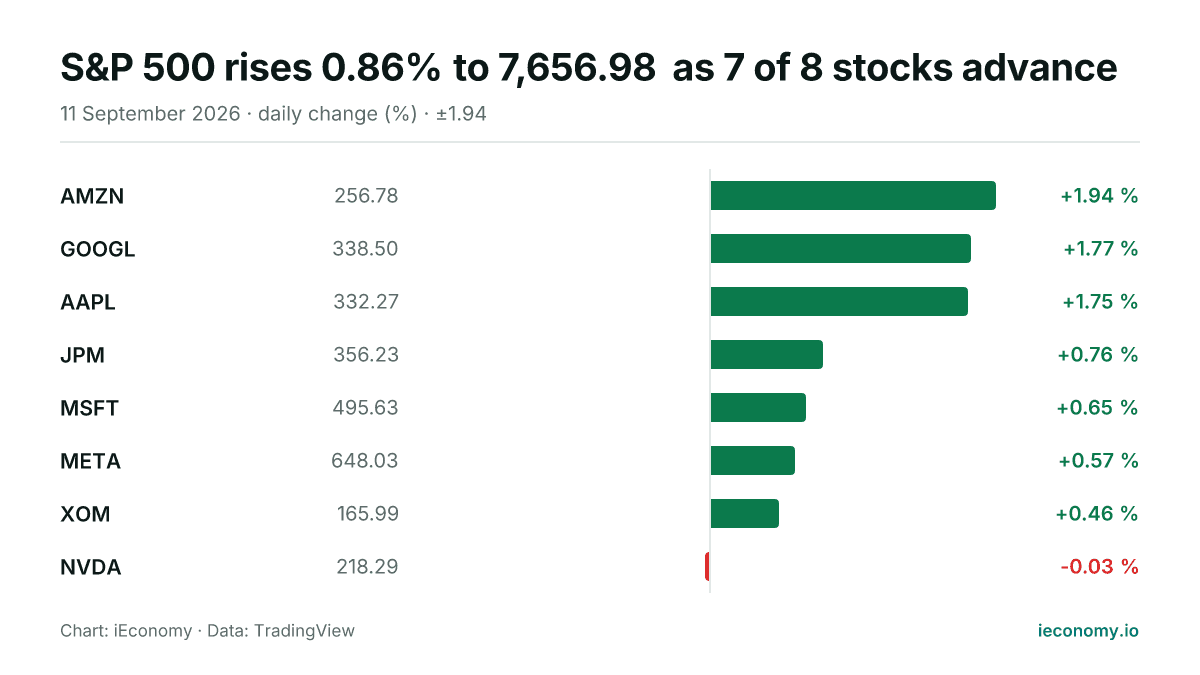
S&P 500 rises 0.86% to 7,656.98 as 7 of 8 stocks advance
The S&P 500 finished higher on Friday, with a broad majority of the tracked constituents in positive territory. AMZN led the group, while NVDA was the only decliner among the eight names monitored.
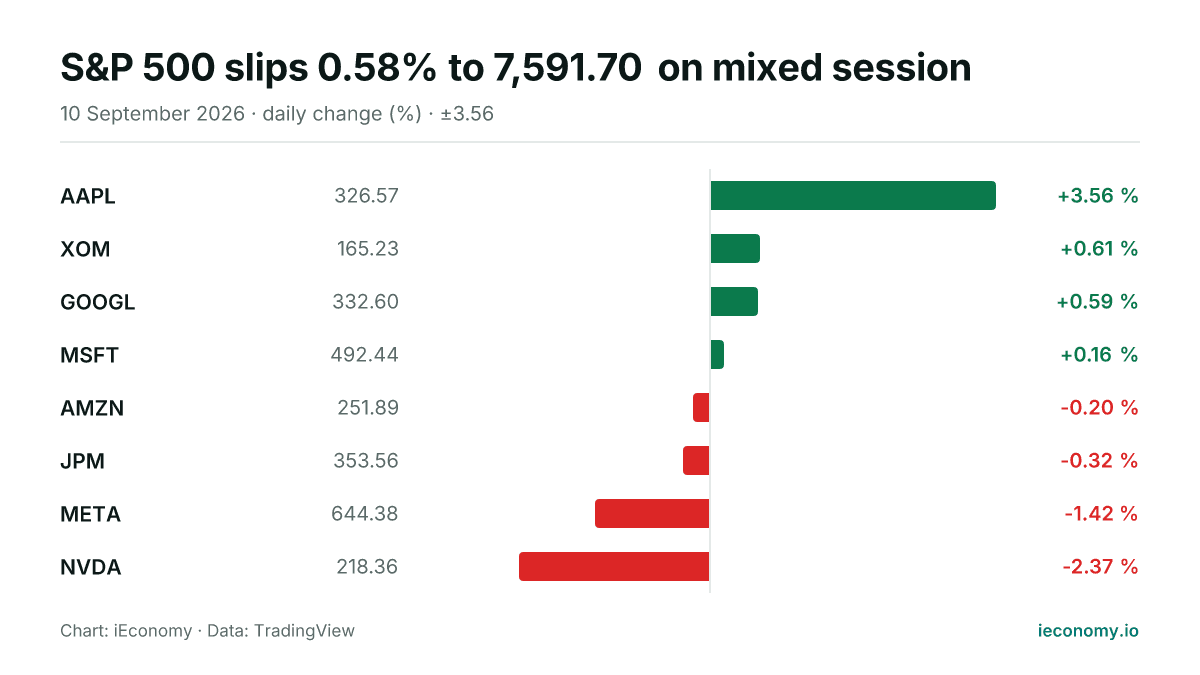
S&P 500 slips 0.58% to 7,591.70 on mixed session
The S&P 500 ended Thursday lower at 7,591.70, with a narrow split among the eight tracked constituents showing four gainers and four decliners. Apple was the strongest performer, while Nvidia was the weakest.
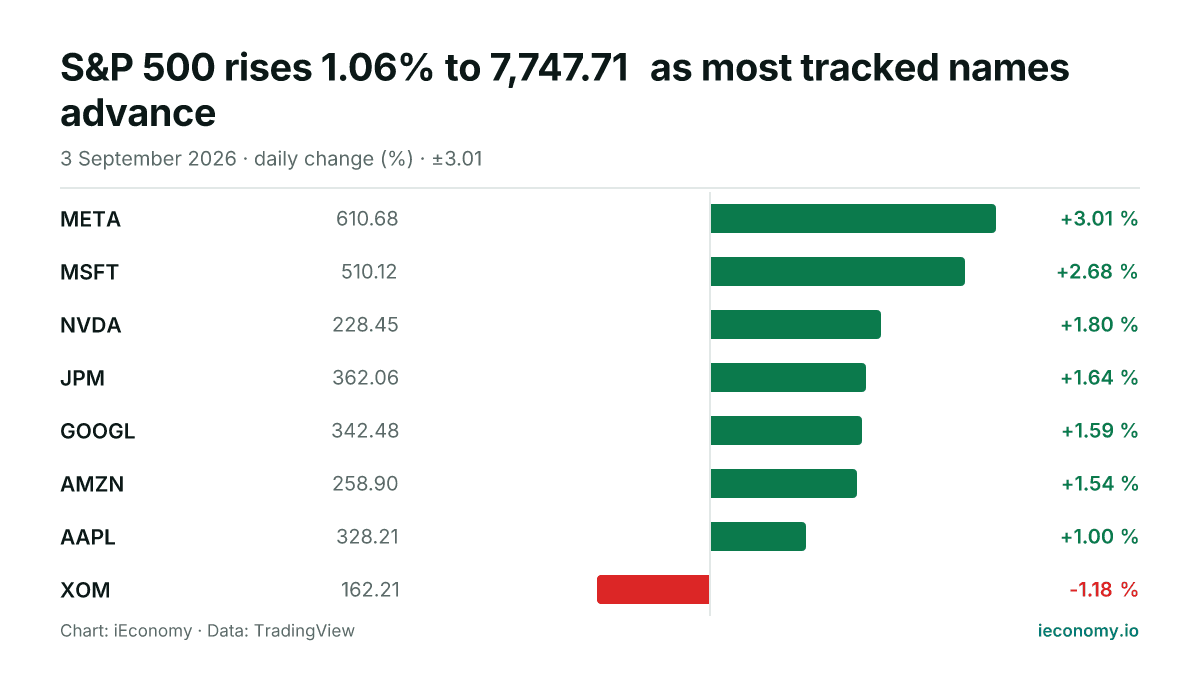
S&P 500 rises 1.06% to 7,747.71 as most tracked names advance
The S&P 500 finished Thursday higher, with 7 of 8 tracked constituents in positive territory. META was the strongest performer, while XOM was the only decliner among the names tracked in the digest.
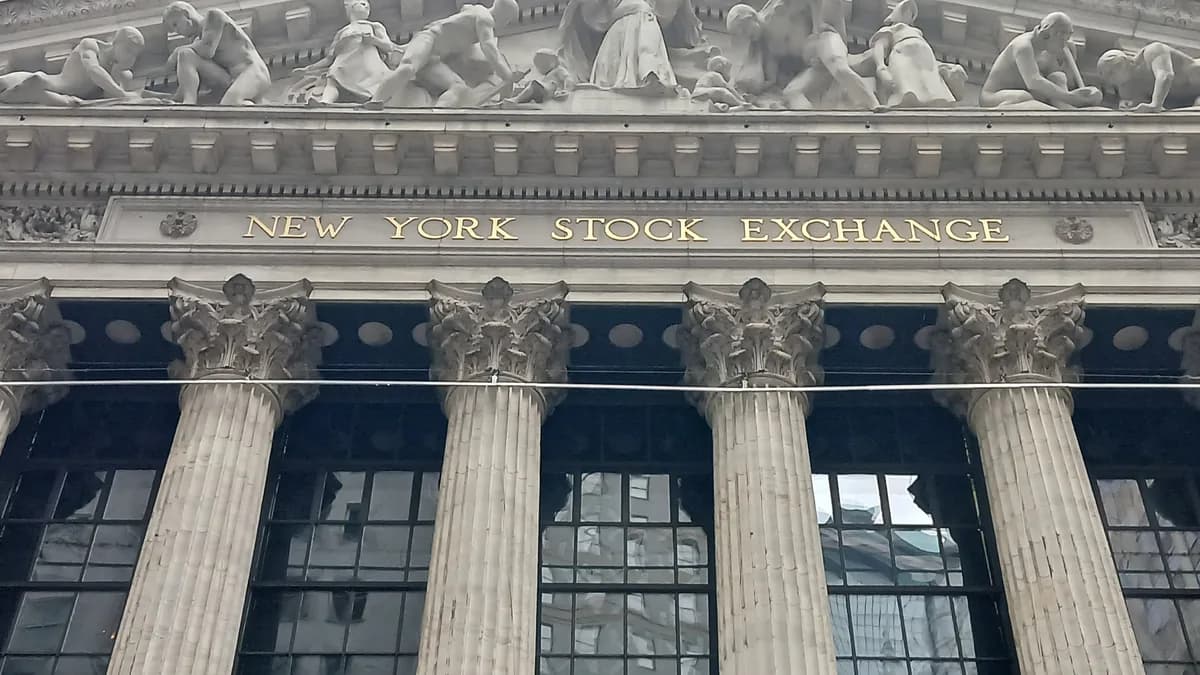
Wall Street and Europe advance as Nikkei lags
US and European equity benchmarks were higher on Saturday, while Japan’s Nikkei 225 fell sharply. The day’s spread shows how index performance can diverge even within the same broad global risk backdrop.
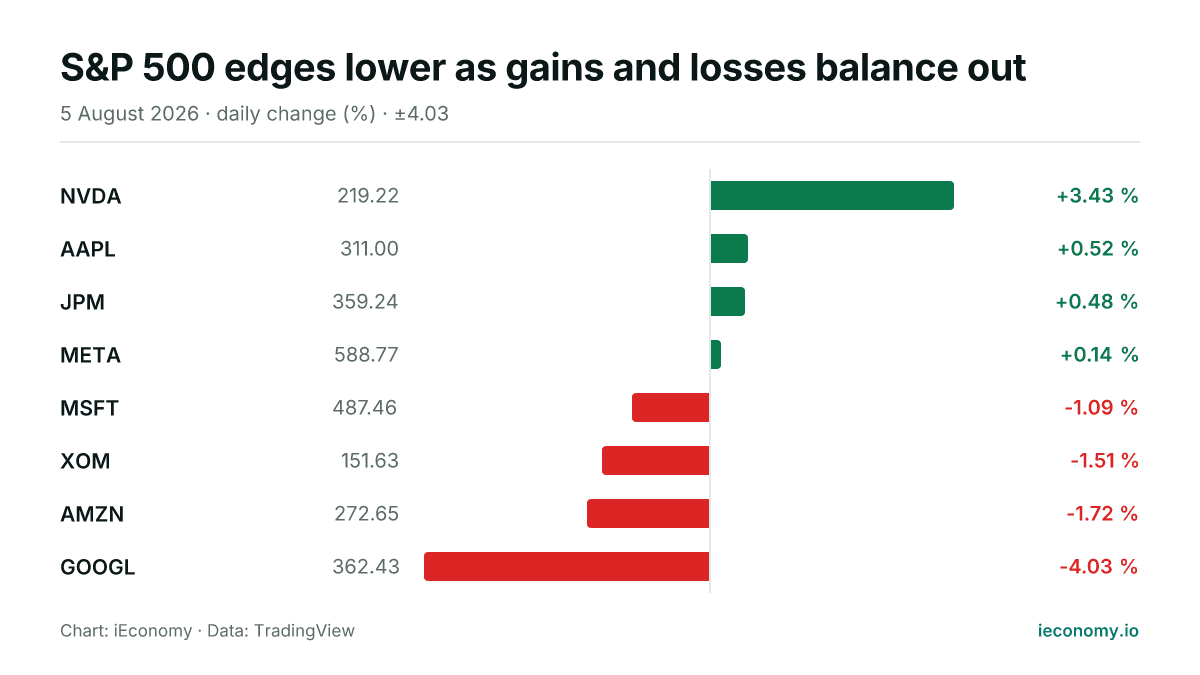
S&P 500 edges lower as gains and losses balance out
The S&P 500 finished the session at 7,723.55, down 0.17%, with breadth split evenly among the eight tracked constituents. NVIDIA was the strongest performer, while Alphabet was the weakest.
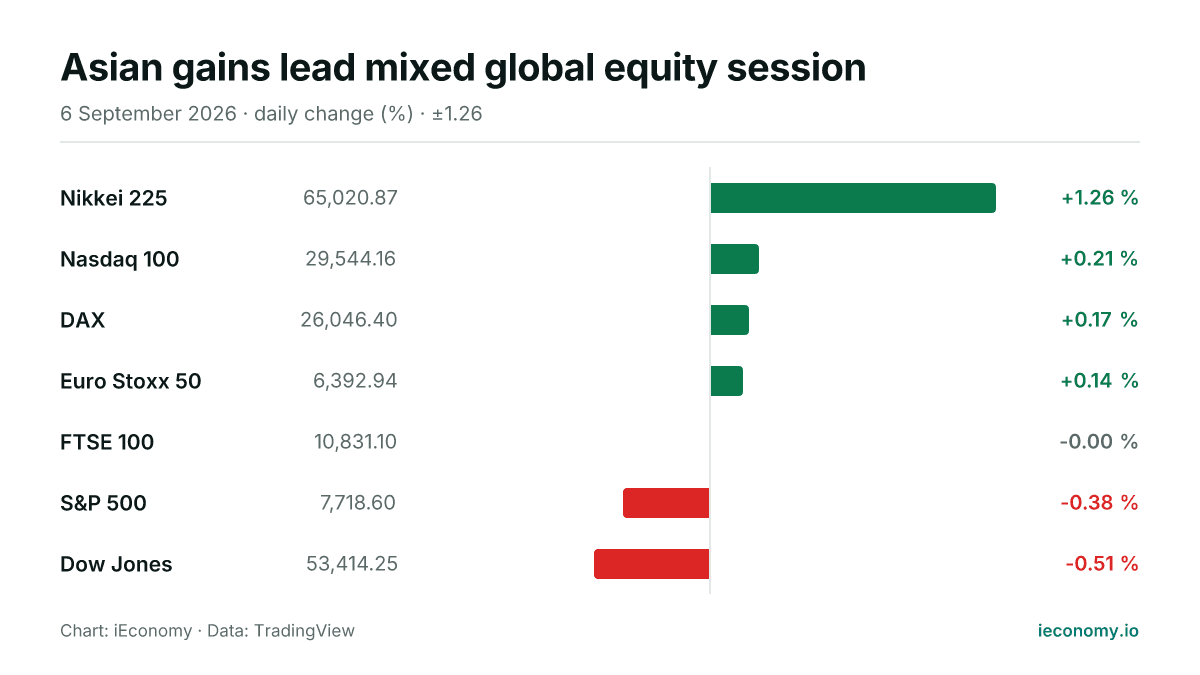
Asian gains lead mixed global equity session
Asian and European indices were firmer while US benchmarks were mixed, with the Nasdaq 100 edging higher and the S&P 500 and Dow Jones lower. The day left a split picture across regions rather than a broad risk-on move.