S&P 500 slips 0.33% as most tracked names fall
The S&P 500 ended Monday at 7,686.14, down 0.33% on the session. In the small set of tracked constituents, six fell and two rose, with Exxon Mobil the strongest and Amazon the weakest.
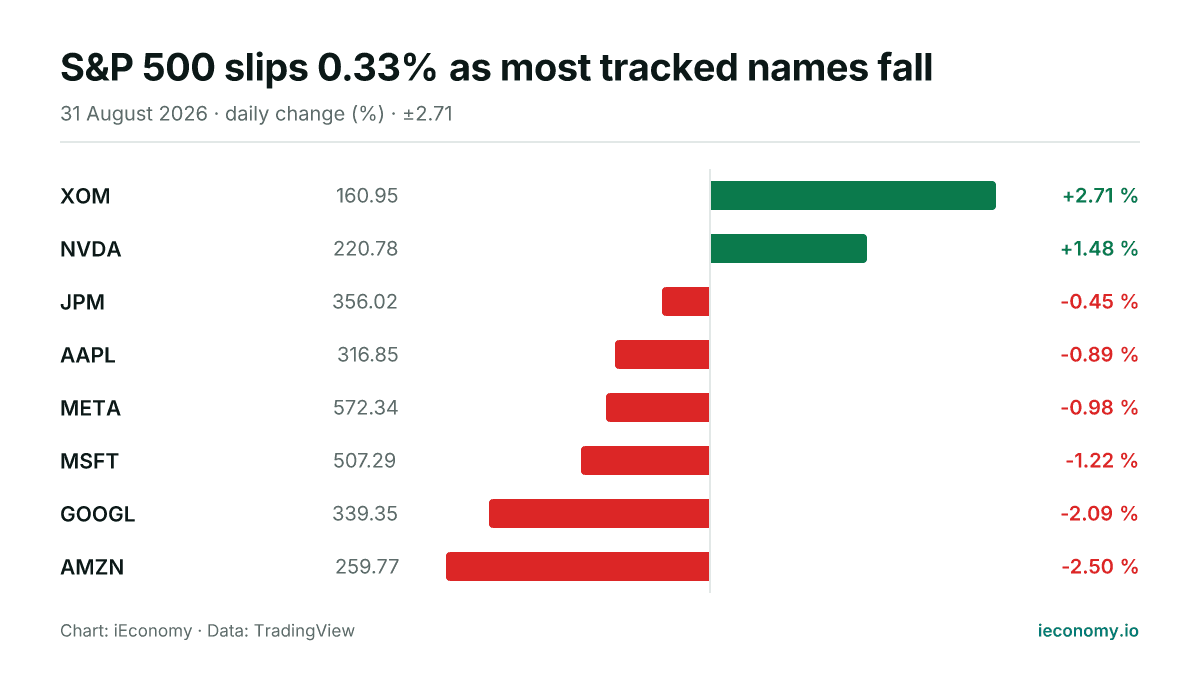
Chart: iEconomy · Data: TradingView
The S&P 500 ended Monday at 7,686.14, down 0.33% on the day. The move was modest in index terms, but the internal tone was softer, with more tracked constituents declining than advancing.
Index move and breadth
Among the eight constituents tracked in this digest, six finished lower and two were higher. That kind of split points to negative breadth, even when the headline index change is relatively contained.
| Stock | Last | Change |
|---|---|---|
| XOM | 160.95 | +2.71 % |
| NVDA | 220.78 | +1.48 % |
| JPM | 356.02 | -0.45 % |
| AAPL | 316.85 | -0.89 % |
| META | 572.34 | -0.98 % |
| MSFT | 507.29 | -1.22 % |
| GOOGL | 339.35 | -2.09 % |
| AMZN | 259.77 | -2.50 % |
For the session, the index drifted lower rather than breaking sharply. In practice, that means weakness in a larger share of names outweighed the support from the smaller group that held up.
Standout individual performers
Exxon Mobil was the best performer, rising 2.71% to 160.95. It provided the clearest positive contribution among the names in the digest.
Amazon was the weakest, falling 2.50% to 259.77. With six of the eight tracked names lower, that drop fit the broader session pattern rather than standing out as an isolated move.
What a long-term investor should take from it
A single session mainly shows how index-level performance can be shaped by the balance of gains and losses underneath it. The same headline move can reflect very different internal patterns from one day to the next.
For long-term investors, the point is not to read too much into one finish. Short-term swings can come from shifting positioning and varying contributions across sectors and large stocks, while the longer horizon is still driven by business fundamentals and time in the market.
Sources
Related News
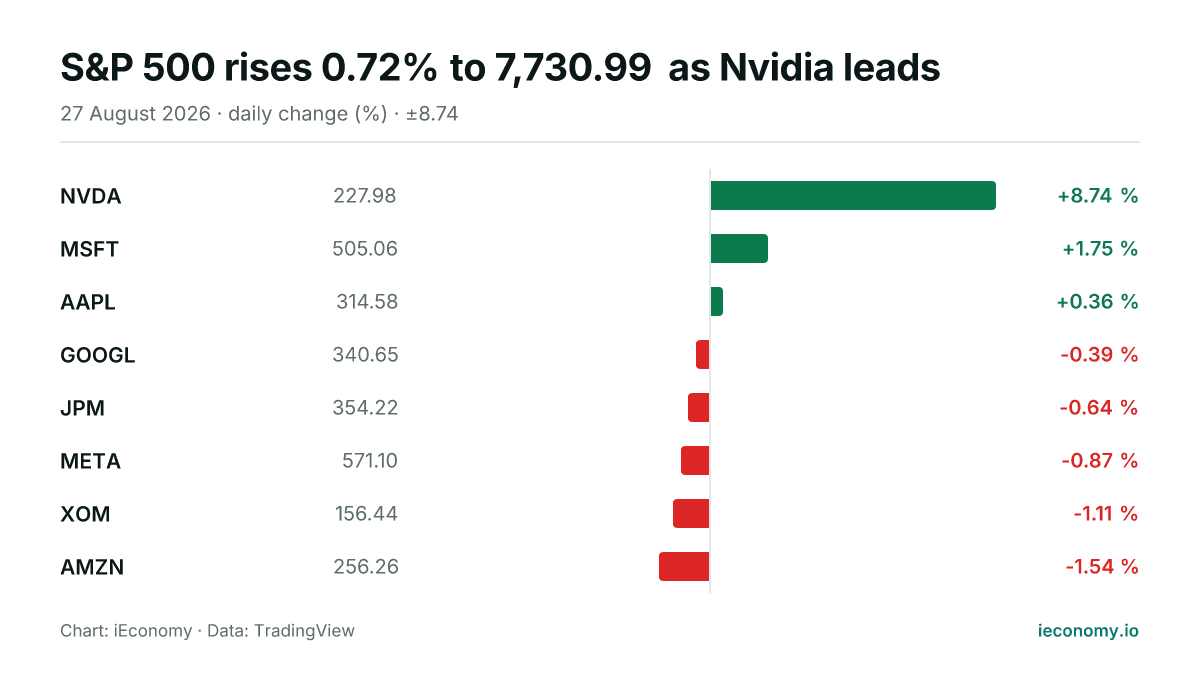
S&P 500 rises 0.72% to 7,730.99 as Nvidia leads
The S&P 500 advanced on Thursday, with a narrow majority of tracked constituents higher. Nvidia was the strongest performer, while Amazon lagged the group.
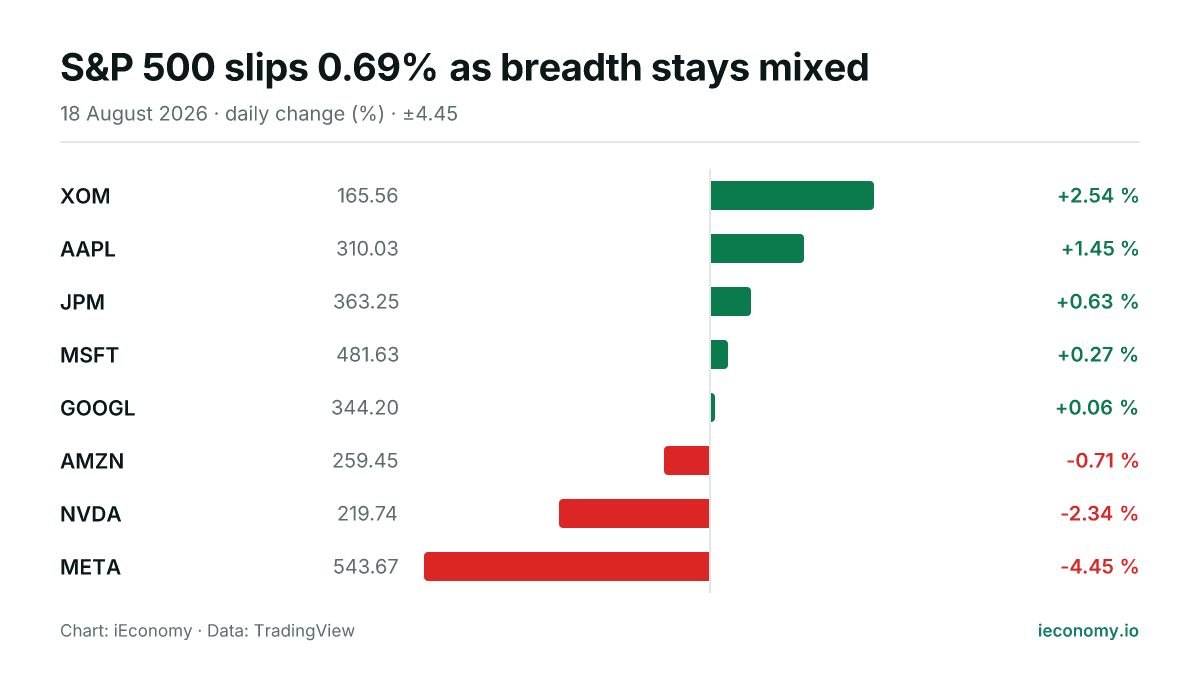
S&P 500 slips 0.69% as breadth stays mixed
The S&P 500 finished Tuesday at 7,691.76, down 0.69% on the session. Among the eight tracked constituents, five advanced and three declined, with XOM the strongest and META the weakest.
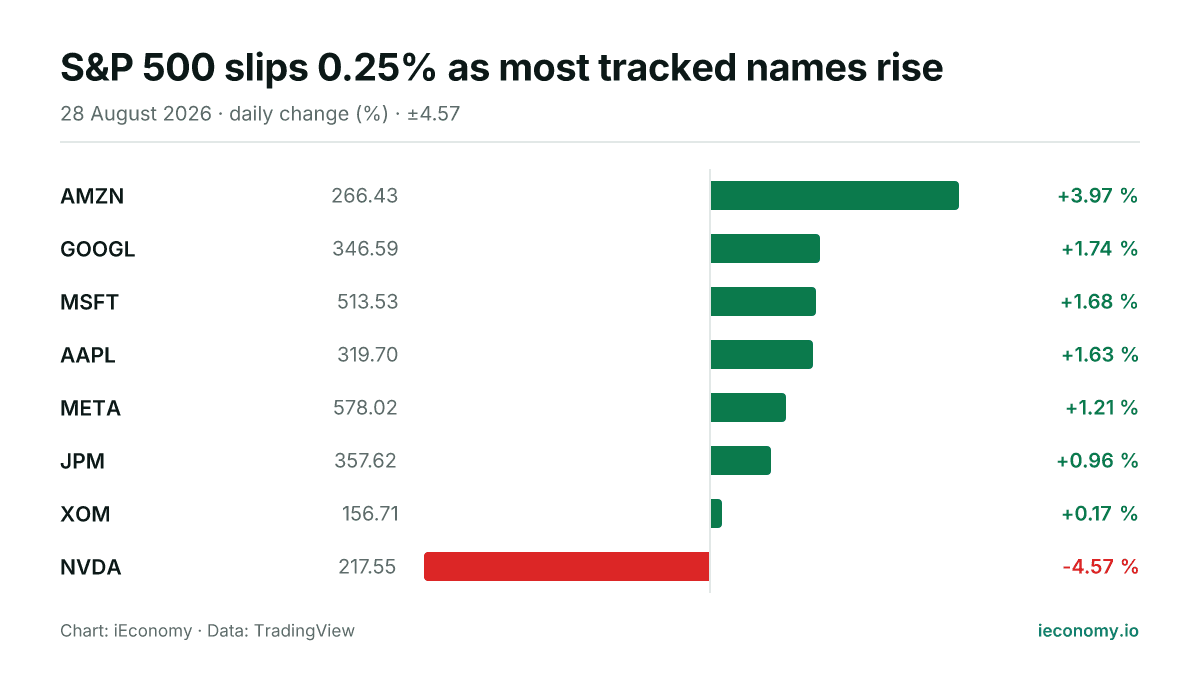
S&P 500 slips 0.25% as most tracked names rise
The S&P 500 finished Friday at 7,711.76, down 0.25% on the day. Breadth was positive among the tracked constituents, but a sharp fall in NVDA offset gains elsewhere.
S&P 500 rises 1.48% to 7,600.50 as most tracked names advance
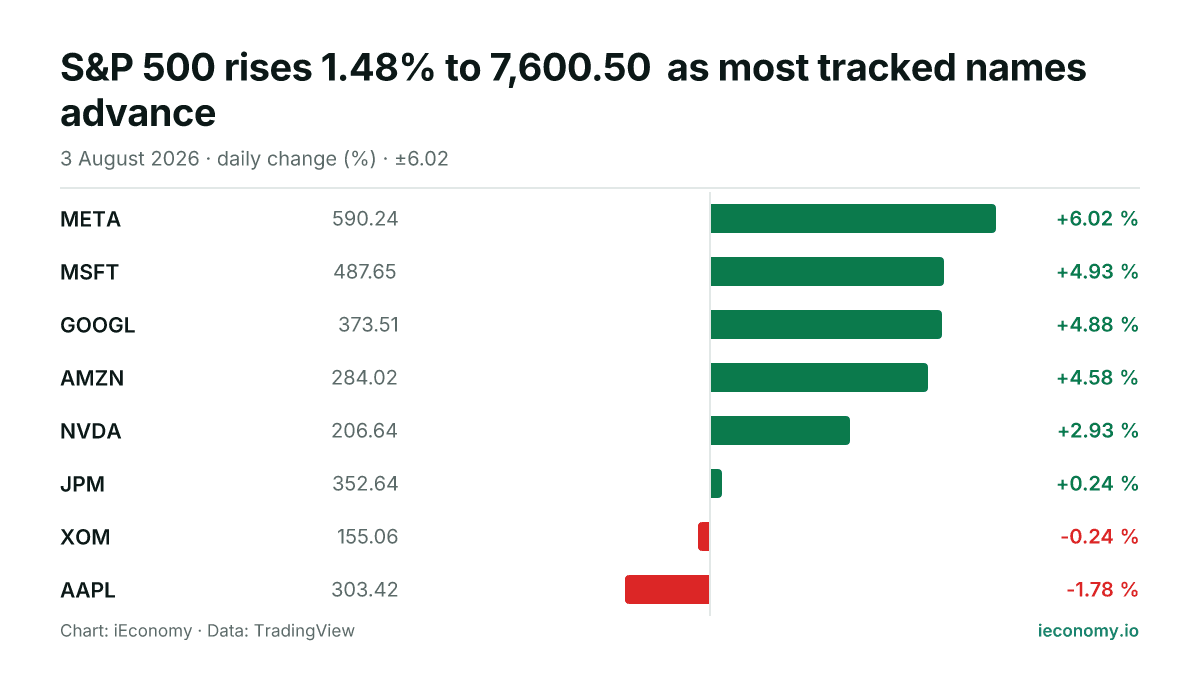
The S&P 500 finished Monday higher at 7,600.50, with six of the eight tracked constituents advancing. META was the strongest performer, while AAPL lagged.
US stocks ease as Europe edges higher, Asia falls
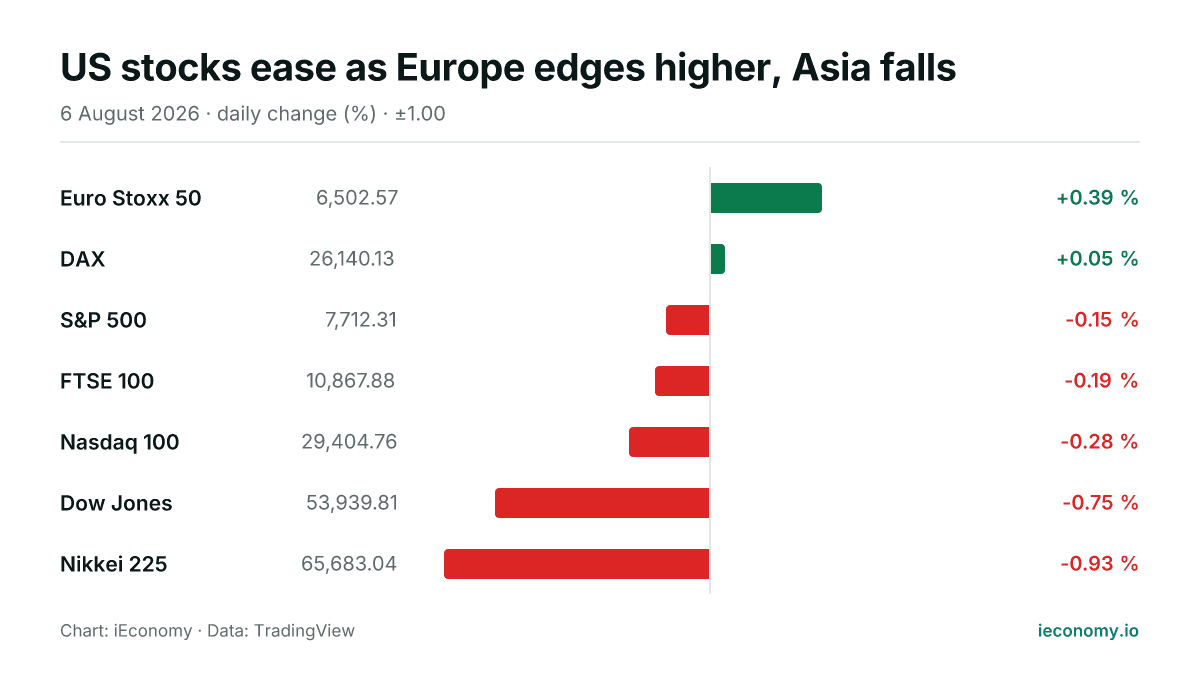
European benchmarks posted modest gains on Thursday, while US and Asian indices traded lower. The day’s moves were contained, with a narrow split between the two European winners and five weaker or flat markets overall.
S&P 500 edges higher as sector breadth stays mixed
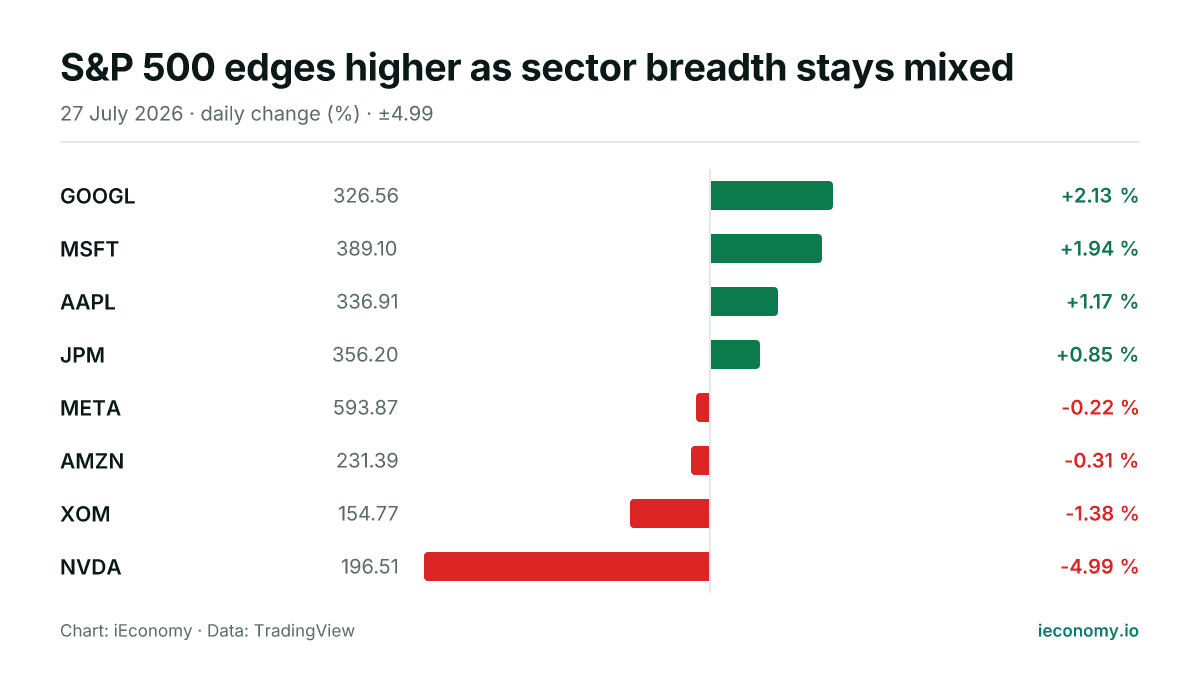
The S&P 500 finished Monday at 7,413.18, up 0.02%, with an even split among the eight tracked constituents. GOOGL was the strongest performer, while NVDA posted the steepest decline.