S&P 500 slips 0.58% to 7,673.52 as breadth turns negative
The S&P 500 finished Tuesday lower at 7,673.52, with 7 of 8 tracked constituents declining and only one advancing. NVIDIA was the weakest performer, while Exxon Mobil led the small group higher.
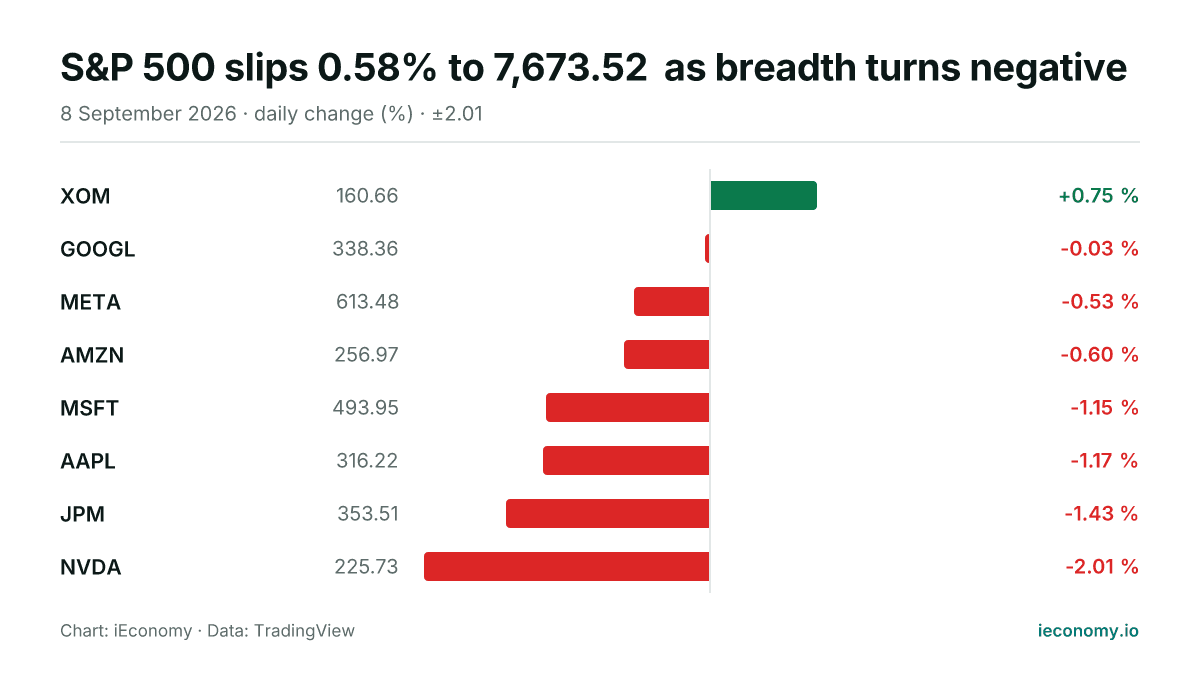
Chart: iEconomy · Data: TradingView
The S&P 500 ended Tuesday at 7,673.52, down 0.58% on the day. The move was broad within the tracked group, with 7 of 8 constituents lower and only 1 higher, which points to a session dominated by weakness rather than a narrow index pullback.
How the index moved and how broad the decline was
The day’s drop in the benchmark was modest in percentage terms, but the participation was one-sided. When only one of the tracked names advances, the index’s decline reflects more than a single stock move: it suggests selling pressure was spread across the sample rather than concentrated in one corner.
| Stock | Last | Change |
|---|---|---|
| XOM | 160.66 | +0.75 % |
| GOOGL | 338.36 | -0.03 % |
| META | 613.48 | -0.53 % |
| AMZN | 256.97 | -0.60 % |
| MSFT | 493.95 | -1.15 % |
| AAPL | 316.22 | -1.17 % |
| JPM | 353.51 | -1.43 % |
| NVDA | 225.73 | -2.01 % |
That kind of session often matters because breadth can shape how durable a move feels. A decline with widespread participation tends to weigh more heavily on sentiment than an isolated slip in one heavyweight, even when the headline percentage change remains contained.
The standout individual performers
Exxon Mobil was the strongest of the tracked names, rising 0.75% to 160.66. On the other side, NVIDIA was the weakest performer, falling 2.01% to 225.73. The gap between the two shows that even within the same index, individual stocks can move in very different ways on a single session.
With only eight constituents tracked here, the comparison is not a full map of the index, but it still illustrates the session’s tone: one energy stock held up, while a technology leader weakened more sharply. That split helped leave the overall index in the red.
What a long-term investor should take from one session
For a long-term investor, a single day’s move is best read as information about short-term market mechanics, not as a thesis in itself. Daily declines can reflect portfolio rebalancing, position-taking, or changing risk appetite, but the exact cause cannot be inferred from the price action alone.
The more useful takeaway is discipline around perspective. Index levels, one-day percentage changes, and the balance between advancers and decliners help show how trading was arranged that session, yet they do not by themselves change the longer-term case for an asset or a strategy.
Sources
Related News
S&P 500 rises 0.46% to 7,666.60 as breadth tilts higher
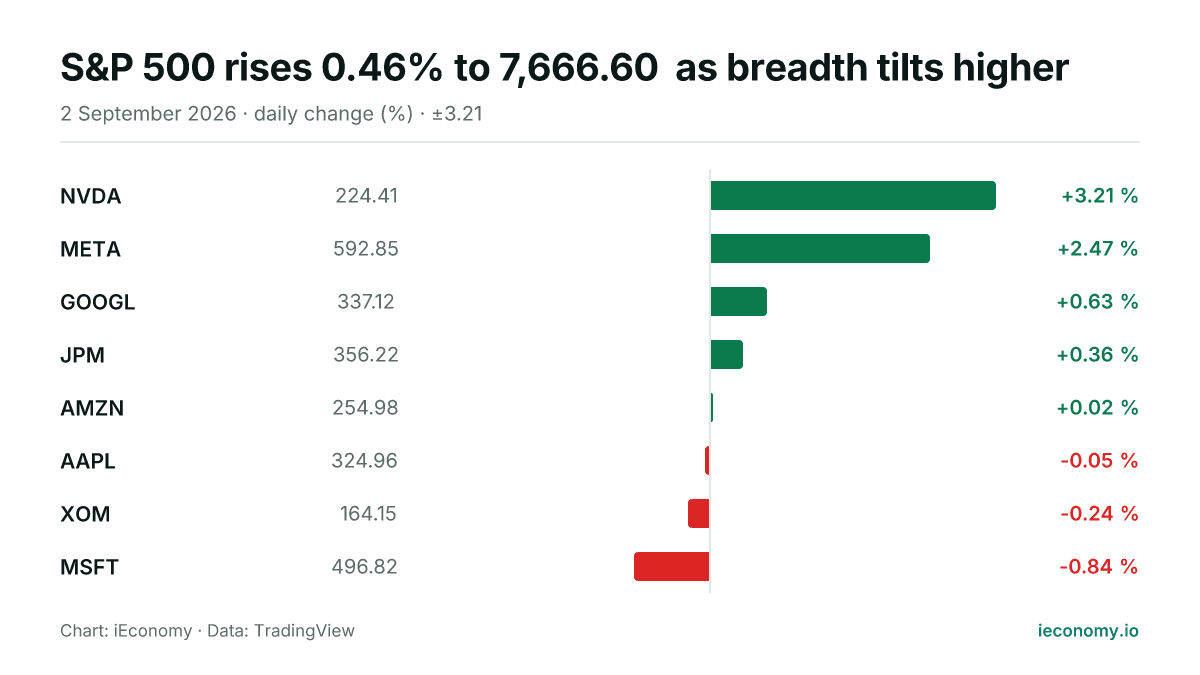
The S&P 500 finished Wednesday at 7,666.60, up 0.46%, with five of eight tracked constituents advancing. NVIDIA was the strongest performer, while Microsoft lagged.
S&P 500 slips 0.25% as most tracked names rise
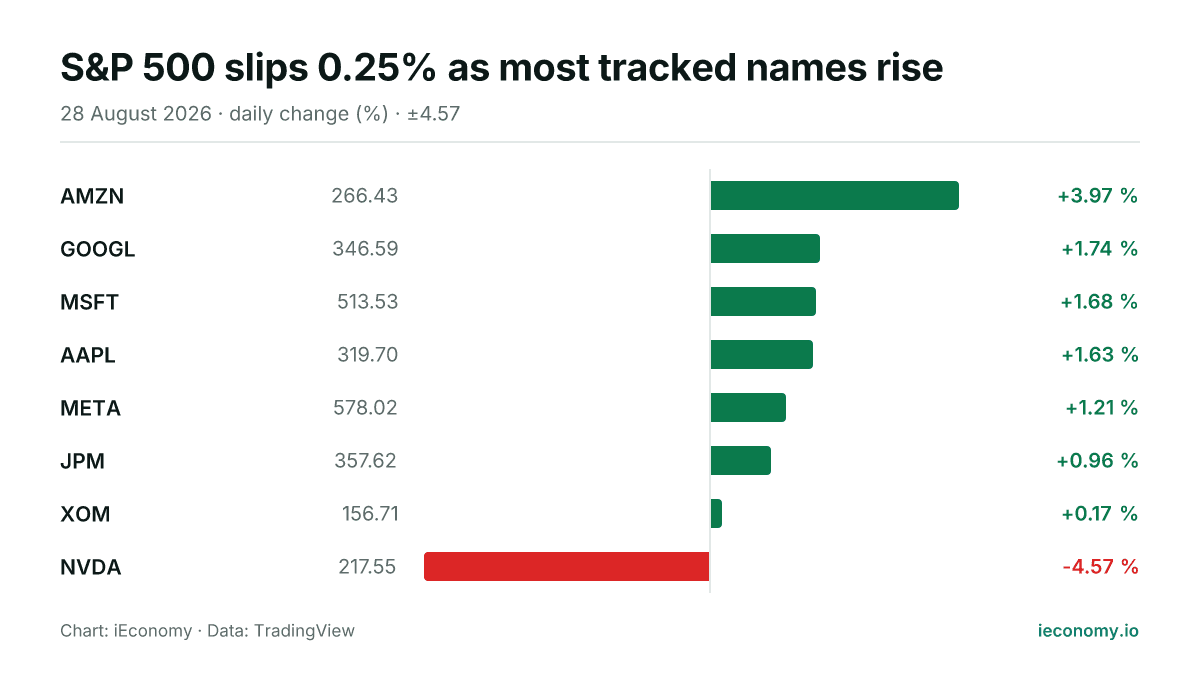
The S&P 500 finished Friday at 7,711.76, down 0.25% on the day. Breadth was positive among the tracked constituents, but a sharp fall in NVDA offset gains elsewhere.
S&P 500 slips 0.38% to 7,718.60 as breadth stays soft
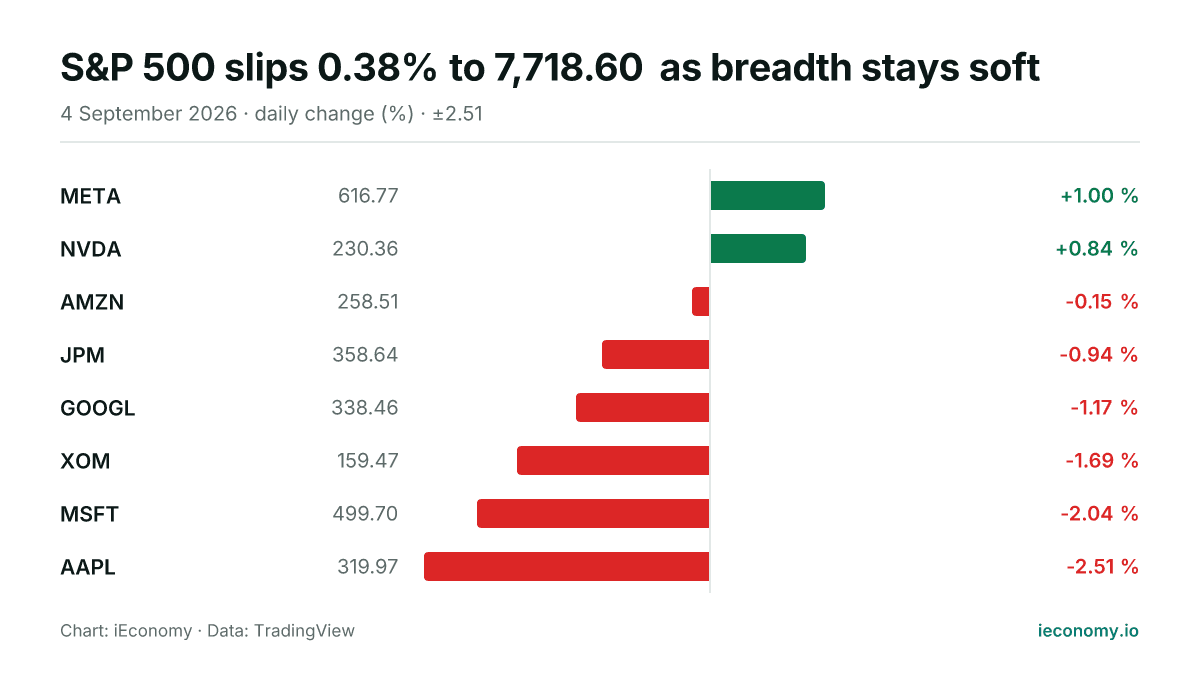
The S&P 500 finished Friday lower at 7,718.60, with six of the eight tracked constituents declining. META was the day’s best performer, while AAPL posted the steepest fall.
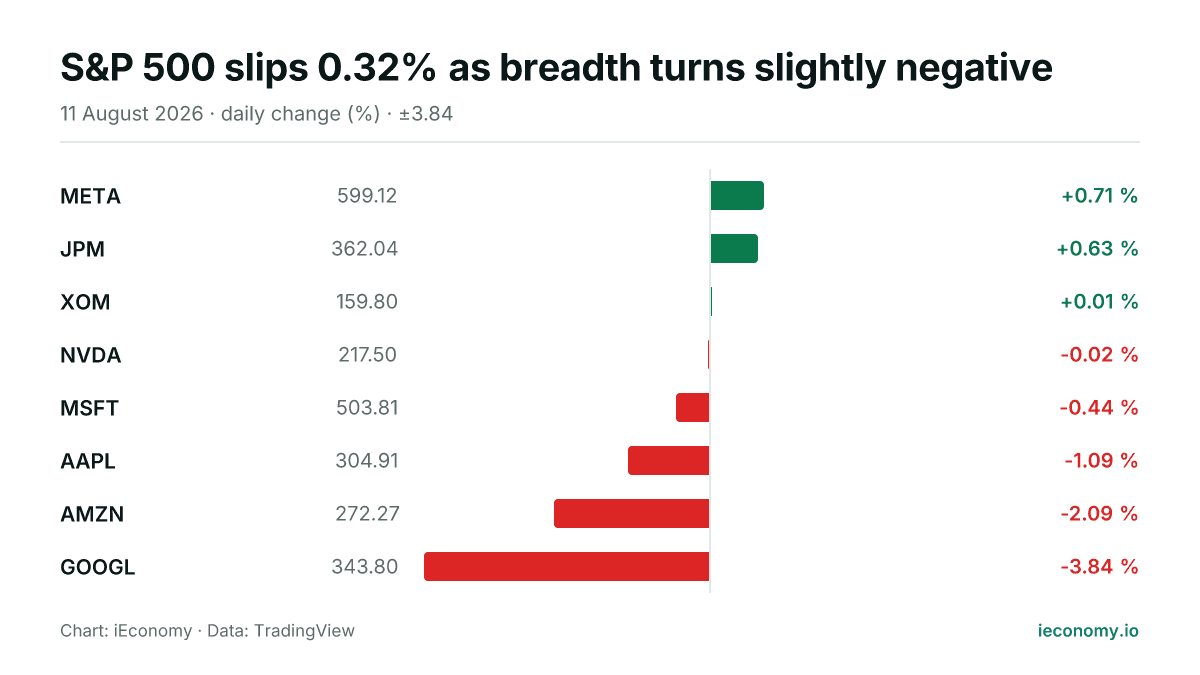
S&P 500 slips 0.32% as breadth turns slightly negative
The S&P 500 finished Tuesday at 7,728.20, down 0.32%, with more constituents tracked in the red than in the green. META was the strongest name, while GOOGL was the weakest.
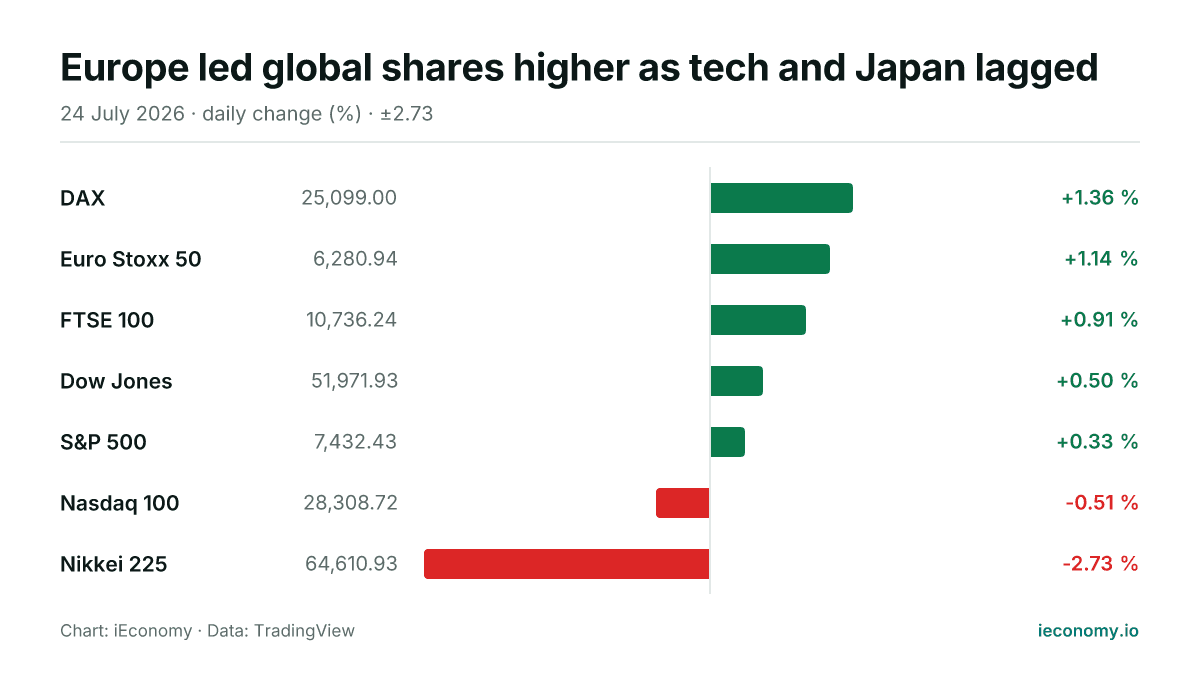
Europe led global shares higher as tech and Japan lagged
European indices outperformed on Friday, while US benchmarks were mixed and Tokyo fell sharply. The day left five of the seven tracked equity gauges higher, with the Nasdaq 100 and Nikkei 225 on the losing side.
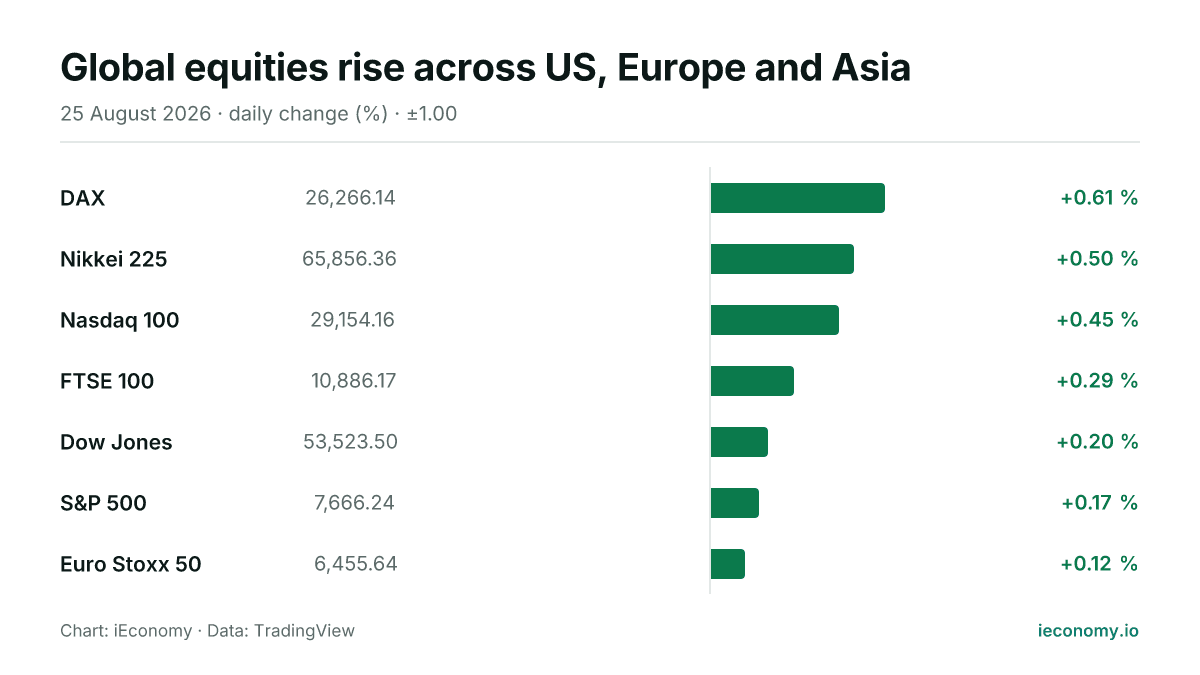
Global equities rise across US, Europe and Asia
All seven tracked benchmarks were higher on Tuesday, with gains led by Germany’s DAX and Japan’s Nikkei 225. The moves were broadly modest, leaving the day more notable for breadth than for size.