Asian Equities Hit Multi-Decade Highs as BOJ Policy Path Diverges
Regional benchmarks extended a strong run as investors weighed a stronger corporate earnings backdrop against shifting central bank policy.

Major Asian equity benchmarks climbed to their highest levels in decades this week, extending a rally that has been supported by improving corporate earnings, ongoing share buyback programs, and a gradual shift in monetary policy from the region's central bank.
Japan's benchmark index posted its strongest weekly performance in several months, with gains led by exporters that have benefited from a still-competitive currency even as the central bank has moved incrementally away from its long-standing ultra-loose policy stance.
Corporate governance reforms continue to support flows
Ongoing corporate governance reforms, which have pushed listed companies to improve capital efficiency and increase shareholder returns through buybacks and dividends, remain a structural tailwind cited repeatedly by desk strategists covering the region.
Foreign investor inflows into regional equities picked up over recent weeks, according to data compiled by the desk, reversing a period of more cautious positioning earlier in the year.
Analysts noted that further policy normalization from the central bank, while broadly anticipated, carries the risk of near-term volatility for both regional equities and the currency should the pace of tightening surprise markets.
Related News
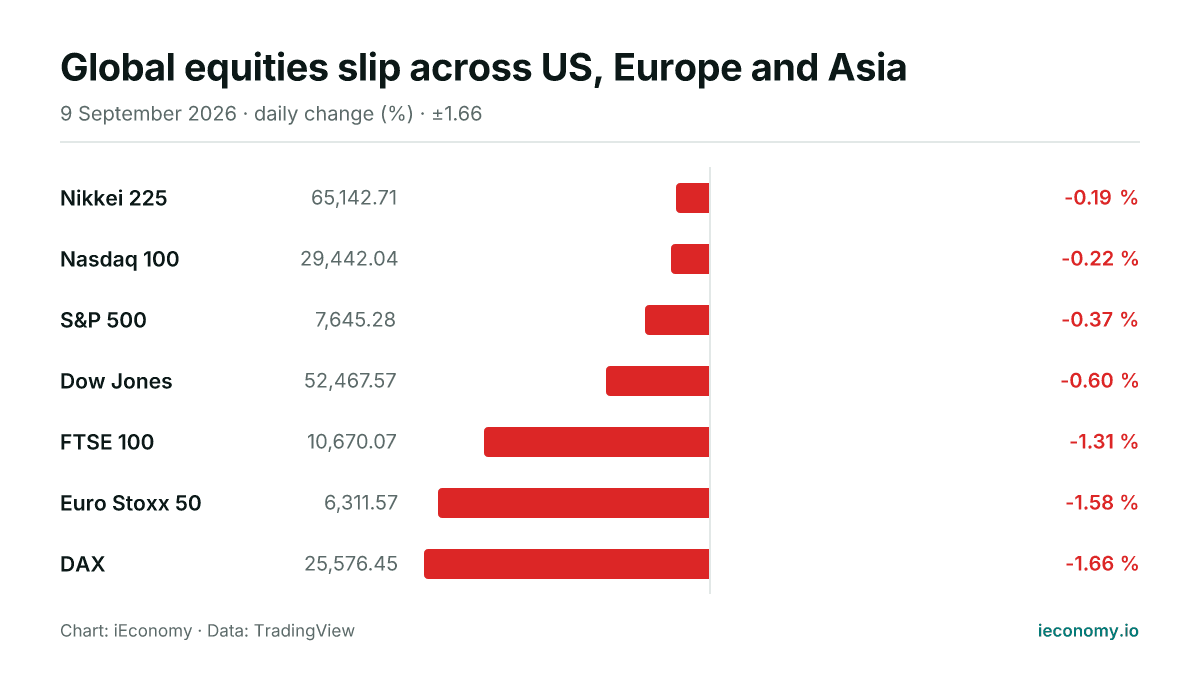
Global equities slip across US, Europe and Asia
All seven tracked indices were lower or flat on Wednesday, with Europe leading the declines and the Dow among the weakest in the US. The session was broadly risk-off, but only the price action itself is visible here.
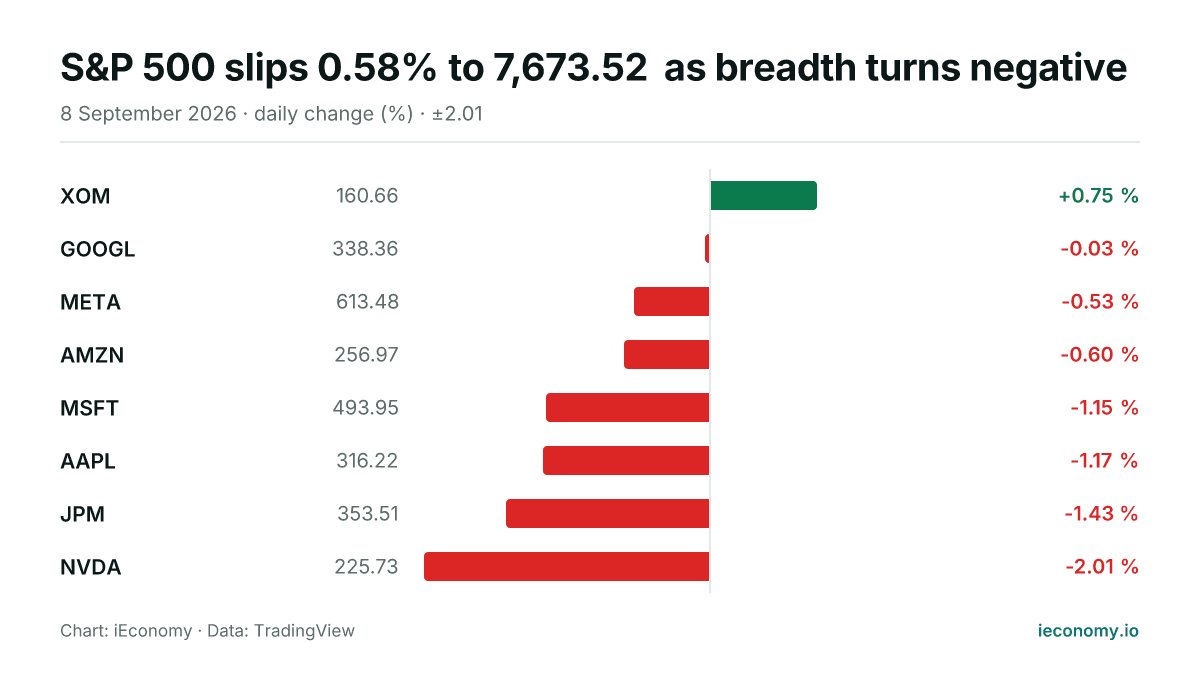
S&P 500 slips 0.58% to 7,673.52 as breadth turns negative
The S&P 500 finished Tuesday lower at 7,673.52, with 7 of 8 tracked constituents declining and only one advancing. NVIDIA was the weakest performer, while Exxon Mobil led the small group higher.
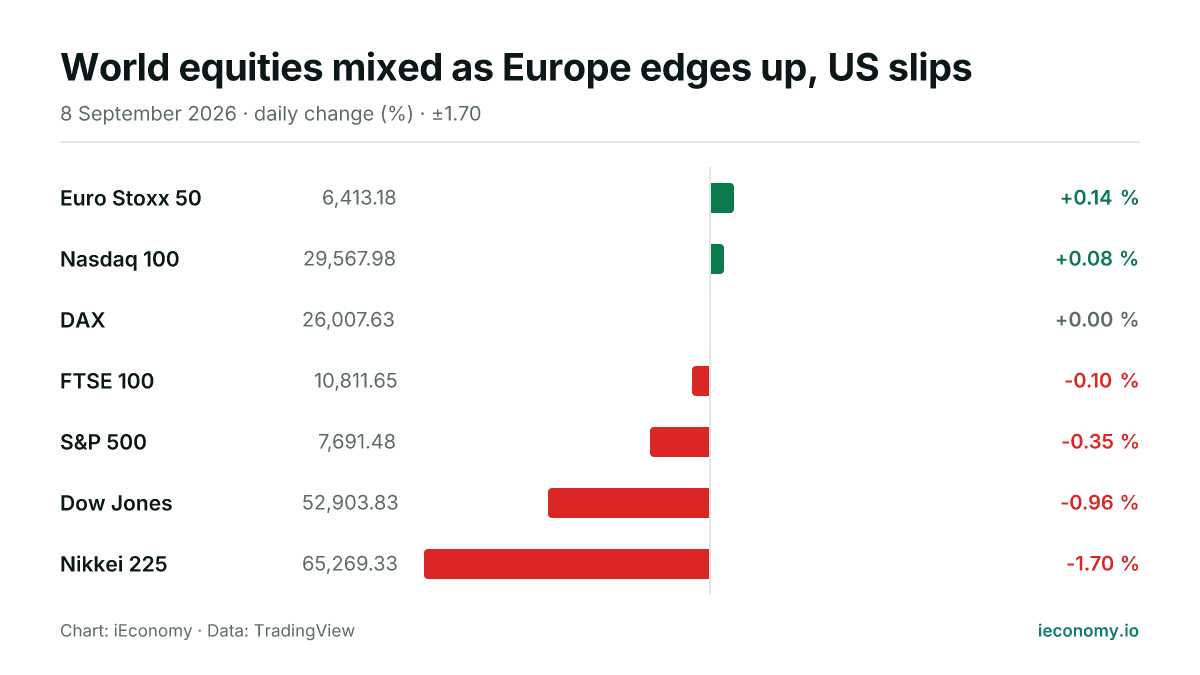
World equities mixed as Europe edges up, US slips
European shares were modestly firmer, US indices were mixed to lower, and Tokyo lagged. The day’s moves were small in much of Europe but sharper in the US and Japan, showing uneven risk appetite.
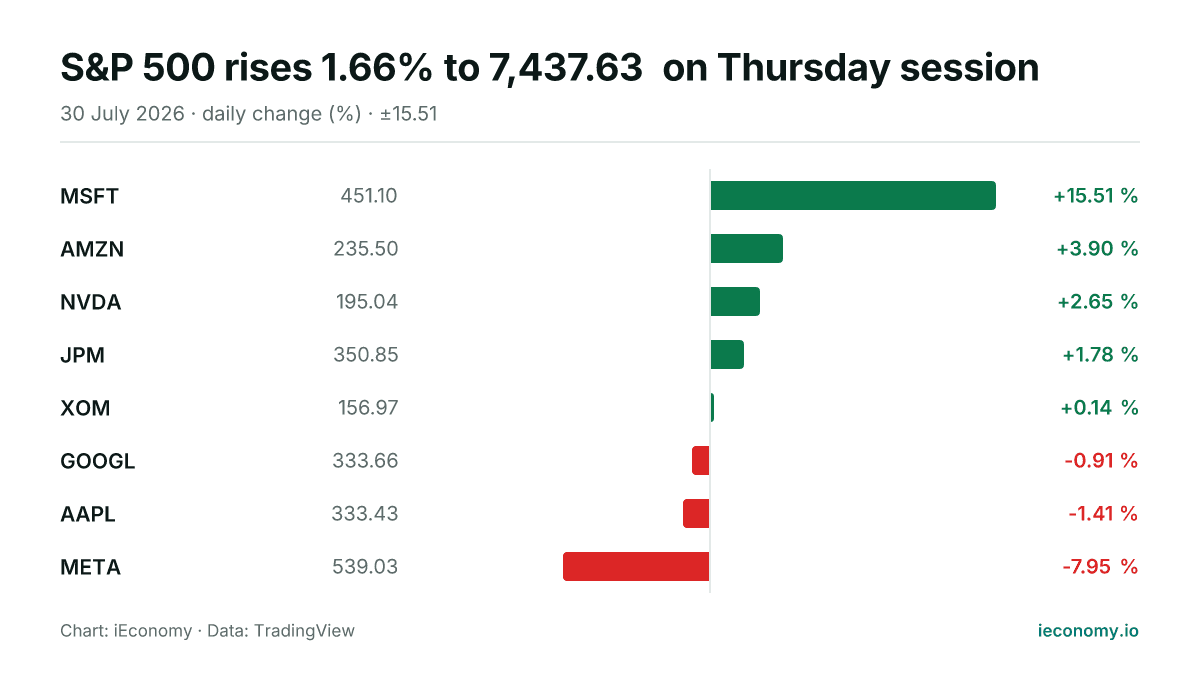
S&P 500 rises 1.66% to 7,437.63 on Thursday session
The S&P 500 finished Thursday at 7,437.63, up 1.66%, with five of eight tracked constituents advancing. MSFT was the strongest performer, while META was the weakest.
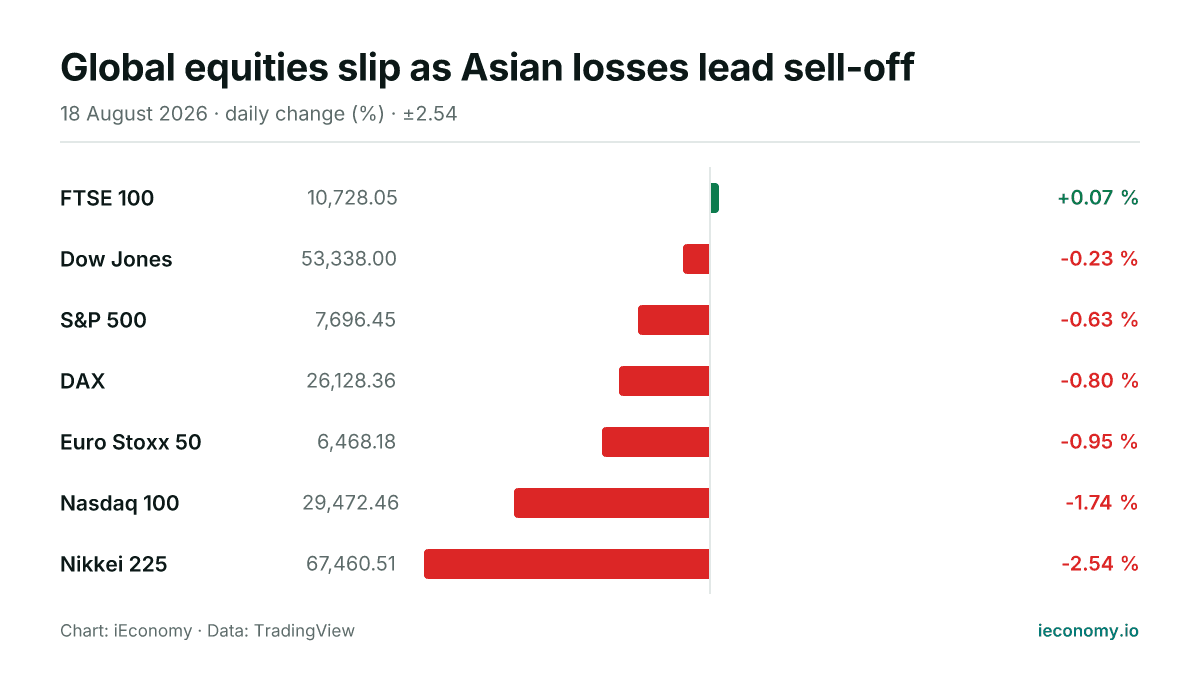
Global equities slip as Asian losses lead sell-off
US shares eased, Europe traded lower and Tokyo fell sharply, leaving only the FTSE 100 modestly higher in a broad but uneven equity retreat on Tuesday.
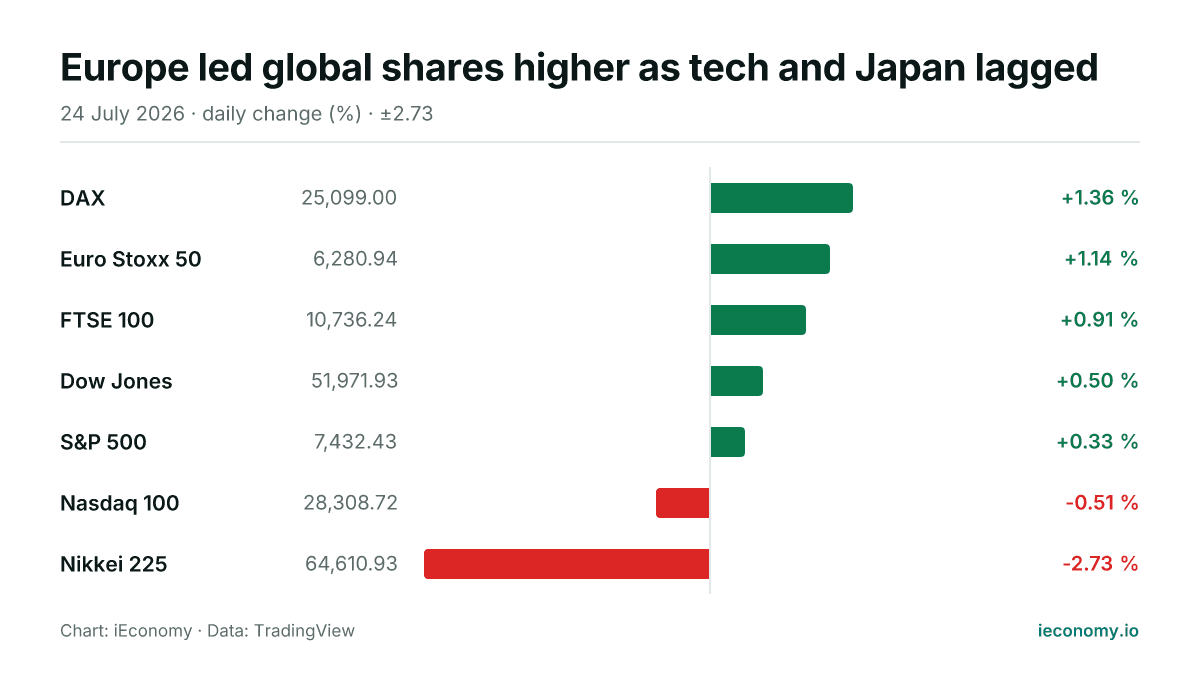
Europe led global shares higher as tech and Japan lagged
European indices outperformed on Friday, while US benchmarks were mixed and Tokyo fell sharply. The day left five of the seven tracked equity gauges higher, with the Nasdaq 100 and Nikkei 225 on the losing side.