What is Support and Resistance?
Support and resistance are the most frequently heard concepts in the forex market, as well as technical analysis concepts used in all financial markets.
What is Support and Resistance?
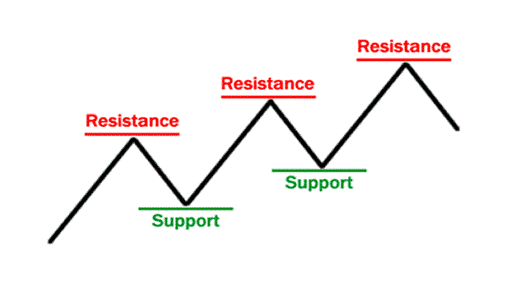
Support and resistance are the most frequently heard concepts in the forex market, as well as technical analysis concepts used in all financial markets. The concept of resistance can be defined as the last point of the rise in prices. After this point, prices begin to decrease. Support can be described as the opposite. It is the last point that the decline in prices reached before going up again. The above chart shows an upturn of the zigzag model. As can be seen here, the highest level of resistance that prices have reached before falling is called support, while the lowest level that has reached before rising is called support.
Support and resistance continue to occur as prices move up and down constantly.
In other words, the place where buyers come to the market is support and the place where sellers come to the market is resistance. Because the price reaches the support level, it drives the investors to make purchases. When the prices rise to the resistance level, investors believe that they should sell.
In general, the operations performed at the support and resistance levels are basically the following:
The above chart shows an upturn of the zigzag model. As can be seen here, the highest level of resistance that prices have reached before falling is called support, while the lowest level that has reached before rising is called support.
Support and resistance continue to occur as prices move up and down constantly.
In other words, the place where buyers come to the market is support and the place where sellers come to the market is resistance. Because the price reaches the support level, it drives the investors to make purchases. When the prices rise to the resistance level, investors believe that they should sell.
In general, the operations performed at the support and resistance levels are basically the following:
Splash trading
- Purchases are made when the price drops to the support level.
- Sales are made when the price rises to the resistance level.
Break trading
- Purchase is made when the price breaks through resistance.
- Sales are made when the price is broken through support.
Drawing Support and Resistance Levels
First of all, it should be remembered that the levels of support and resistance are not exact figures. When you look at the graphics, you can see a level of support and resistance that looks broken. These breaks are very important movements. Because the parities show only two forms of behavior here. The pair reaching the support or resistance level; either quickly returns as described above, or passes this level and continues on its way quickly. The movement of the parities passing this level is generally referred to as breaking. It is very important to estimate these movements while making a transaction. Let's look at how the levels of support and resistance are expressed in the graphics. Support and resistance levels are often represented in the charts by candlestick shadows. The support level in the chart above is around 1.20. The EUR / CHF parity is having difficulty getting below this level.
 The graphic above shows a resistance level of around 1.29.
How to Understand Whether Support and Resistance Is Broken?
There is no definitive answer to this question. Whether the support or resistance levels are broken only becomes clear when closing above or below these levels. It should not be forgotten that if the support or resistance breaks, these levels will change places, the broken support will turn into resistance, and the broken resistance will turn into support. The graphic above shows how support and resistance levels are displaced.
 Again in the chart above, we can see how the levels of support and resistance have changed over time.
Other things to know about support and resistance:
- The longer the prices stop at the support and resistance levels (the longer the trading time), the more it will be valid and the more robust it will be.
- Thinking support and resistance as "regions" rather than concrete numbers will help you more.
- Long term graphics are always more reliable. That is, the support and resistance levels on a weekly chart will be much more robust than the 15-minute chart.
- There may be some question marks in your mind. But don't let this mislead you. By doing a little practice, you can easily predict potential support and resistance levels.
Continue in the iEconomy Academy: Candlestick patterns, Indicators and what they measure.
Frequently asked questions
What is the basic definition of support and resistance in trading?
Support is a price level where a downtrend can pause or reverse due to a concentration of buying interest, acting as a floor. Resistance is a price level where an uptrend can pause or reverse due to a concentration of selling interest, acting as a ceiling.
How do support and resistance levels form in the market?
These levels form through repeated market psychology, where buyers historically enter at support to push prices up and sellers historically enter at resistance to push prices down. They are created by the collective actions of investors reacting to past price highs and lows.
Why are support and resistance considered fundamental to technical analysis?
They are fundamental because they help identify potential trend reversals and continuation patterns, forming the basis for many trading strategies. Analysts use these levels to gauge market sentiment and make probabilistic forecasts about future price movements.
What typically happens when a price breaks through a support or resistance level?
A break through resistance can signal a stronger bullish trend, with the old resistance level potentially becoming new support. Conversely, a break below support can signal a stronger bearish trend, with the old support level potentially becoming new resistance.
iEconomy Academy
This article is a lesson in: Reading a chart · Lesson 2/4
Related News

What Is Compound Interest? Why Starting Early Can Matter More Than the Rate
Compound interest is when your returns start earning returns of their own. Starting early can beat a higher rate — we show the exact math with a worked example.

Candlestick Patterns: Chart Formations and What They Mean
Single, two and three-candle patterns — doji, hammer, bullish engulfing, morning star — with the structure of each, the trend it is looked for in, and an original diagram for every one.

Stock Market Hours and Holidays: NYSE and Nasdaq Guide
A clear reference to regular U.S. stock market hours, pre-market and after-hours trading, early closes, holiday closures, and how bond-market holidays differ.

How to Do Dollar Technical Analysis? What is the Dollar Technical Analysis Chart?
Technical analysis is one of the topics that every prospective investor who wants to invest in the stock market or Forex must know...

What is Iban? What Does E-Iban Do?
The number series that first emerged in European Union countries, which enables money transfer between accounts, is called 'Iban'. E-Iban...

How to make a Binance TR withdrawal? How to make Binance global withdrawals?
We have compiled the answers to the questions of how to make withdrawals from Binance, which takes the leadership seat among...