US stocks lead global sell-off as Europe and Asia slip
US indices fell more sharply than their European peers, while Japan’s Nikkei 225 edged higher. The day leaves a broadly risk-off tone across the major benchmarks, with only one of seven tracked indices in positive territory.
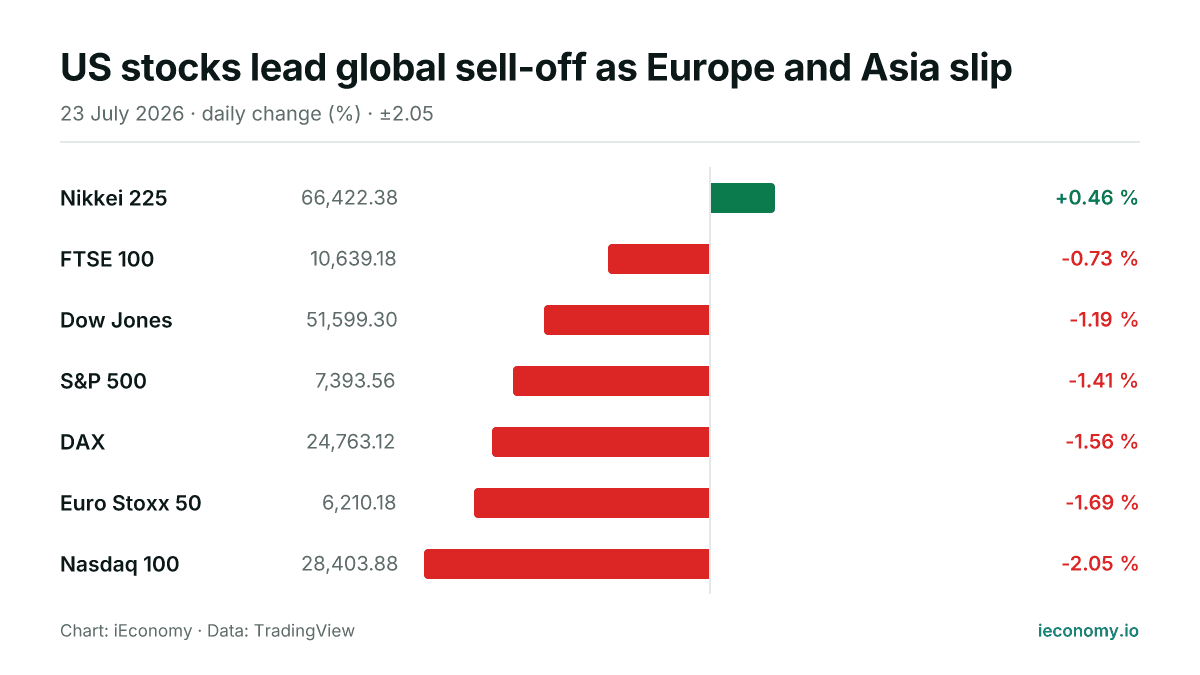
Chart: iEconomy · Data: TradingView
World equity markets were weaker on Thursday, with six of the seven tracked benchmarks lower and only Japan’s Nikkei 225 advancing. The declines were most pronounced in the US and continental Europe, while London’s FTSE 100 also retreated. As a result, the cross-market picture at the moment of writing is one of broad, but uneven, softness rather than a uniform sell-off.
What moved and by how much
In Asia, the Nikkei 225 rose 0.46%. In Europe, the FTSE 100 fell 0.73%, the DAX dropped 1.56% and the Euro Stoxx 50 lost 1.69%. In the US, the Dow Jones was down 1.19%, the S&P 500 fell 1.41% and the Nasdaq 100 declined 2.05%. That leaves the Nasdaq 100 as the weakest of the major indices tracked, while the Nikkei 225 was the only gain of the session so far.
| Instrument | Last | Change |
|---|---|---|
| Nikkei 225 | 66,422.38 | +0.46 % |
| FTSE 100 | 10,639.18 | -0.73 % |
| Dow Jones | 51,599.30 | -1.19 % |
| S&P 500 | 7,393.56 | -1.41 % |
| DAX | 24,763.12 | -1.56 % |
| Euro Stoxx 50 | 6,210.18 | -1.69 % |
| Nasdaq 100 | 28,403.88 | -2.05 % |
The standouts at both ends
At the stronger end, the Nikkei 225’s gain was modest but notable because it contrasted with losses elsewhere. At the weaker end, the Nasdaq 100 showed the largest drop among the indices listed, which matters because it points to heavier pressure in a more growth-sensitive part of the market. Among Europe’s benchmarks, the Euro Stoxx 50 underperformed the FTSE 100, indicating that losses were not confined to one region or sector. The day’s dispersion is therefore as important as the direction.
What a long-term investor should take from it
A single session rarely changes the longer-term story on its own, but it does show how quickly index-level returns can diverge across regions and styles. For long-term investors, the main mechanics to note are that broad equity benchmarks move not just on company news but also on shifts in risk appetite, index composition and sensitivity to different parts of the market. On a day like this, the practical lesson is to treat one move as part of a wider sequence rather than a standalone signal, while recognising that volatility can be concentrated in the same names or sectors across multiple sessions.
Sources
Related News
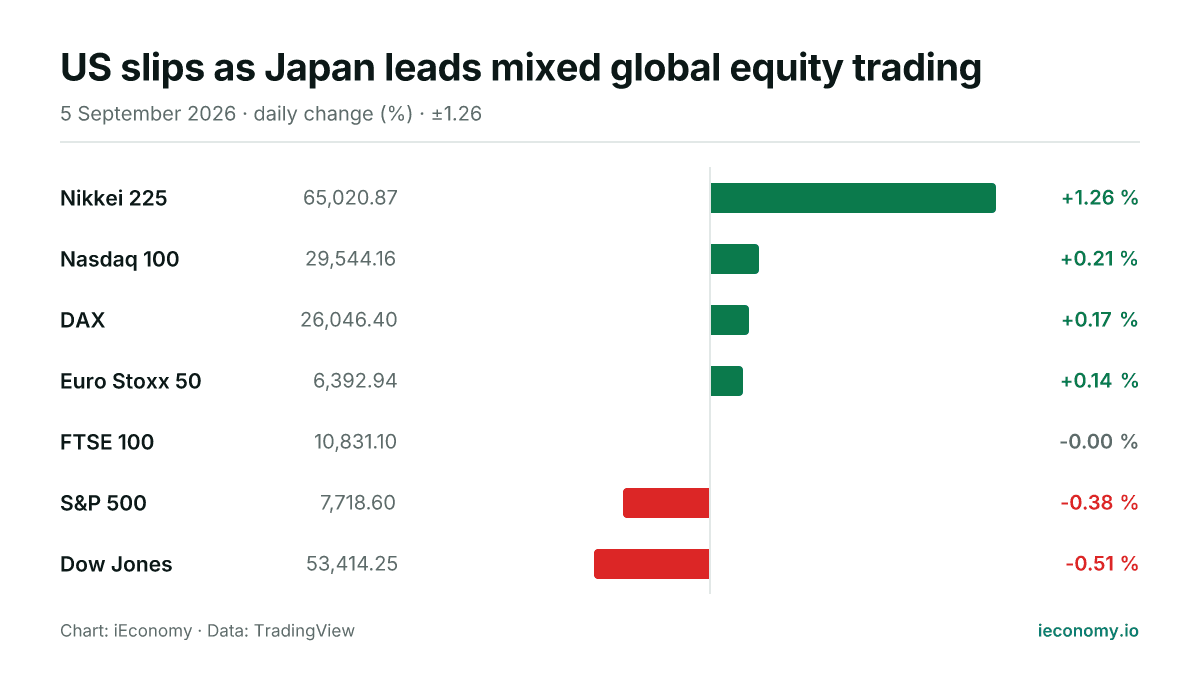
US slips as Japan leads mixed global equity trading
World equities were mixed on 2026-09-05, with Japan leading gains and US benchmarks mostly weaker. Europe edged higher, while the FTSE 100 was flat as the Dow and S&P 500 lagged.
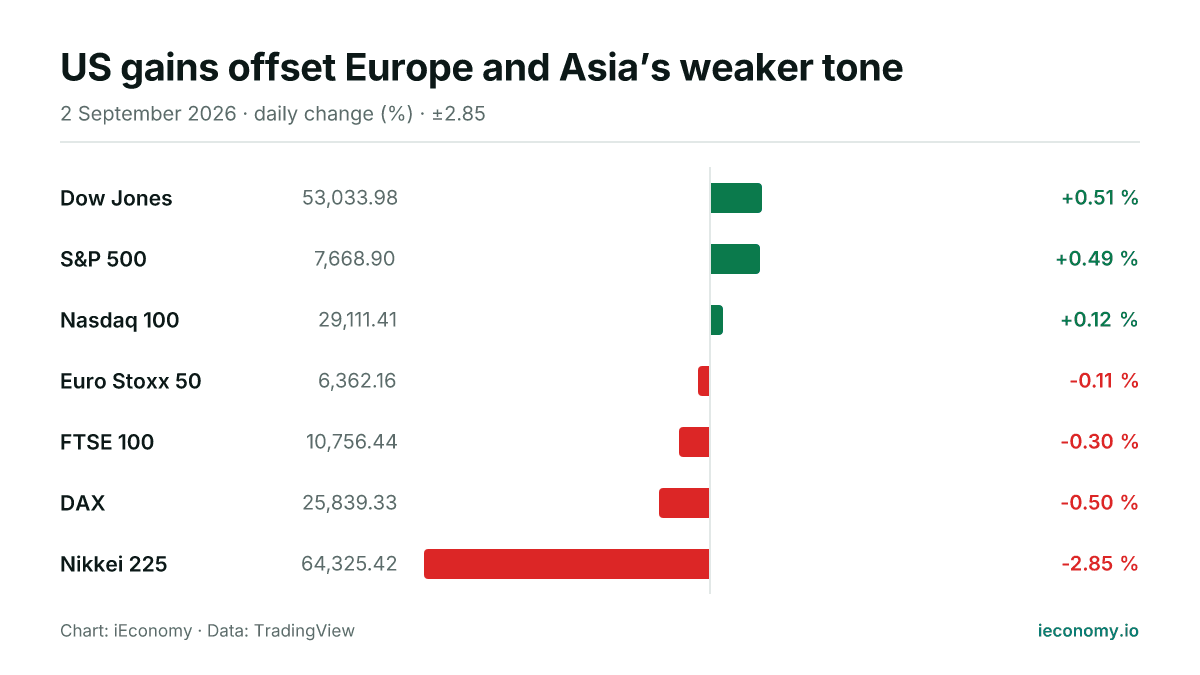
US gains offset Europe and Asia’s weaker tone
US equities advanced modestly while European benchmarks edged lower and Japan’s Nikkei 225 fell sharply. The day left three of seven tracked indices higher, with the strongest move still concentrated in Tokyo.
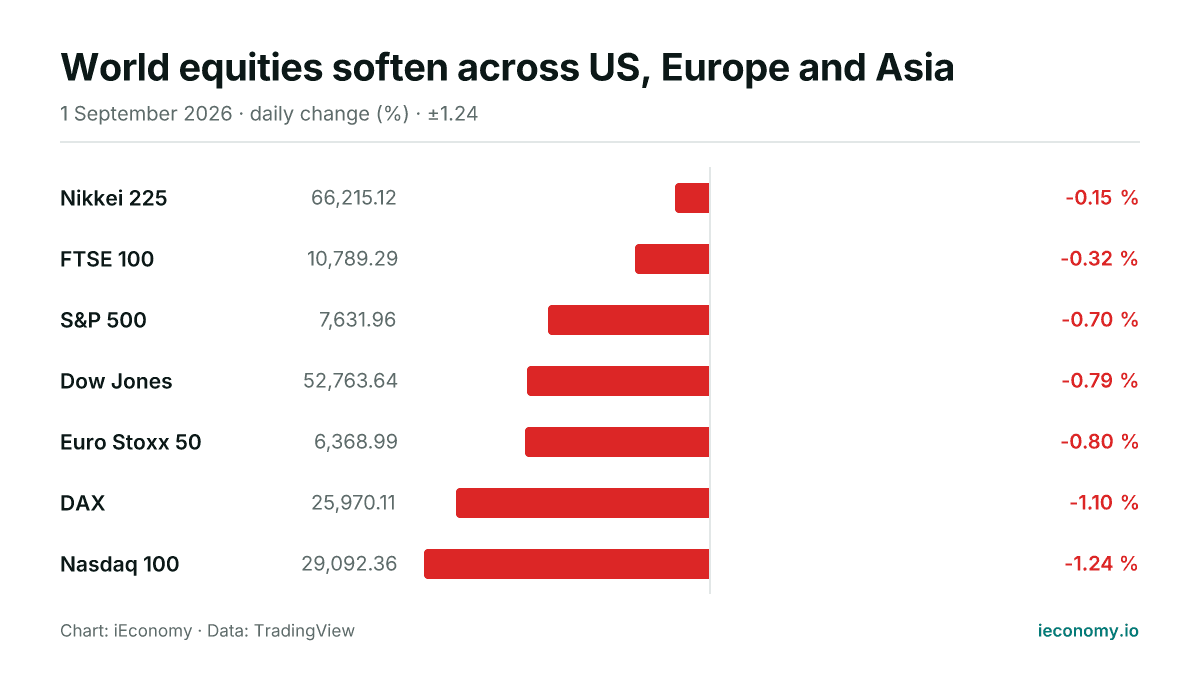
World equities soften across US, Europe and Asia
All seven tracked equity benchmarks were lower or flat on Tuesday, with US growth shares lagging and Europe also under pressure. The move was broad rather than concentrated, leaving no market in positive territory.
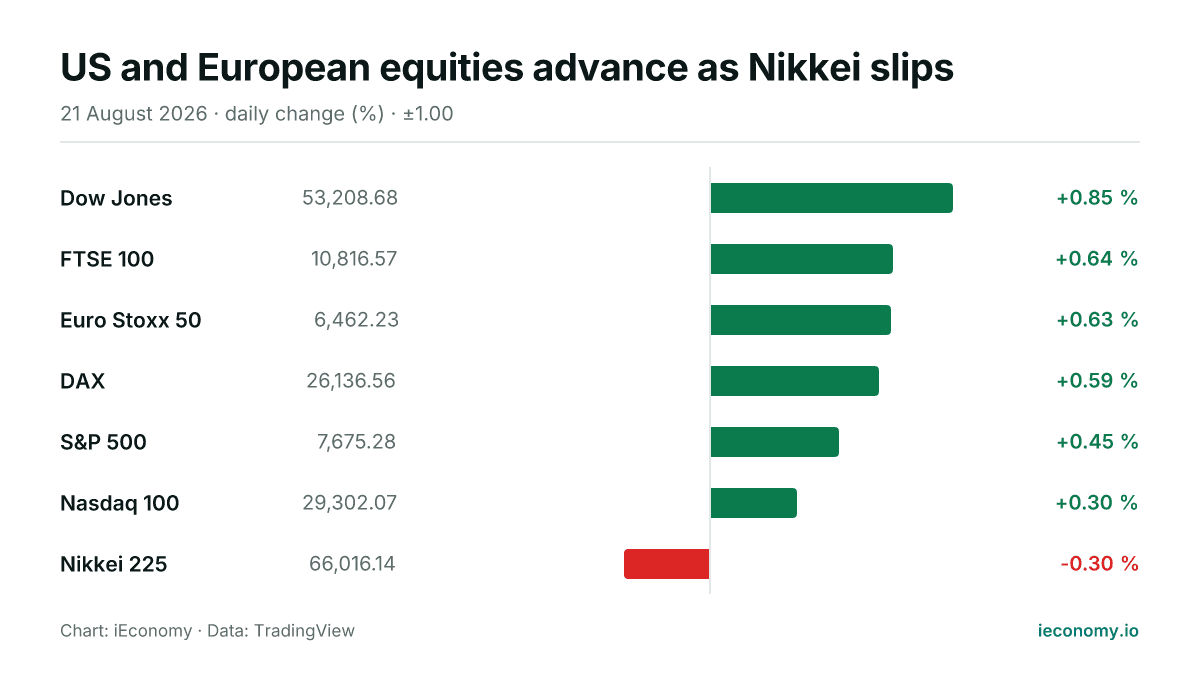
US and European equities advance as Nikkei slips
World equity markets were mostly firmer on Friday, with US and European benchmarks higher and Japan's Nikkei 225 lower. The moves were broad but modest, leaving risk appetite positive without being one-directional.
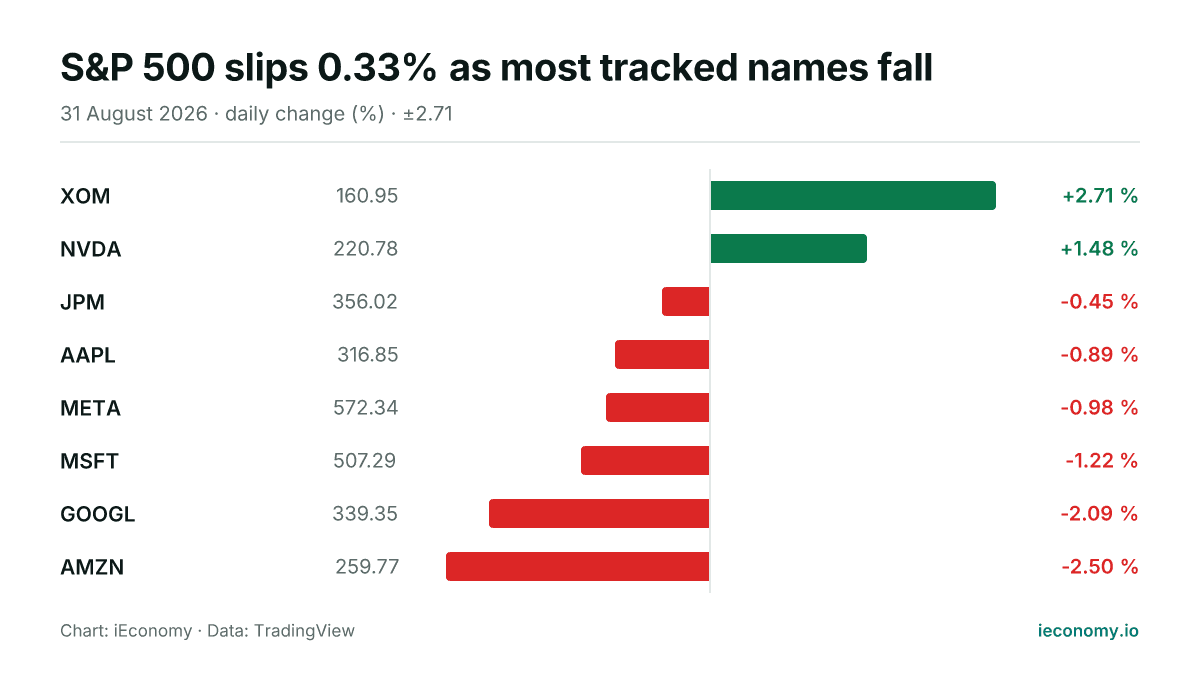
S&P 500 slips 0.33% as most tracked names fall
The S&P 500 ended Monday at 7,686.14, down 0.33% on the session. In the small set of tracked constituents, six fell and two rose, with Exxon Mobil the strongest and Amazon the weakest.
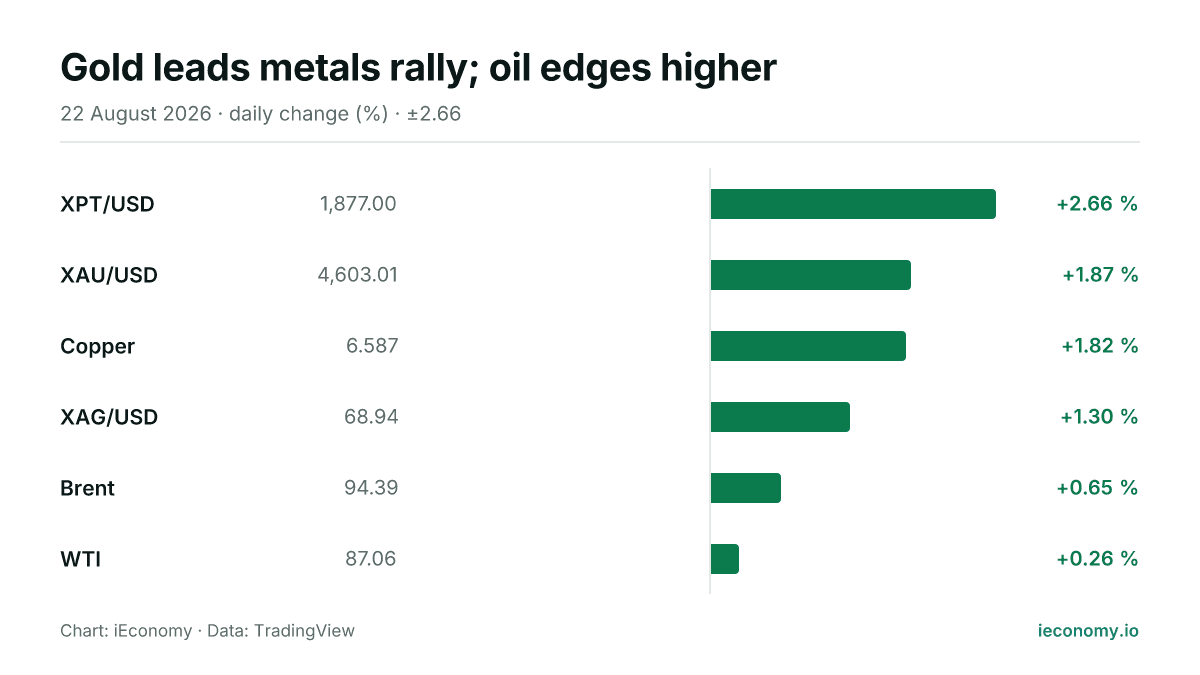
Gold leads metals rally; oil edges higher
Gold and silver advanced alongside crude oil in a broad commodity move on Saturday, with all six tracked instruments higher. Gold led the precious-metals complex, while Brent and WTI posted more modest gains.