Europe advances as US stays mixed and Asia sells off
European indices rose, US benchmarks were mixed and Asia was weaker in Saturday’s trading snapshot. The DAX led gains while the Nikkei 225 was the sharpest decliner, leaving the Nasdaq 100 the only major US index in negative territory.
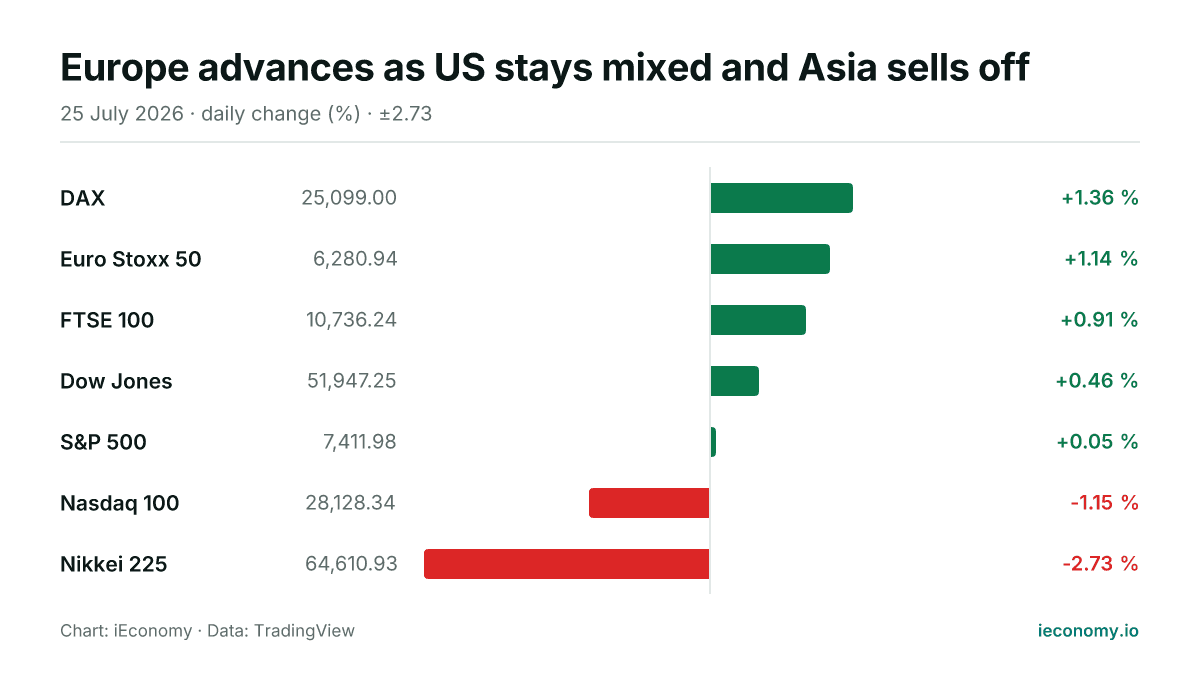
Chart: iEconomy · Data: TradingView
Global equity trading was mixed in the Saturday snapshot dated 2026-07-25. European benchmarks were firmer across the board, US indices were split between modest gains and a decline in the Nasdaq 100, and Asia was weaker, with the Nikkei 225 the clearest laggard. The pattern left five of the seven tracked indices higher and two lower.
What moved and by how much
In Europe, the DAX rose 1.36% to 25,099.00, the Euro Stoxx 50 added 1.14% to 6,280.94 and the FTSE 100 gained 0.91% to 10,736.24. In the US, the Dow Jones advanced 0.46% to 51,947.25 and the S&P 500 inched up 0.05% to 7,411.98, while the Nasdaq 100 fell 1.15% to 28,128.34. In Asia, the Nikkei 225 dropped 2.73% to 64,610.93.
| Instrument | Last | Change |
|---|---|---|
| DAX | 25,099.00 | +1.36 % |
| Euro Stoxx 50 | 6,280.94 | +1.14 % |
| FTSE 100 | 10,736.24 | +0.91 % |
| Dow Jones | 51,947.25 | +0.46 % |
| S&P 500 | 7,411.98 | +0.05 % |
| Nasdaq 100 | 28,128.34 | -1.15 % |
| Nikkei 225 | 64,610.93 | -2.73 % |
The standouts at each end
The DAX was the strongest of the tracked indices, while the Nikkei 225 was the weakest, with a gap of more than four percentage points between them. Among the US benchmarks, the Dow Jones outperformed the broader S&P 500, but the Nasdaq 100 moved in the opposite direction and stood out on the downside. That split matters because index moves are mechanically shaped by sector and stock composition, so a broad headline such as “US markets were higher” can obscure meaningful differences underneath.
What a long-term investor should take from one day
One session tells investors more about relative positioning than about any lasting trend. A rise in one index and a fall in another can reflect the way individual sectors, weighting schemes and trading flows interact, rather than a change in the underlying long-term story. For a longer horizon, the useful read-through is that market leadership can rotate quickly across regions and styles, so single-day moves should be treated as noise unless they persist across several sessions.
Sources
Related News
World equities mixed as Europe edges up, US slips
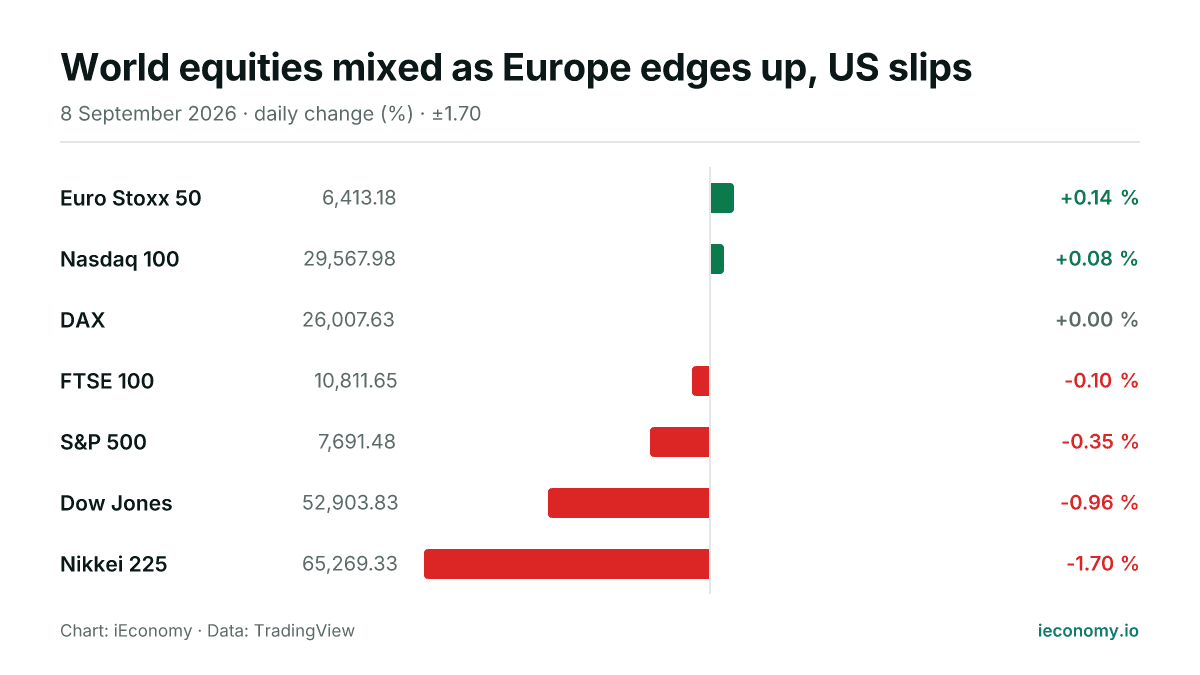
European shares were modestly firmer, US indices were mixed to lower, and Tokyo lagged. The day’s moves were small in much of Europe but sharper in the US and Japan, showing uneven risk appetite.
Nikkei leads as US stocks slip; Europe mixed
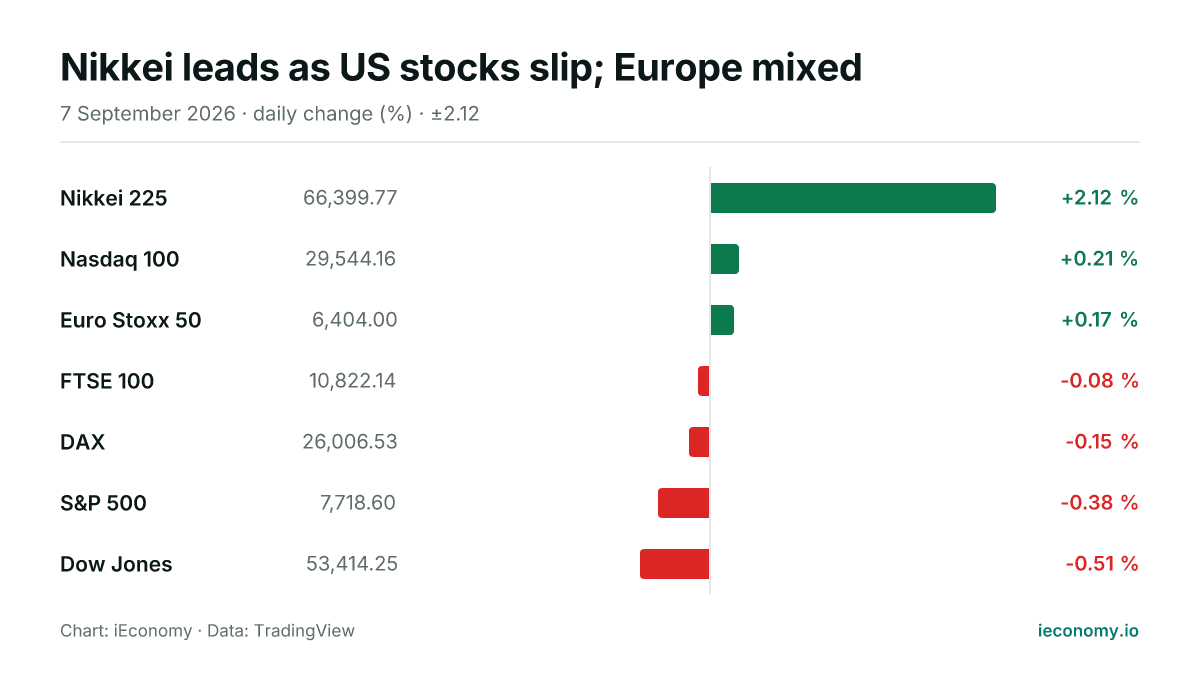
Asian equities outperformed on Monday, with the Nikkei 225 rising sharply while US benchmarks traded lower and Europe was mixed. The day’s moves were modest in most markets, but the gap between Japan and Wall Street stood out.
US slips as Japan leads mixed global equity trading
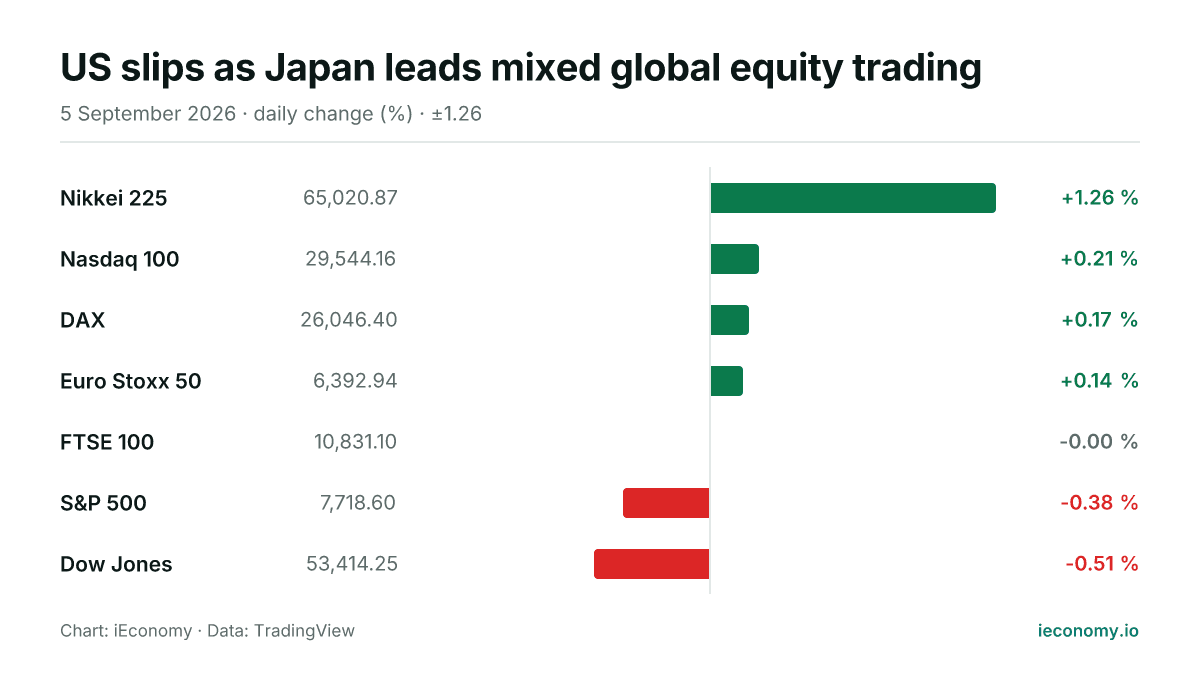
World equities were mixed on 2026-09-05, with Japan leading gains and US benchmarks mostly weaker. Europe edged higher, while the FTSE 100 was flat as the Dow and S&P 500 lagged.
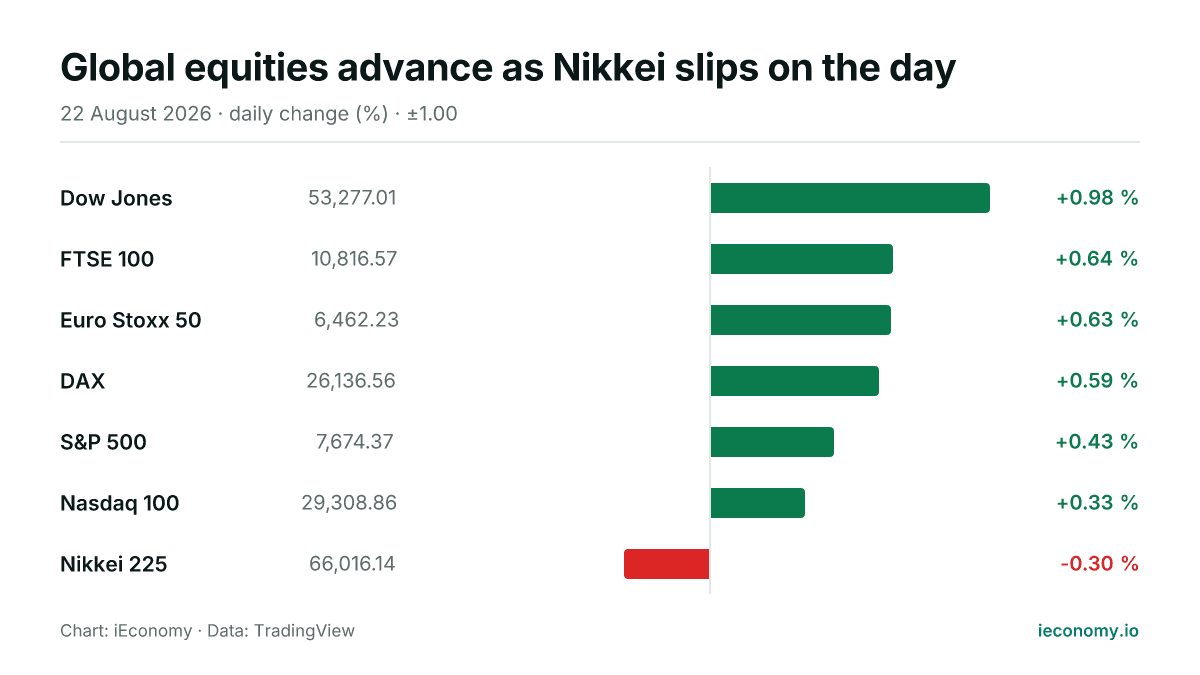
Global equities advance as Nikkei slips on the day
Most major US and European indices moved higher on Saturday, with the Dow Jones leading the gains. In Asia, the Nikkei 225 was the only decliner among the benchmarks tracked.
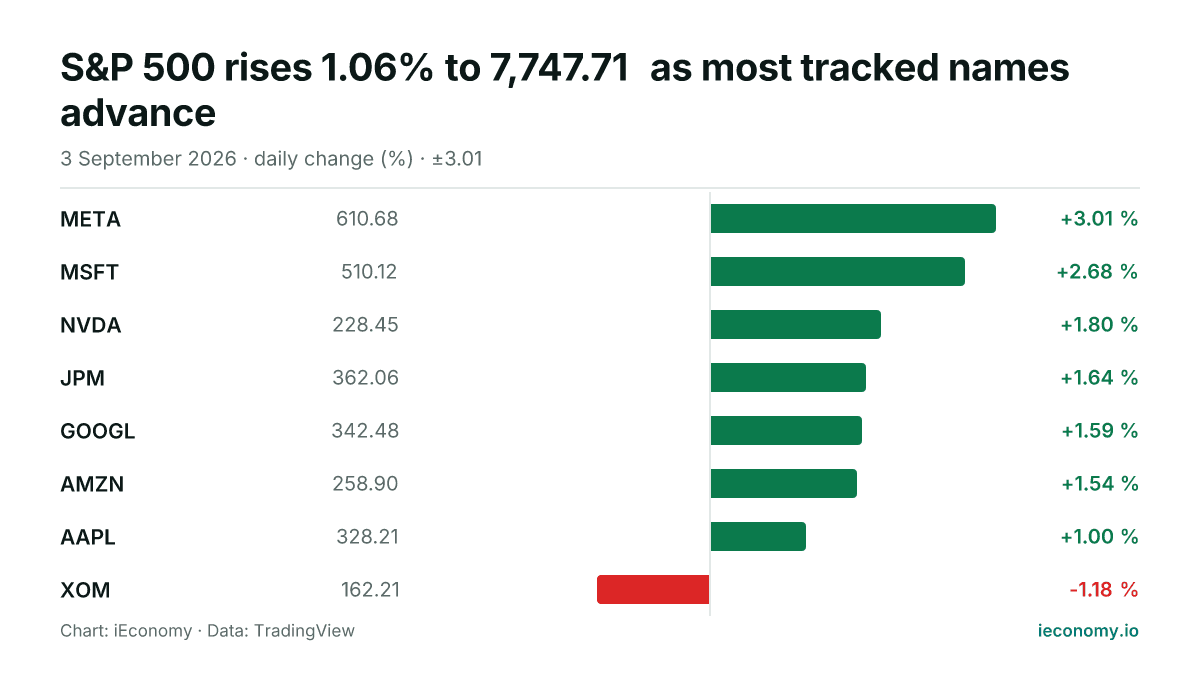
S&P 500 rises 1.06% to 7,747.71 as most tracked names advance
The S&P 500 finished Thursday higher, with 7 of 8 tracked constituents in positive territory. META was the strongest performer, while XOM was the only decliner among the names tracked in the digest.
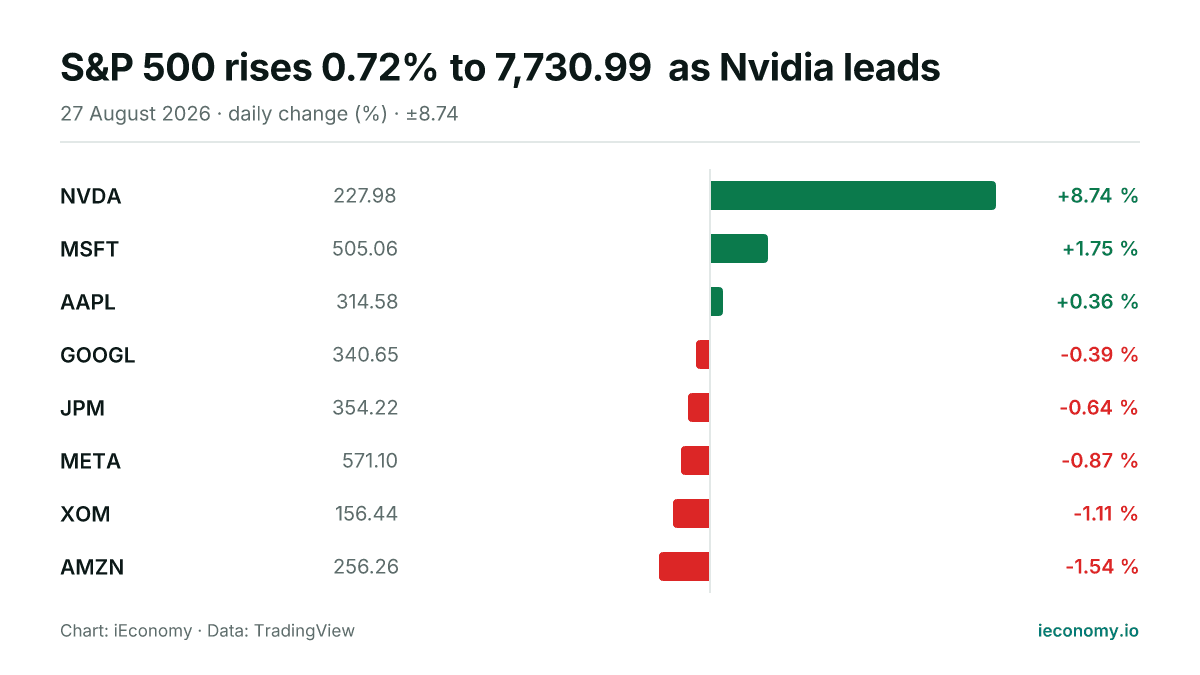
S&P 500 rises 0.72% to 7,730.99 as Nvidia leads
The S&P 500 advanced on Thursday, with a narrow majority of tracked constituents higher. Nvidia was the strongest performer, while Amazon lagged the group.