World equities rise, led by Nikkei 225 jump on Friday
US, European and Asian indices were mostly higher on Friday, with the Nikkei 225 far ahead of the pack and the FTSE 100 the lone decliner. The moves were modest across most benchmarks, pointing to a broadly firmer but uneven session.
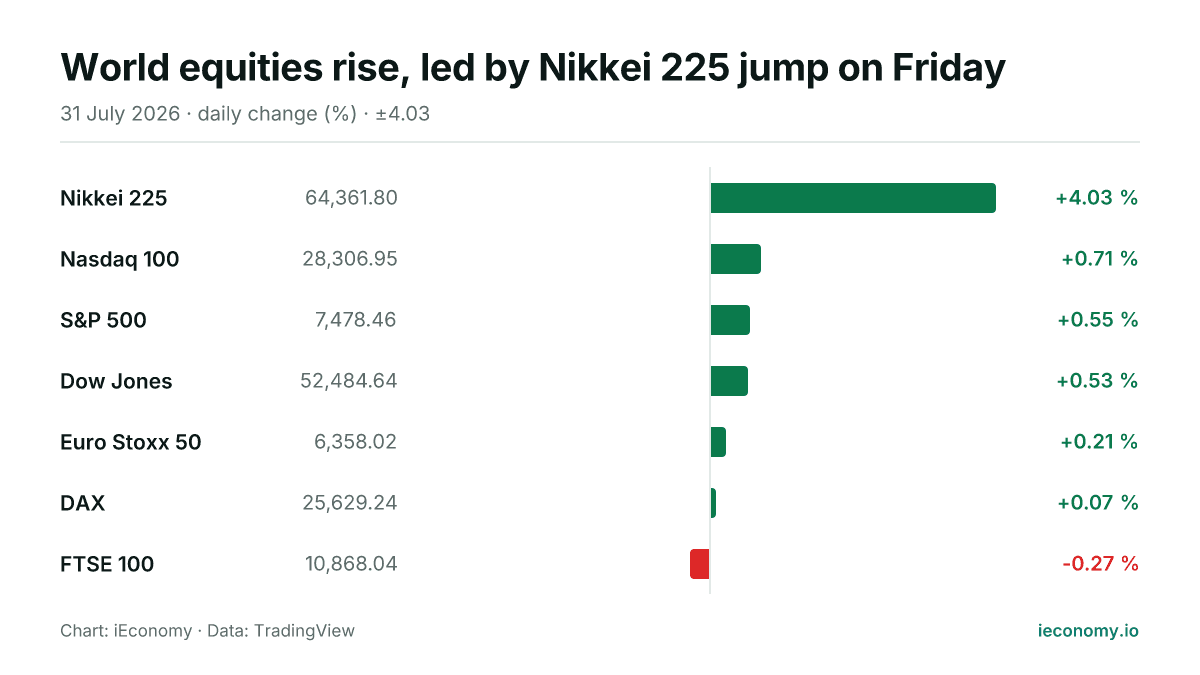
Chart: iEconomy · Data: TradingView
World equity markets were broadly firmer on Friday, with six of the seven indices tracked higher and only the FTSE 100 lower. The tone was strongest in Asia, where the Nikkei 225 outpaced the rest of the field, while US benchmarks advanced in a narrower range and European indices were close to unchanged by comparison.
What moved and by how much
The Nikkei 225 rose 4.03% to 64,361.80, making it the clear leader among the indices tracked. In the US, the Nasdaq 100 gained 0.71%, the S&P 500 added 0.55% and the Dow Jones climbed 0.53%. In Europe, the Euro Stoxx 50 increased 0.21% and the DAX edged 0.07% higher, while the FTSE 100 fell 0.27%.
| Instrument | Last | Change |
|---|---|---|
| Nikkei 225 | 64,361.80 | +4.03 % |
| Nasdaq 100 | 28,306.95 | +0.71 % |
| S&P 500 | 7,478.46 | +0.55 % |
| Dow Jones | 52,484.64 | +0.53 % |
| Euro Stoxx 50 | 6,358.02 | +0.21 % |
| DAX | 25,629.24 | +0.07 % |
| FTSE 100 | 10,868.04 | -0.27 % |
The standouts at both ends
The day’s positive extreme was the Nikkei 225, which moved much more sharply than the other benchmarks and set the pace for global risk sentiment. At the other end, the FTSE 100 was the only index in the red, and its decline was modest relative to the Nikkei’s advance. The US averages sat between those poles, with all three finishing higher but without the same momentum seen in Japan.
What a long-term investor should take from one day
For longer-term investors, a single session mainly shows how returns can be distributed unevenly across regions even when the broad direction is positive. The mechanics matter: index moves reflect the weighted performance of their constituents, so a strong rise in one market does not imply the same strength everywhere. On a day like this, the key risk is overreading short-term variation; the more useful takeaway is that global equity leadership can shift from one region to another within the same session.
Sources
Related News

US and Europe rise as Nikkei lags on Sunday
Most major equity benchmarks advanced on Sunday, with gains spread across the US and Europe. Asia was mixed, and the Nikkei 225 stood out on the downside.

Global equities ease; Nikkei edges higher
US and European indices were lower in Thursday trading, while Asia was mixed. The Nikkei 225 rose modestly, leaving one gain against six declines across the seven markets tracked.
Global equities slip across US, Europe and Asia
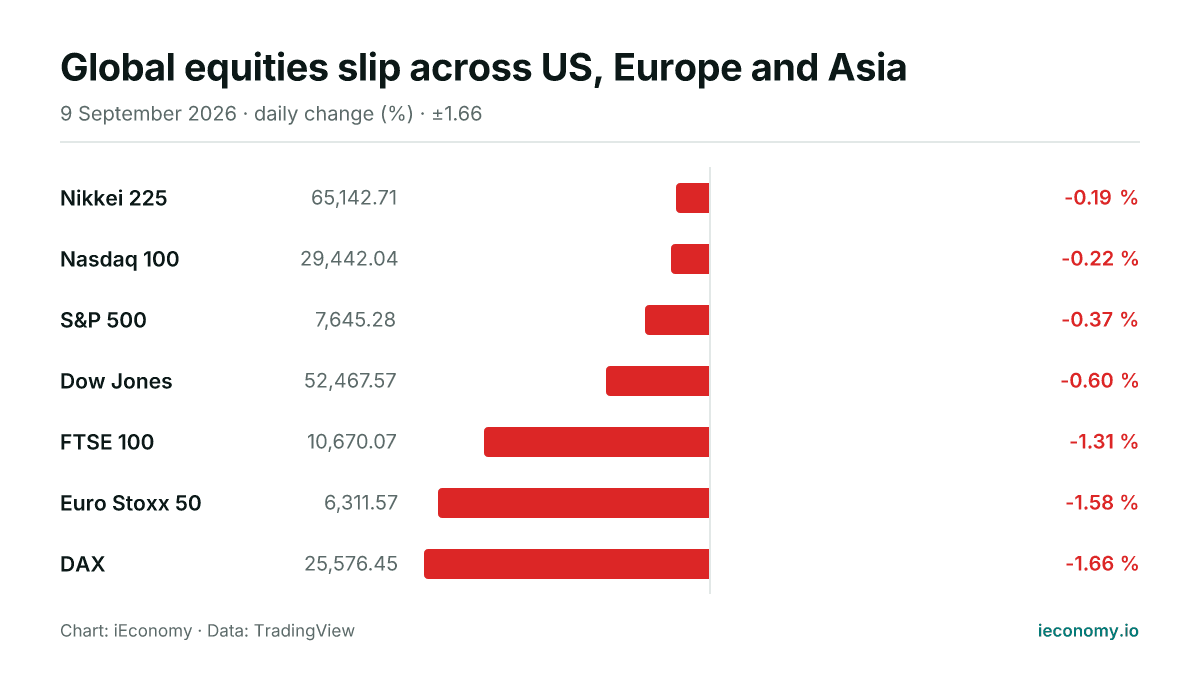
All seven tracked indices were lower or flat on Wednesday, with Europe leading the declines and the Dow among the weakest in the US. The session was broadly risk-off, but only the price action itself is visible here.
S&P 500 rises 0.65% as five of eight tracked stocks advance
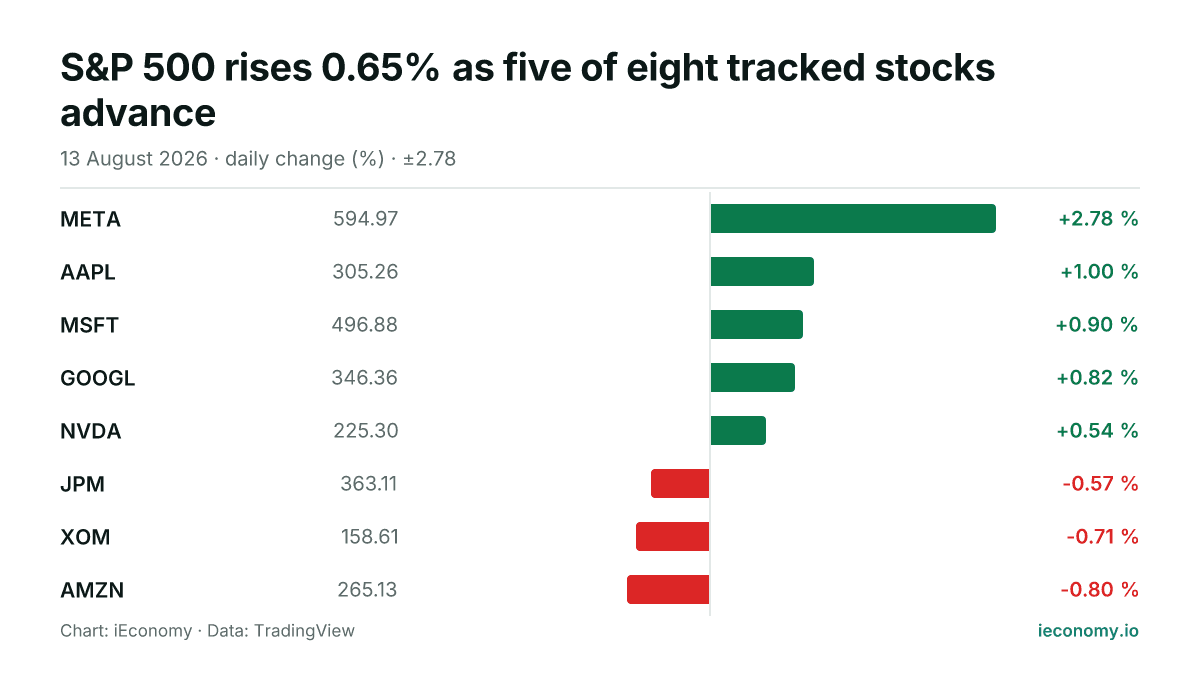
The S&P 500 ended Thursday, 2026-08-13, at 7,798.99, up 0.65% on the day. Among the eight constituents tracked in the digest, five finished higher and three lower, with META the strongest and AMZN the weakest.
Global shares mixed as Tokyo gains, Wall Street slips
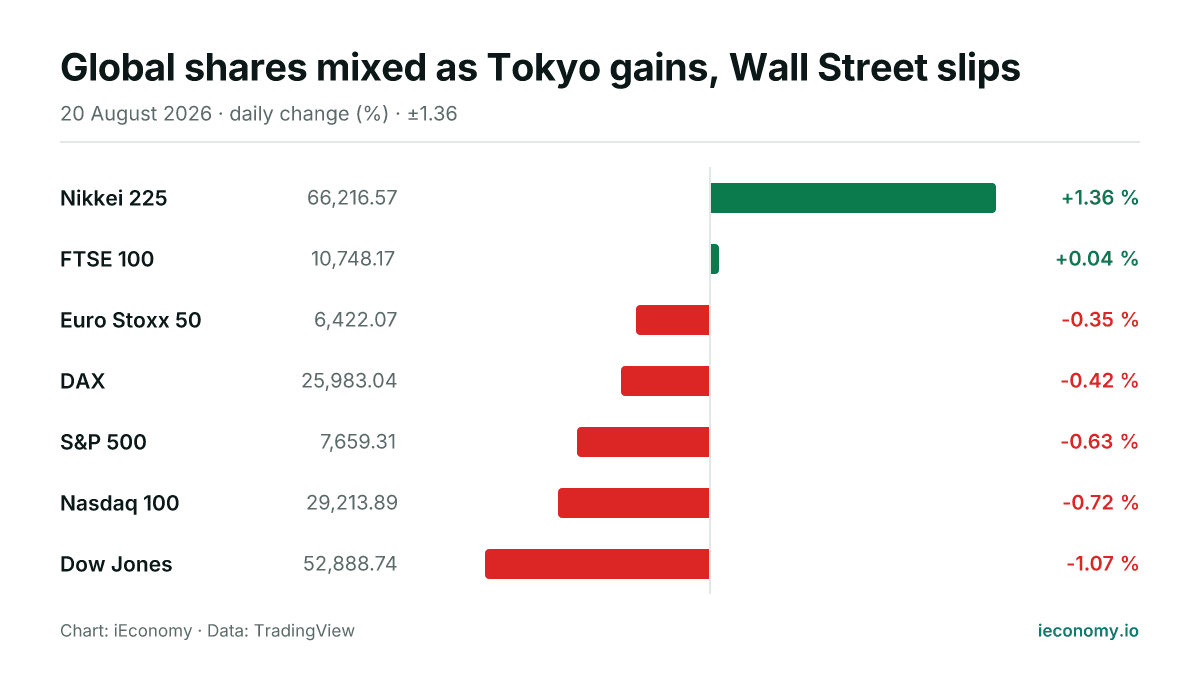
Asian equities were firmer and Europe was little changed to lower, while US indices traded lower. The day’s pattern showed rotation rather than a broad-risk selloff, with only two of seven benchmarks advancing.
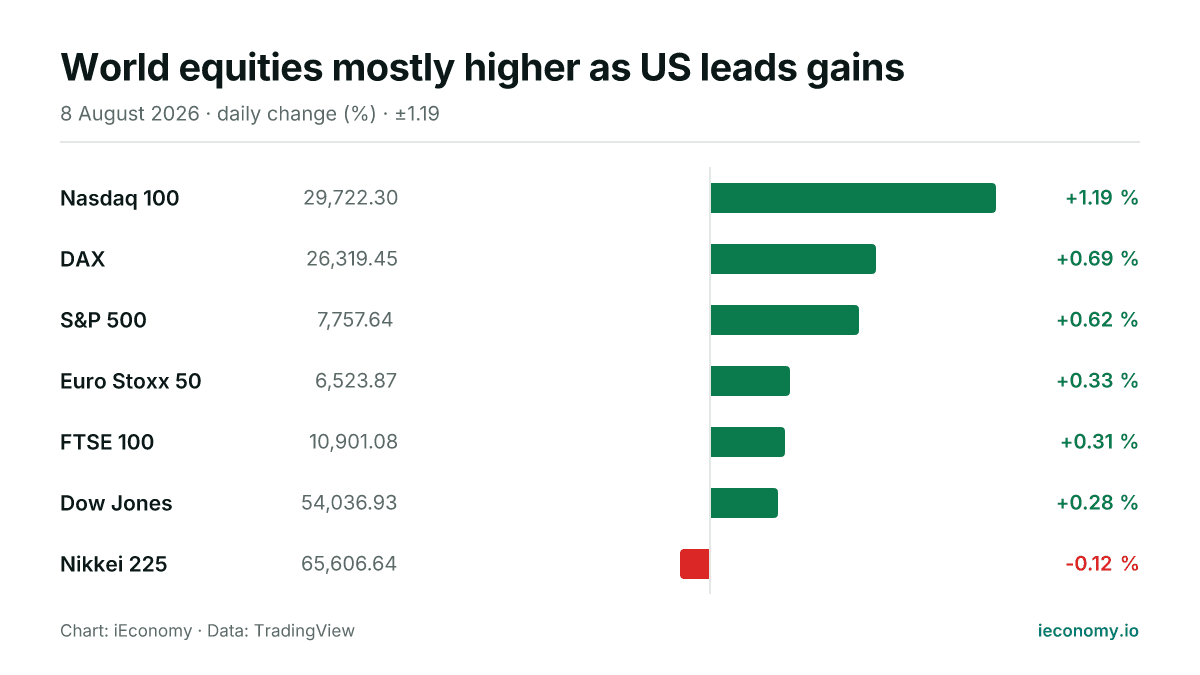
World equities mostly higher as US leads gains
Global stock markets were broadly firmer on Saturday, with six of seven tracked indices in positive territory. The Nasdaq 100 outperformed, while the Nikkei 225 was the only major gauge to edge lower.