Global equities ease; Nikkei edges higher
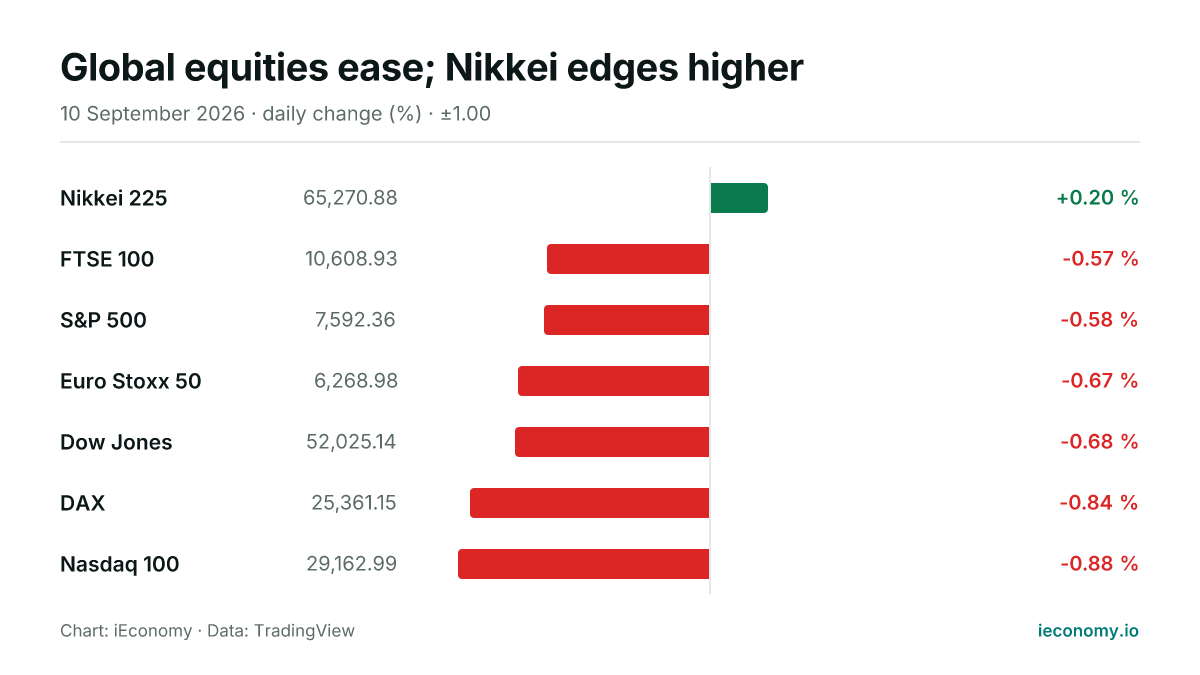
US and European indices were lower in Thursday trading, while Asia was mixed. The Nikkei 225 rose modestly, leaving one gain against six declines across the seven markets tracked.

Américo Toledano / Wikimedia Commons (cc-by-sa-4.0)
Global equity markets were broadly weaker on Thursday, with six of the seven tracked indices in negative territory and only the Nikkei 225 higher. The move pattern points to uneven risk appetite rather than a single-direction selloff, with losses concentrated across the US and Europe.
What moved and by how much
The Nikkei 225 outperformed with a rise of 0.20%, while the FTSE 100 fell 0.57% and the S&P 500 lost 0.58%. That left Asia marginally firmer at the top end, but the main tone across developed markets was softer.
| Instrument | Last | Change |
|---|---|---|
| Nikkei 225 | 65,270.88 | +0.20 % |
| FTSE 100 | 10,608.93 | -0.57 % |
| S&P 500 | 7,592.36 | -0.58 % |
| Euro Stoxx 50 | 6,268.98 | -0.67 % |
| Dow Jones | 52,025.14 | -0.68 % |
| DAX | 25,361.15 | -0.84 % |
| Nasdaq 100 | 29,162.99 | -0.88 % |
In continental Europe, the Euro Stoxx 50 declined 0.67% and the DAX dropped 0.84%. In the US, the Dow Jones slid 0.68% and the Nasdaq 100 underperformed with a fall of 0.88%, showing the broadest weakness in the most growth-sensitive benchmark among the three US gauges tracked.
The standouts at each end
The clearest positive outlier was the Nikkei 225, which stood alone in the green. Its advance was modest, but in a session where every other market in the digest was flat to lower, that relative strength matters for breadth.
At the weaker end, the Nasdaq 100 posted the sharpest decline, followed by the DAX. The gap between the day’s best and worst performers was just over one percentage point, which is enough to show dispersion without suggesting disorderly trading.
What a long-term investor should take from one day
A single session mainly tells investors about short-term positioning and index mechanics. Because equity benchmarks are weighted differently, moves in a smaller number of constituents can matter more in one index than another even when the broader market tone is similar.
For long-term investors, the useful lesson is that cross-market leadership can change quickly from region to region and from growth-heavy to more defensive benchmarks. A weak day does not by itself alter the longer trend; it does, however, underline that diversification can behave differently across indices in the same session.
This article is not investment advice and recommends no asset, level or direction; a single session's move is not evidence of a trend. For background see Markets, Bear Market, BIST 100, and for terms the finance glossary.
Frequently asked questions
Which market was strongest on Thursday?
Which index underperformed the most? The Nasdaq 100 had the largest decline at 0.88%. That is a useful sign of relative weakness within the US complex, where all three tracked benchmarks finished lower.
Which index underperformed the most?
What does the day’s breadth suggest? With one market higher and six lower or flat, breadth was negative. In practical terms, that means losses were widespread rather than confined to a single region, even if the size of the moves was mostly moderate.
Sources
Related News
Global equities slip across US, Europe and Asia
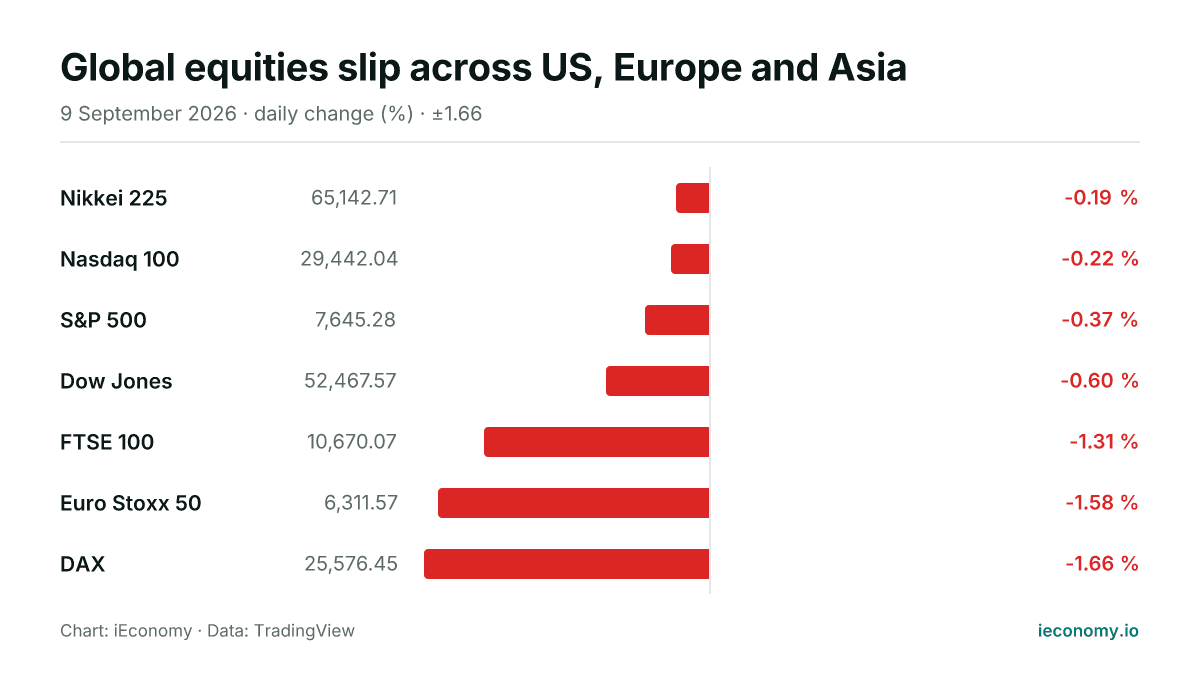
All seven tracked indices were lower or flat on Wednesday, with Europe leading the declines and the Dow among the weakest in the US. The session was broadly risk-off, but only the price action itself is visible here.
Nikkei leads as US stocks slip; Europe mixed
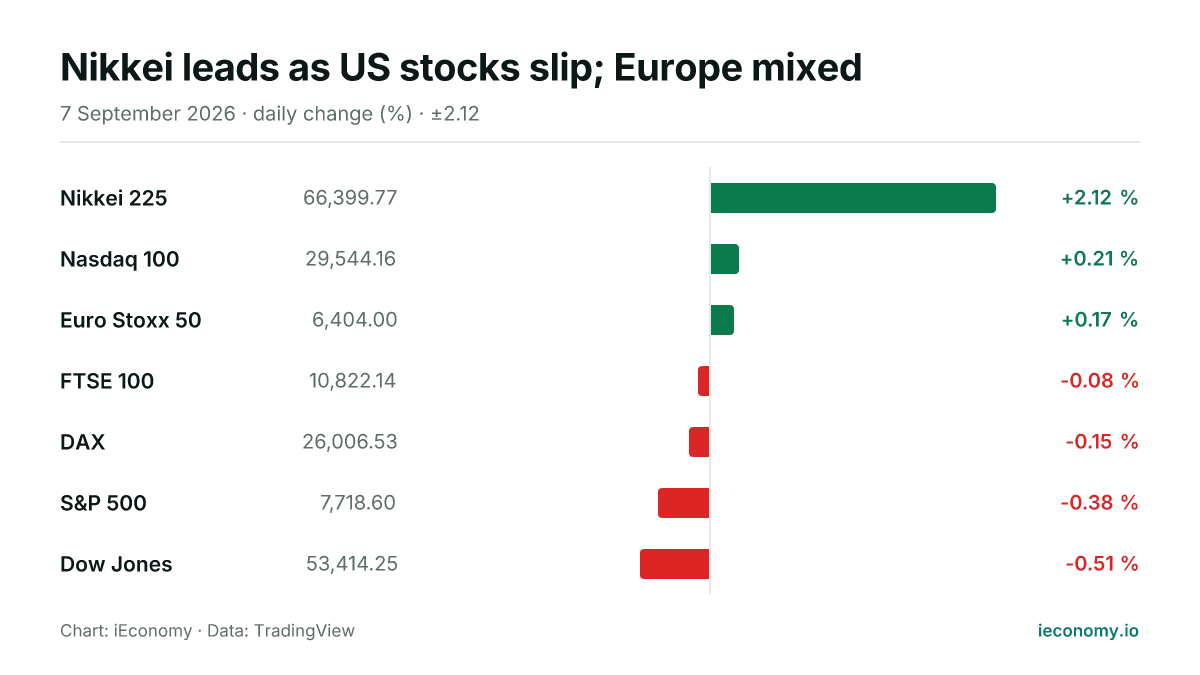
Asian equities outperformed on Monday, with the Nikkei 225 rising sharply while US benchmarks traded lower and Europe was mixed. The day’s moves were modest in most markets, but the gap between Japan and Wall Street stood out.
US slips as Japan leads mixed global equity trading
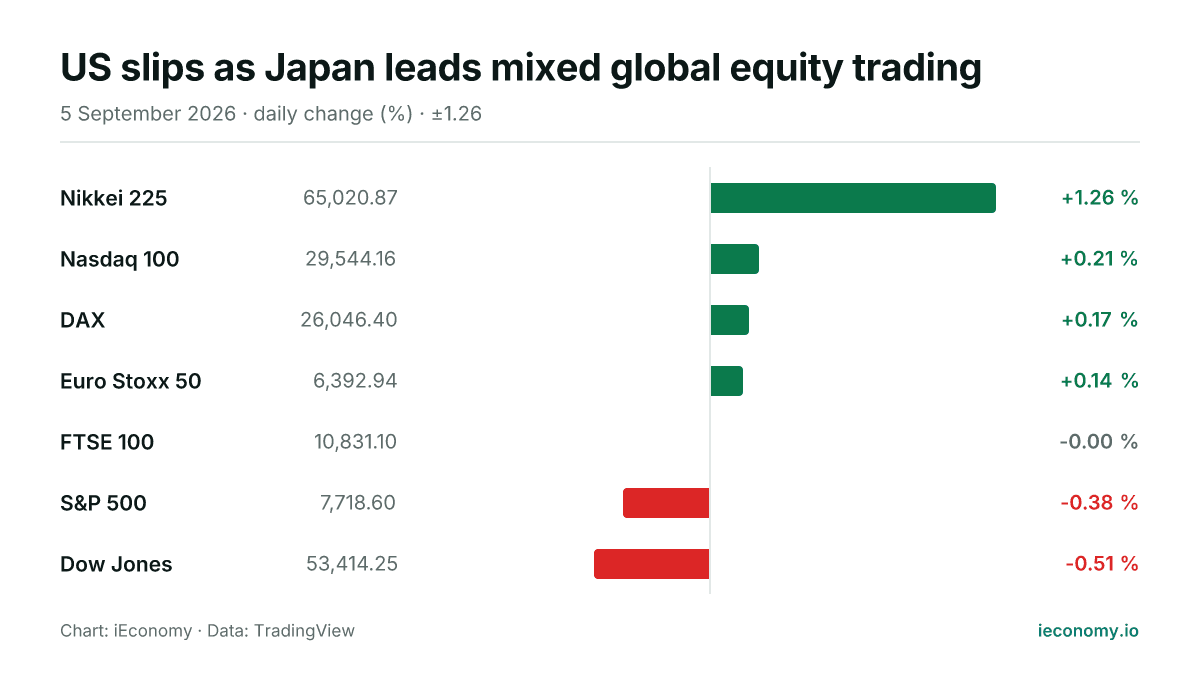
World equities were mixed on 2026-09-05, with Japan leading gains and US benchmarks mostly weaker. Europe edged higher, while the FTSE 100 was flat as the Dow and S&P 500 lagged.
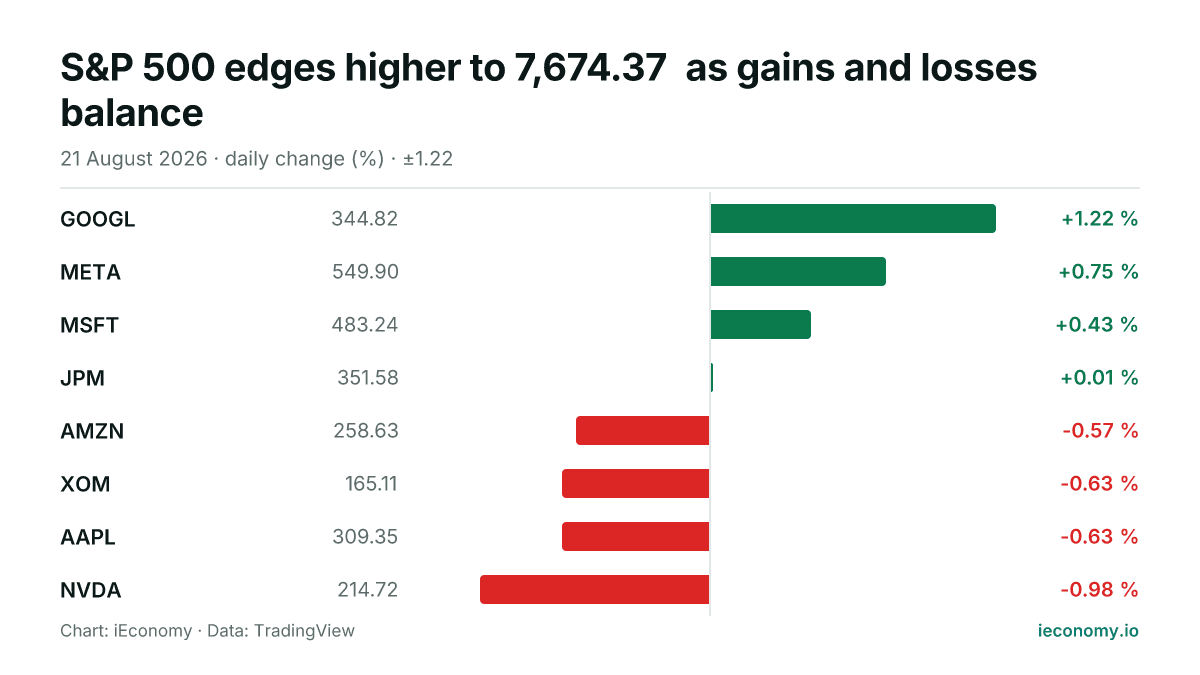
S&P 500 edges higher to 7,674.37 as gains and losses balance
The S&P 500 rose 0.43% to 7,674.37 on Friday. Among the eight tracked constituents, four finished higher and four lower, with GOOGL the strongest and NVDA the weakest.

Crude oil edges higher as Iran tensions keep markets tense
Oil prices rose modestly as renewed U.S.-Iran military action and threats around the Strait of Hormuz kept traders focused on potential supply disruption.
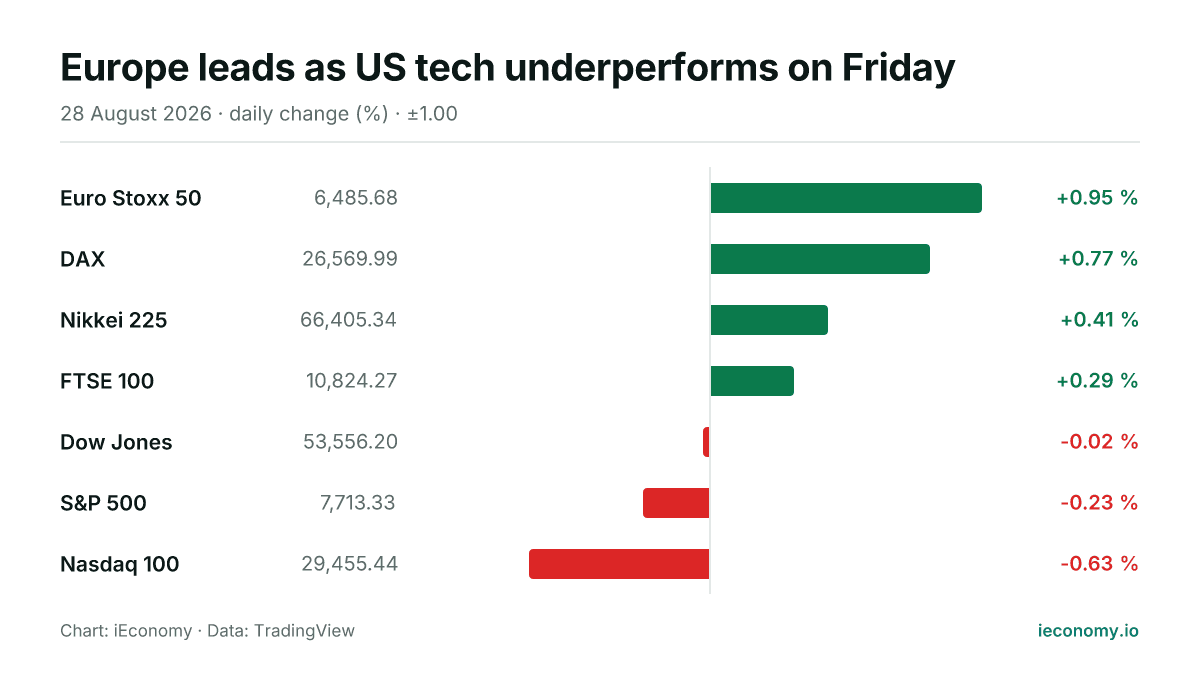
Europe leads as US tech underperforms on Friday
European and Asian benchmarks advanced on Friday, while the main US averages were mixed to weaker. The day’s moves were modest in the US and broader in Europe, leaving regional performance uneven.