European shares lag as US indices also ease
World equity markets were mixed to weaker on Monday, with the FTSE 100 edging higher while most US, European and Asian benchmarks slipped. The DAX and Euro Stoxx 50 led declines, though moves remained modest in several cases.
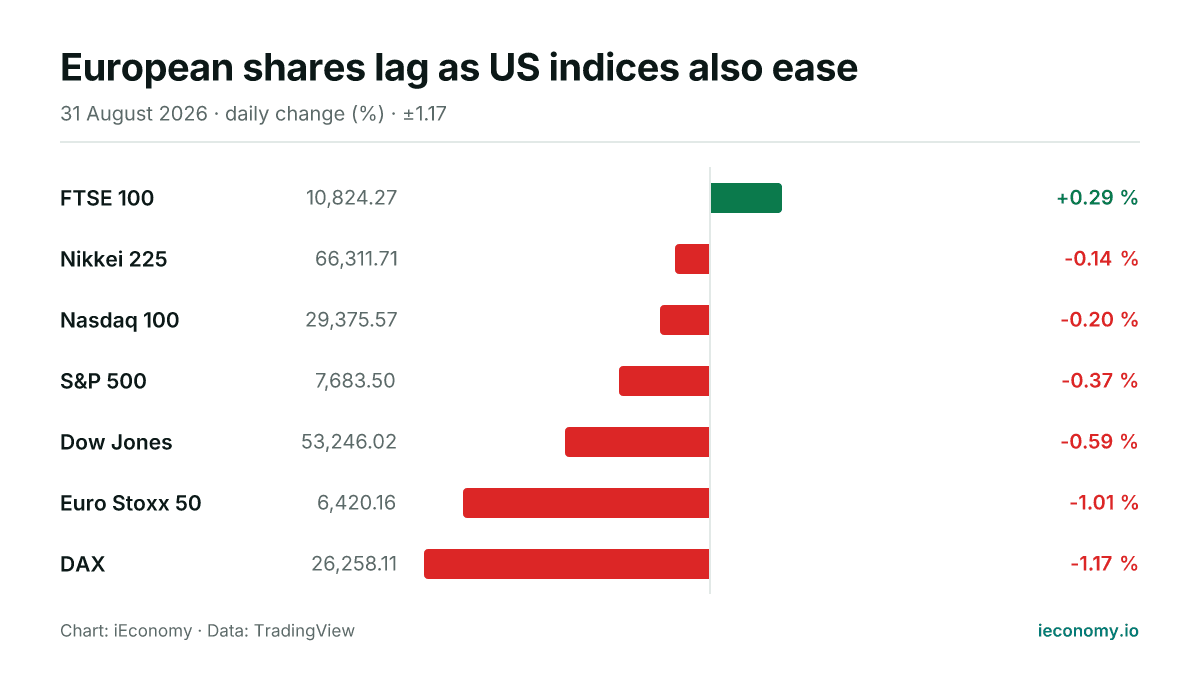
Chart: iEconomy · Data: TradingView
World equity markets were mostly lower on Monday, with six of the seven tracked benchmarks in negative territory. The FTSE 100 was the only riser, while the heaviest pressure came from continental Europe. In the US, all three major indices fell, and the Nikkei 225 also edged down.
What moved and by how much
The FTSE 100 gained 0.29% to 10,824.27, making it the day’s lone advancer. By contrast, the DAX fell 1.17% and the Euro Stoxx 50 lost 1.01%, marking the weakest performance among the major European gauges tracked here.
| Instrument | Last | Change |
|---|---|---|
| FTSE 100 | 10,824.27 | +0.29 % |
| Nikkei 225 | 66,311.71 | -0.14 % |
| Nasdaq 100 | 29,375.57 | -0.20 % |
| S&P 500 | 7,683.50 | -0.37 % |
| Dow Jones | 53,246.02 | -0.59 % |
| Euro Stoxx 50 | 6,420.16 | -1.01 % |
| DAX | 26,258.11 | -1.17 % |
US equities were softer across the board. The Nasdaq 100 declined 0.20%, the S&P 500 slipped 0.37%, and the Dow Jones dropped 0.59%. In Asia, the Nikkei 225 moved 0.14% lower, a smaller fall than most of the European benchmarks.
The standouts at each end
On the upside, the FTSE 100 stood out as the only market to finish higher in the digest. That matters mechanically because even a modest rise can separate a benchmark from a broader regional decline when sector composition and weighting differ.
At the lower end, the DAX and Euro Stoxx 50 led the day’s losses. Among the US indices, the Dow Jones was the weakest, while the Nasdaq 100 held up relatively better than the other two, indicating a milder decline in that part of the market.
What a long-term investor should take from one day
One session does not set a trend, but it can show how broad participation is on a given day. When most major indices move in the same direction, the message is usually about general risk appetite rather than a single market-specific change.
For long-term investors, the key point is that daily moves are normal and vary in size across regions and styles. Index-level changes reflect the mechanics of basket investing: different mixes of sectors, currencies and market structures can cause one benchmark to hold up while others fall.
This article is not investment advice and recommends no asset, level or direction; a single session's move is not evidence of a trend. For background see Markets, Bear Market, BIST 100, and for terms the finance glossary.
Frequently asked questions
Which market was strongest on Monday?
Which indices were under the most pressure? The DAX and Euro Stoxx 50 posted the largest declines, at 1.17% and 1.01% respectively. In the US, the Dow Jones fell the most among the three major indices tracked.
Which indices were under the most pressure?
What should investors infer from a mixed day like this? A mixed day mainly shows dispersion across regions and index construction, not a durable message on its own. Investors typically use it as one data point within a longer sequence, because single-session moves can be noisy and reverse quickly.
Sources
Related News

Crude oil jumps as Gulf conflict flares again
Oil prices rose sharply after renewed U.S. strikes on Iran and Iranian retaliation revived fears over the Strait of Hormuz and wider supply disruption in the Gulf.
Oil climbs as gold and silver ease on Monday
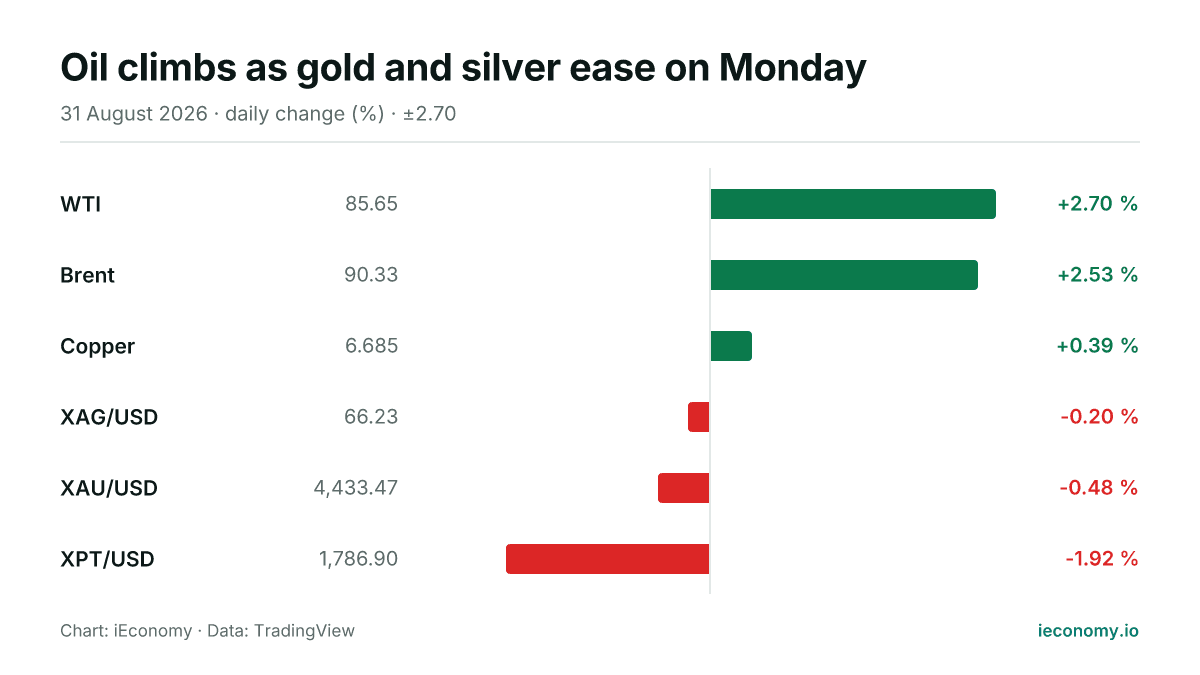
Crude oil advanced on Monday while gold and silver slipped, leaving the complex mixed across the day. The moves were modest in bullion and sharper in energy, with copper also firmer.
Europe leads as US tech slips, Asia edges higher
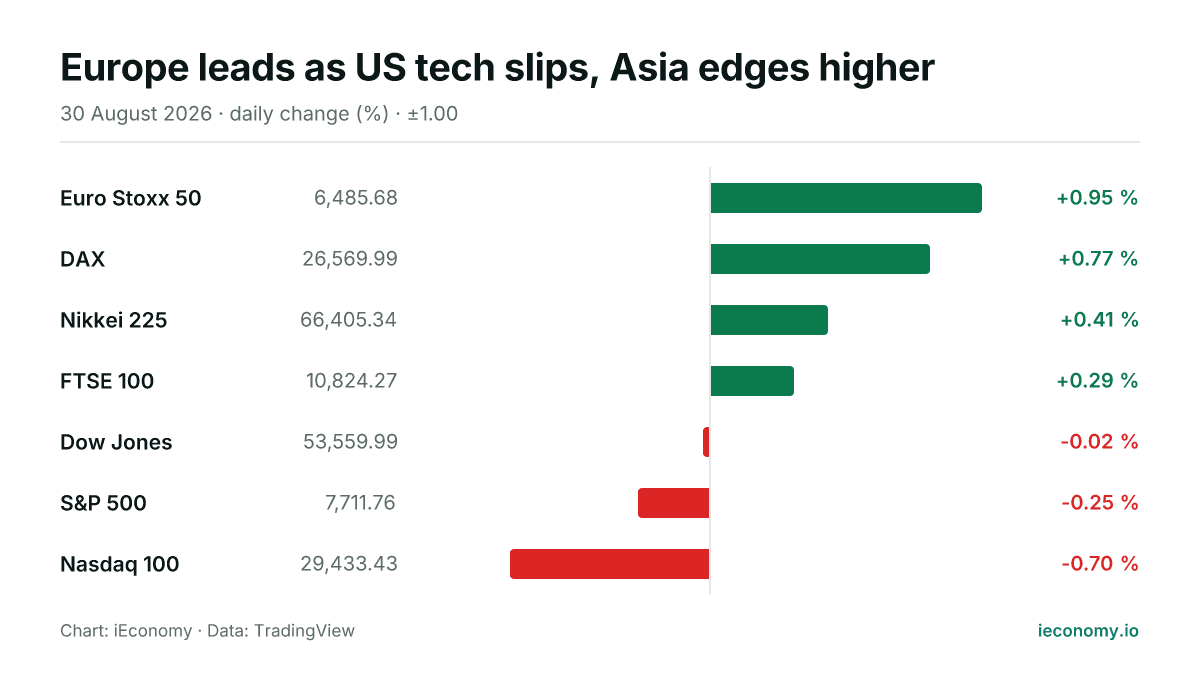
European benchmarks outperformed on Sunday, while Asian equities were firmer and the main US averages finished lower. The day’s moves were modest in some cases, but the spread between winners and laggards was clear.
Europe advances as US stays mixed and Asia sells off
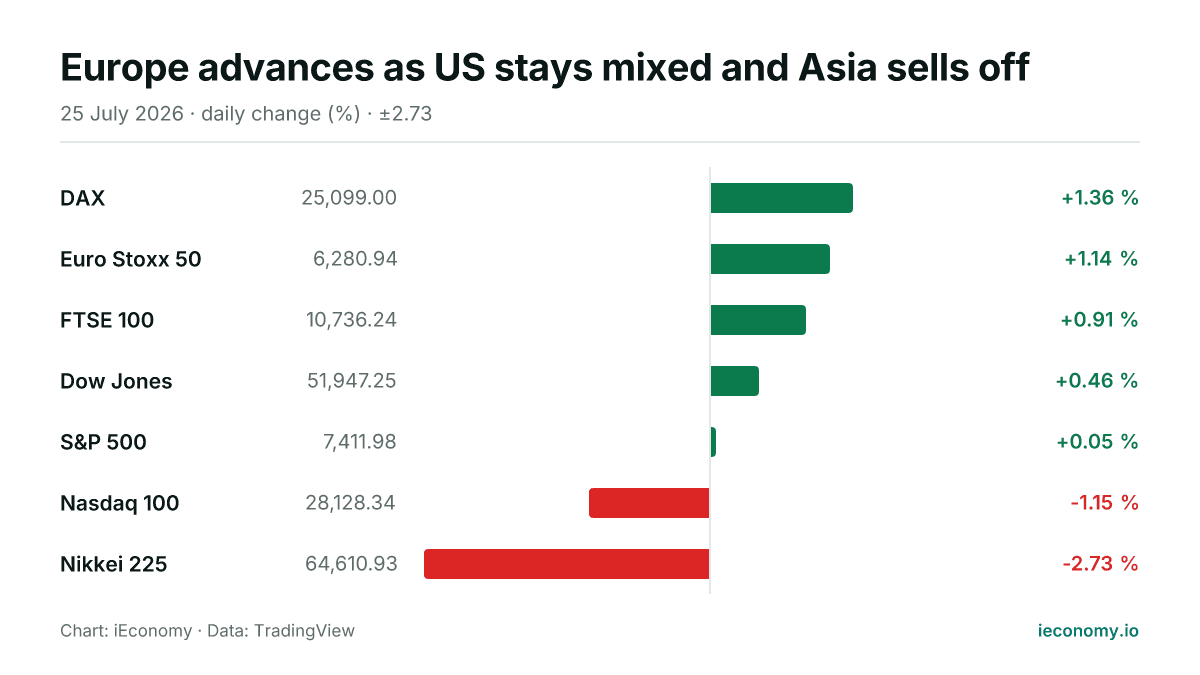
European indices rose, US benchmarks were mixed and Asia was weaker in Saturday’s trading snapshot. The DAX led gains while the Nikkei 225 was the sharpest decliner, leaving the Nasdaq 100 the only major US index in negative territory.
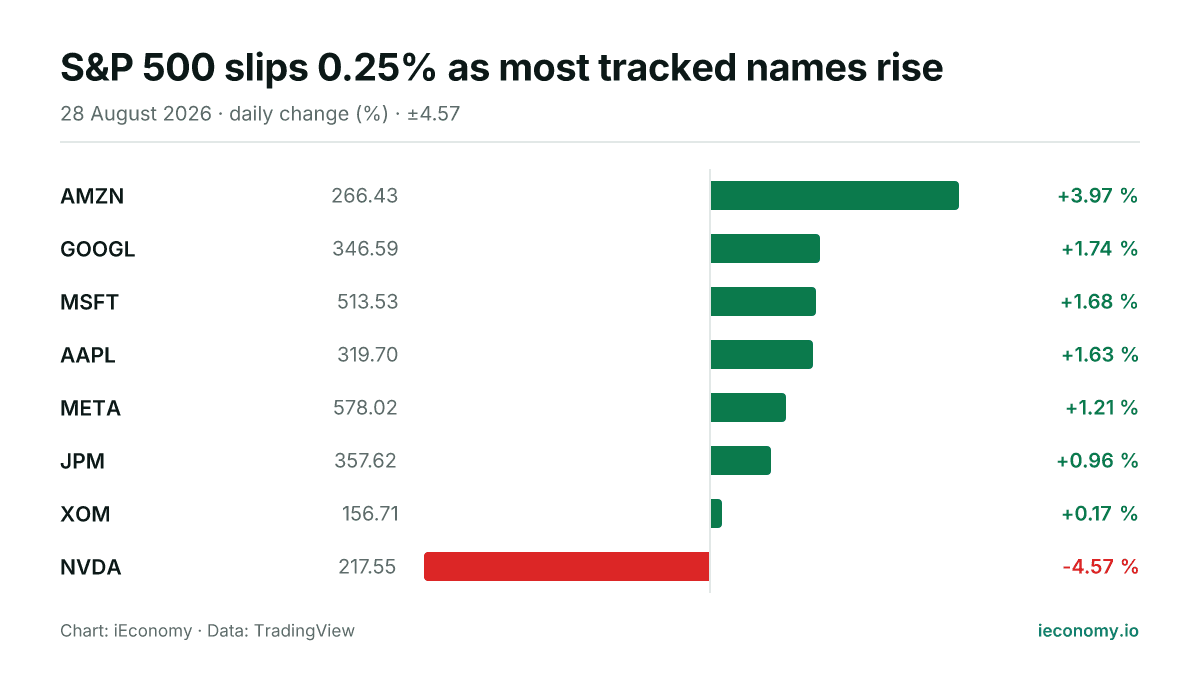
S&P 500 slips 0.25% as most tracked names rise
The S&P 500 finished Friday at 7,711.76, down 0.25% on the day. Breadth was positive among the tracked constituents, but a sharp fall in NVDA offset gains elsewhere.
Crude Oil Eases as U.S.-Iran Talks Draw Attention
Oil prices slipped after Pakistan said it is trying to restart U.S.-Iran talks, while traders took profits from recent gains. WTI was last down 0.26% at $82.98 a barrel.