S&P 500 rises 0.70% as most tracked names advance
The S&P 500 finished Friday at 7,489.72, up 0.70% on the day. Among the eight tracked constituents, six rose and two fell, with AMZN the strongest and AAPL the weakest.
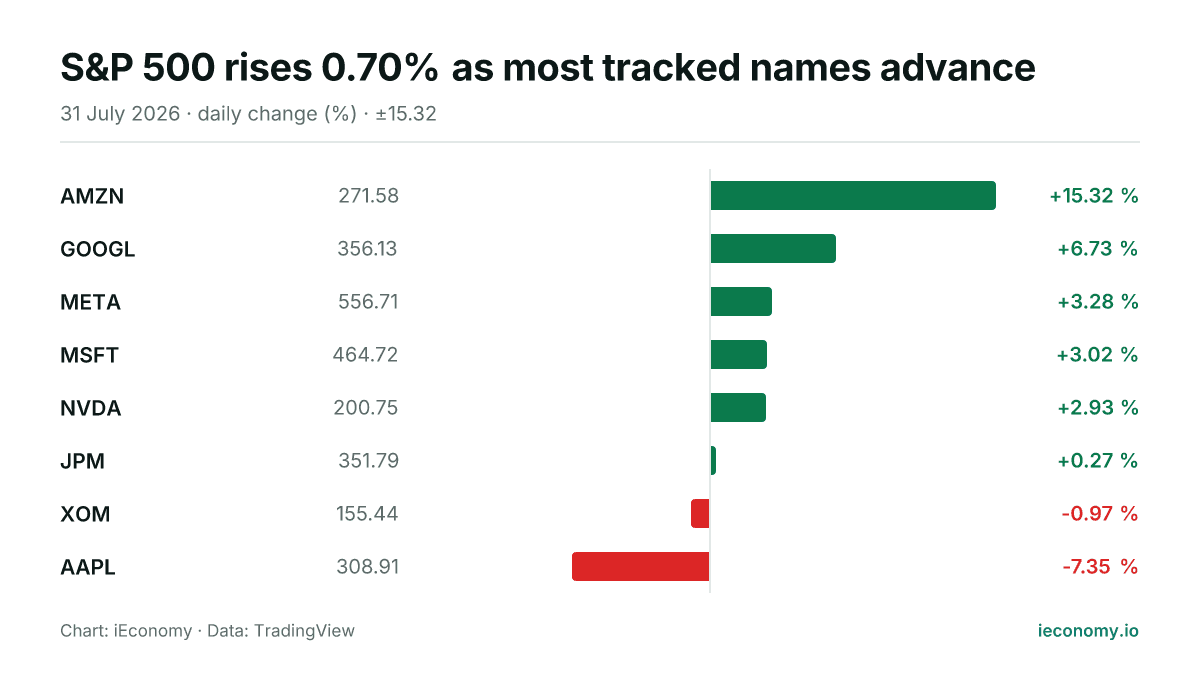
Chart: iEconomy · Data: TradingView
The S&P 500 ended Friday at 7,489.72, gaining 0.70% in a session that leaned higher across the small group of tracked names. Breadth was constructive, with six of eight constituents rising and only two declining, which points to a broadly positive tape rather than a move driven by a single stock alone.
How the index moved and how broad the move was
The day’s advance was steady rather than dramatic, and the index closed well in positive territory. With most of the tracked constituents higher, the move had enough participation to suggest that gains were not narrowly concentrated. For index investors, that kind of balance matters because it can indicate that performance was supported across several holdings, even though the index itself remains a weighted average of very different businesses.
| Stock | Last | Change |
|---|---|---|
| AMZN | 271.58 | +15.32 % |
| GOOGL | 356.13 | +6.73 % |
| META | 556.71 | +3.28 % |
| MSFT | 464.72 | +3.02 % |
| NVDA | 200.75 | +2.93 % |
| JPM | 351.79 | +0.27 % |
| XOM | 155.44 | -0.97 % |
| AAPL | 308.91 | -7.35 % |
The standout individual performers
AMZN was the clear standout, rising 15.32% to 271.58 and providing the largest single upside contribution among the names tracked here. At the other end, AAPL fell 7.35% to 308.91, making it the weakest performer in the group. The contrast between those two moves shows how a handful of large constituents can pull sentiment in different directions even on a day when the index closes higher.
What a long-term investor should take from one session
For long-term investors, a single session is best read as evidence of short-term mechanics rather than a verdict on the underlying market trend. Index levels reflect both price moves and the relative weight of constituents, so strong gains in one large name can offset weakness elsewhere, while broader participation can make the advance feel more durable. Even so, one day does not establish a lasting pattern, and a disciplined perspective focuses on how repeated sessions add up over time rather than on any one close.
Sources
Related News
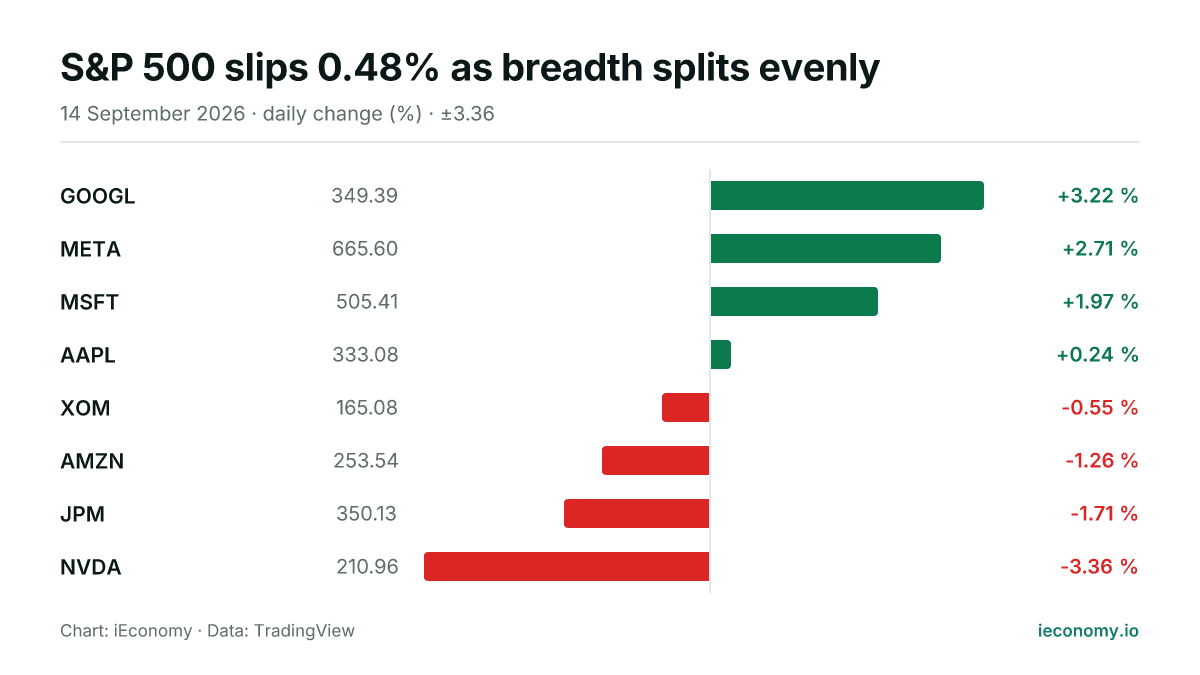
S&P 500 slips 0.48% as breadth splits evenly
The S&P 500 ended Monday at 7,619.98, down 0.48% on the day. Among eight tracked constituents, four rose and four fell, with GOOGL the strongest and NVDA the weakest.
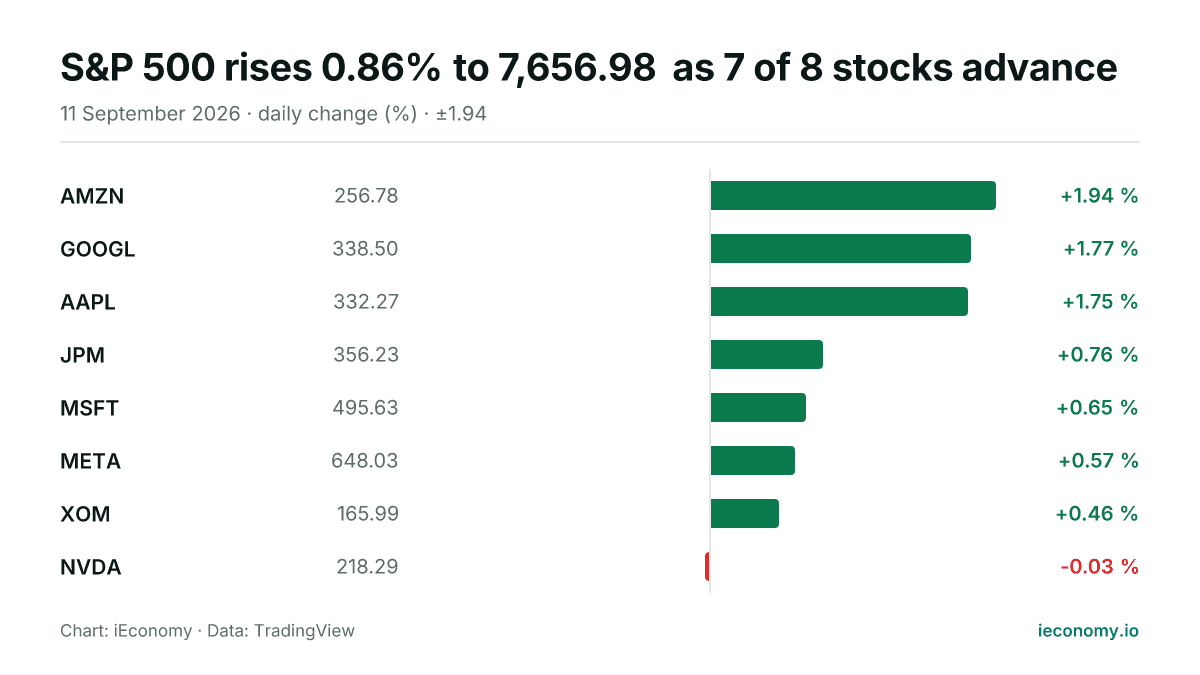
S&P 500 rises 0.86% to 7,656.98 as 7 of 8 stocks advance
The S&P 500 finished higher on Friday, with a broad majority of the tracked constituents in positive territory. AMZN led the group, while NVDA was the only decliner among the eight names monitored.
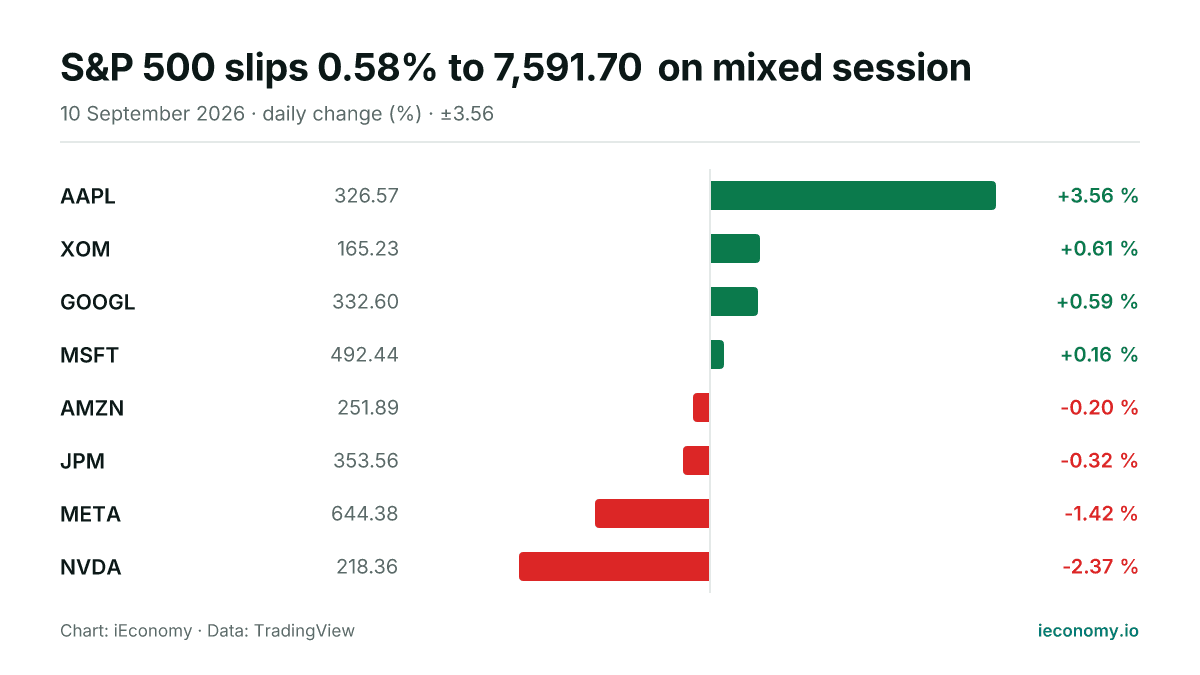
S&P 500 slips 0.58% to 7,591.70 on mixed session
The S&P 500 ended Thursday lower at 7,591.70, with a narrow split among the eight tracked constituents showing four gainers and four decliners. Apple was the strongest performer, while Nvidia was the weakest.
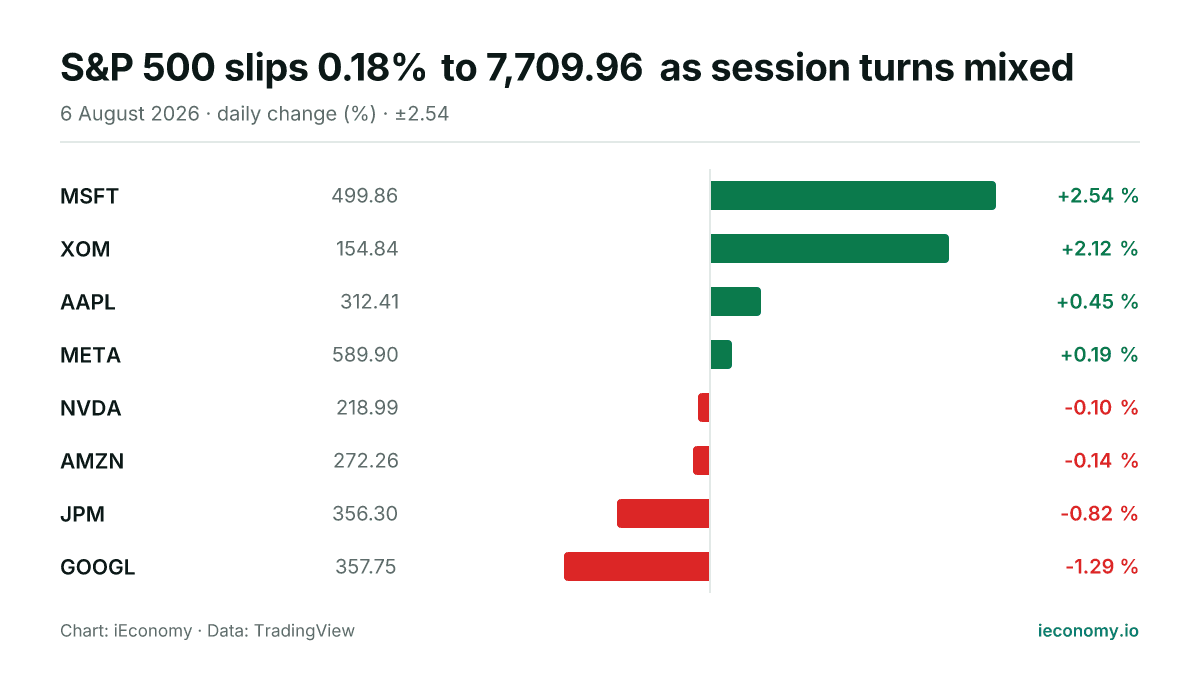
S&P 500 slips 0.18% to 7,709.96 as session turns mixed
The S&P 500 edged lower on Thursday, August 6, 2026, finishing at 7,709.96 after a mixed day across the tracked constituents. MSFT led the group while GOOGL was the weakest performer.

Global equities ease; Nikkei edges higher
US and European indices were lower in Thursday trading, while Asia was mixed. The Nikkei 225 rose modestly, leaving one gain against six declines across the seven markets tracked.
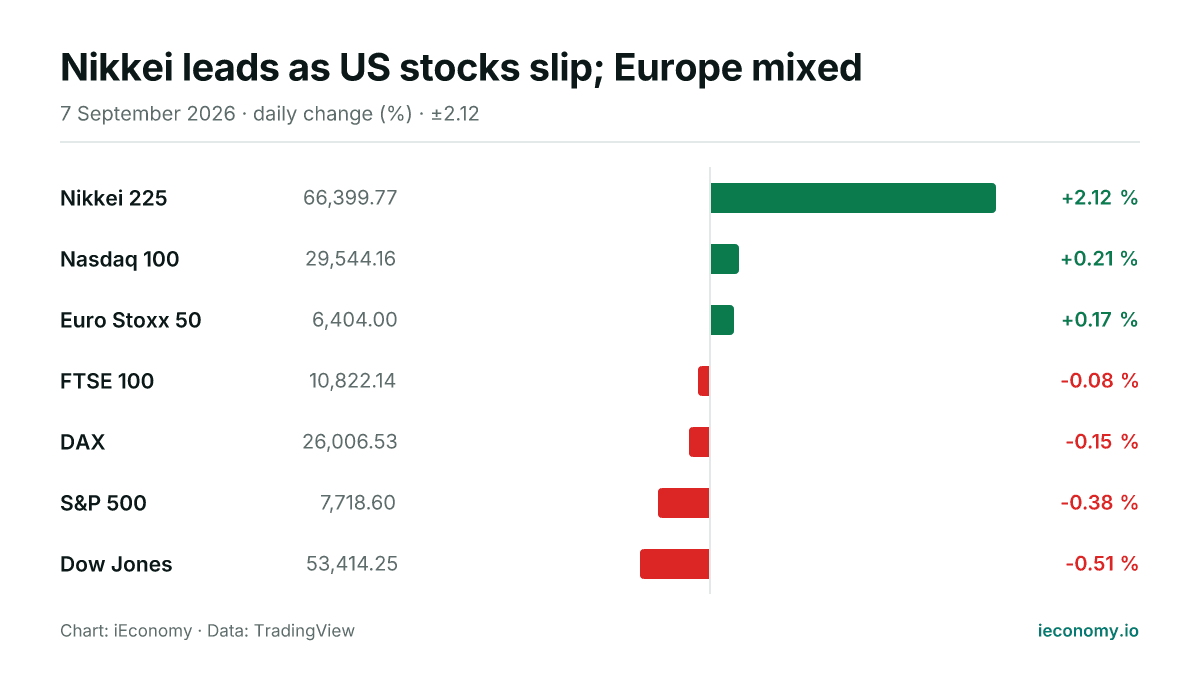
Nikkei leads as US stocks slip; Europe mixed
Asian equities outperformed on Monday, with the Nikkei 225 rising sharply while US benchmarks traded lower and Europe was mixed. The day’s moves were modest in most markets, but the gap between Japan and Wall Street stood out.