World equities mixed as Europe leads Saturday gains
European benchmarks outperformed on Saturday, with the Euro Stoxx 50 and DAX posting the strongest advances. US indices were softer, while Asian equities were also firmer, led by the Nikkei 225.
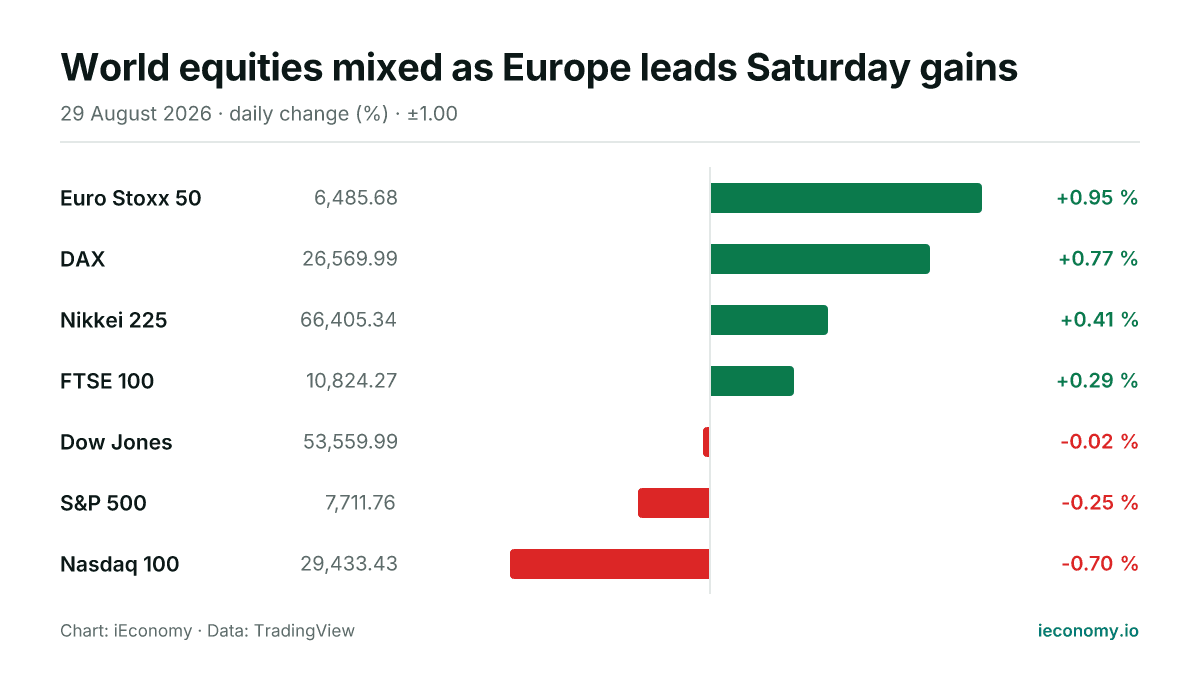
Chart: iEconomy · Data: TradingView
World equity markets were mixed on Saturday, with four of the seven tracked benchmarks higher and three lower. Europe led the session, Asia traded firmer, and the main US indices were slightly weaker, leaving the day’s tone uneven rather than directional.
What moved and by how much
The Euro Stoxx 50 rose 0.95% to 6,485.68, while the DAX gained 0.77% to 26,569.99. In London, the FTSE 100 added 0.29%, showing that the European advance was broad, even if the gains were uneven in size.
| Instrument | Last | Change |
|---|---|---|
| Euro Stoxx 50 | 6,485.68 | +0.95 % |
| DAX | 26,569.99 | +0.77 % |
| Nikkei 225 | 66,405.34 | +0.41 % |
| FTSE 100 | 10,824.27 | +0.29 % |
| Dow Jones | 53,559.99 | -0.02 % |
| S&P 500 | 7,711.76 | -0.25 % |
| Nasdaq 100 | 29,433.43 | -0.70 % |
In Asia, the Nikkei 225 climbed 0.41% to 66,405.34. The move was smaller than in continental Europe, but it still kept the regional picture positive and helped offset weaker trading across the US benchmarks.
US equities were the laggards. The Dow Jones slipped 0.02%, the S&P 500 fell 0.25%, and the Nasdaq 100 dropped 0.70%, making technology-heavy shares the weakest part of the day’s cross-market performance.
The standouts at each end
At the top of the table, the Euro Stoxx 50 posted the largest advance among the tracked indices. The DAX also outperformed, which mattered because gains in both benchmarks pointed to strength that was not confined to one single European market.
At the other end, the Nasdaq 100 underperformed the most, marking the clearest decline in the group. The S&P 500 and Dow Jones were much closer to flat, so the weakness was concentrated rather than widespread across US large caps.
The spread between the strongest and weakest moves underscored a rotation effect within the day’s trading. When regional and sector weightings differ, index performance can diverge even if broader risk appetite is not collapsing.
What a long-term investor should take from one day
A single session mainly shows how index mechanics work: cap-weighted benchmarks move according to the largest constituents, sector mix, and regional composition. That means a modest rise in one index can coexist with a fall in another without implying a lasting shift in fundamentals.
For long-term investors, the useful signal is breadth and relative performance, not the headline point change. A day like this can be meaningful for positioning around the margin, but it is not enough on its own to justify a structural conclusion.
It is also a reminder that markets trade continuously or semi-continuously across time zones, so one region can lead while another lags. That sequencing can create short-term noise, and it is prudent to treat the day’s moves as part of a longer series rather than a verdict.
This article is not investment advice and recommends no asset, level or direction; a single session's move is not evidence of a trend. For background see Markets, Bear Market, BIST 100, and for terms the finance glossary.
Frequently asked questions
Which region led the session?
Europe led the tracked markets, with the Euro Stoxx 50 and DAX posting the largest gains. The FTSE 100 also moved higher, though by a smaller amount than the continental benchmarks.
Which index was the weakest?
The Nasdaq 100 was the weakest of the seven tracked benchmarks, falling 0.70%. The S&P 500 and Dow Jones were also lower, but their declines were much smaller.
What should investors infer from this move?
The main takeaway is that one day’s performance reflects index composition and trading flows as much as broad sentiment. It can indicate where relative strength or weakness sits in the moment, but it should not be treated as a prediction.
Sources
Related News
Europe leads as US tech underperforms on Friday
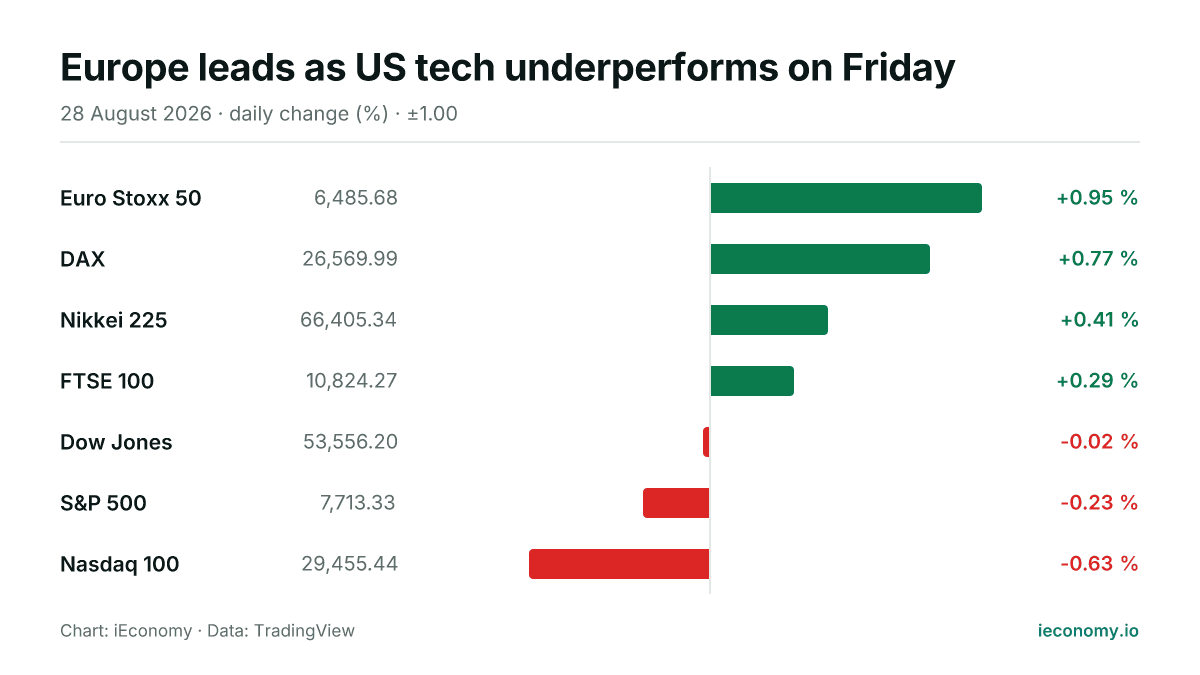
European and Asian benchmarks advanced on Friday, while the main US averages were mixed to weaker. The day’s moves were modest in the US and broader in Europe, leaving regional performance uneven.
World equities mixed as Asia and Europe outpace US
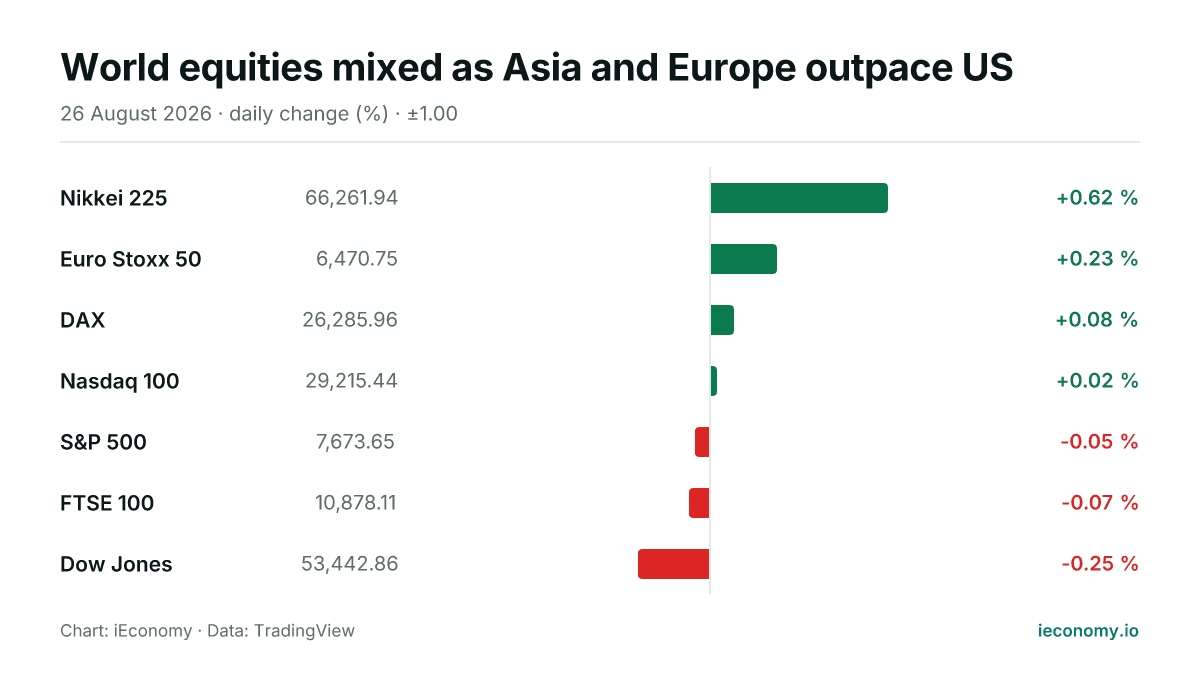
Asian and European benchmarks edged higher as US indices were mixed in early trading. The moves were modest overall, with the Nikkei 225 leading and the Dow Jones the weakest in the group.
Global equities rise across US, Europe and Asia
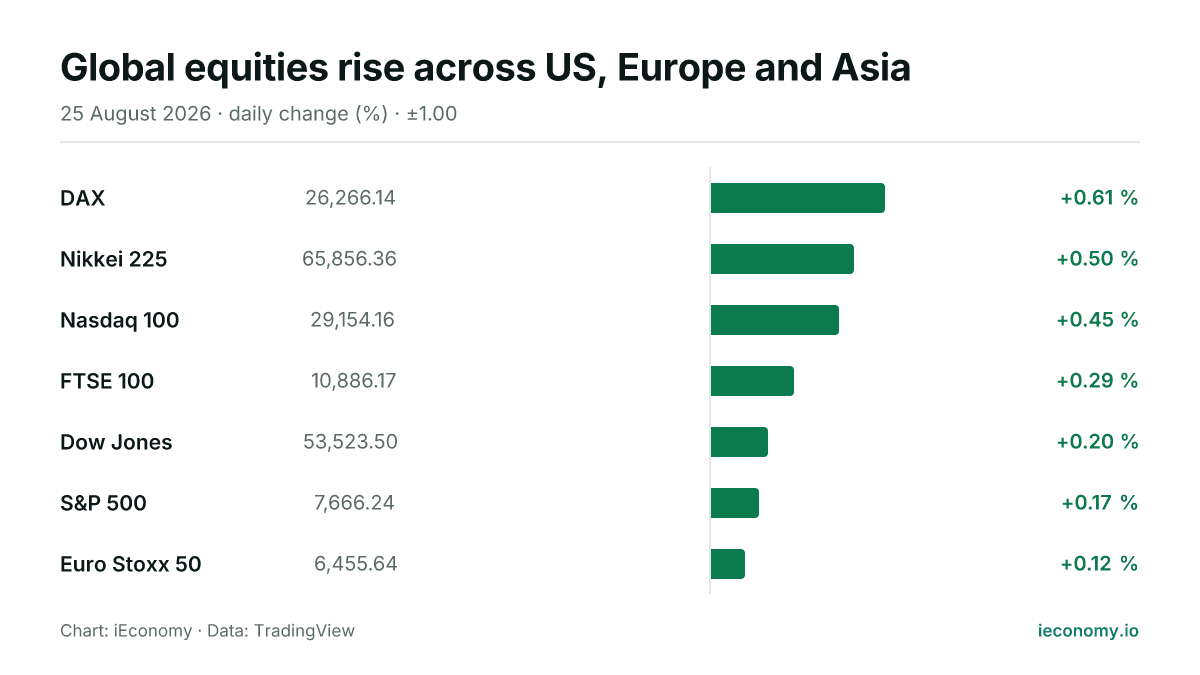
All seven tracked benchmarks were higher on Tuesday, with gains led by Germany’s DAX and Japan’s Nikkei 225. The moves were broadly modest, leaving the day more notable for breadth than for size.
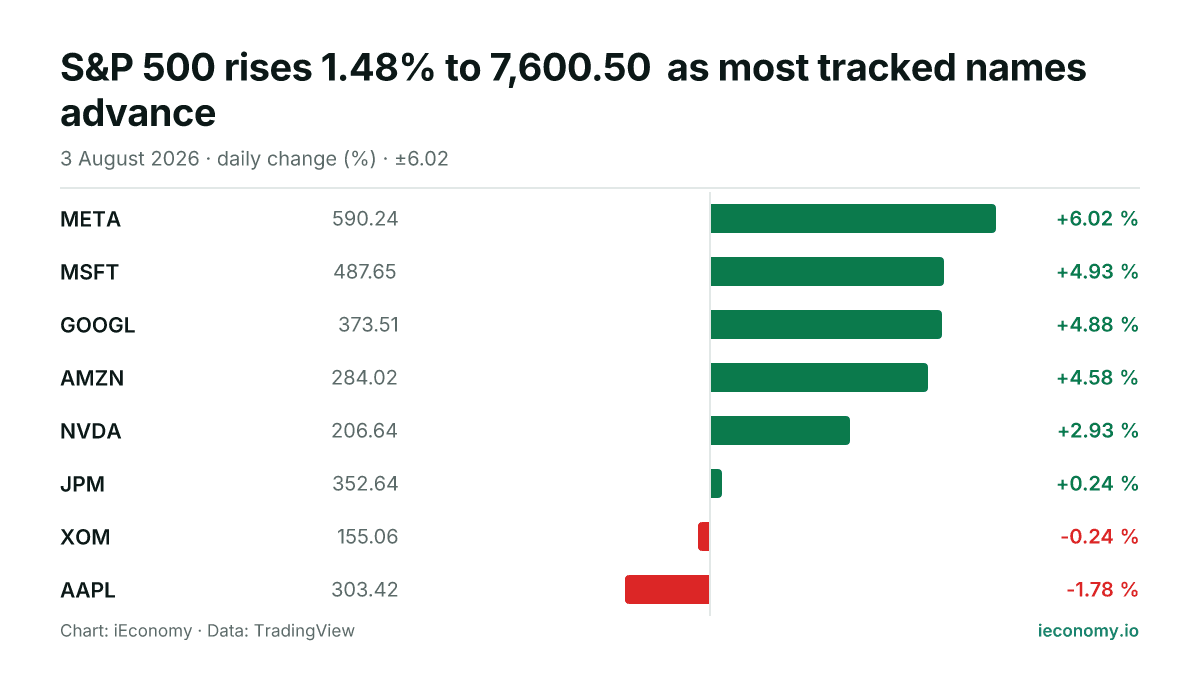
S&P 500 rises 1.48% to 7,600.50 as most tracked names advance
The S&P 500 finished Monday higher at 7,600.50, with six of the eight tracked constituents advancing. META was the strongest performer, while AAPL lagged.
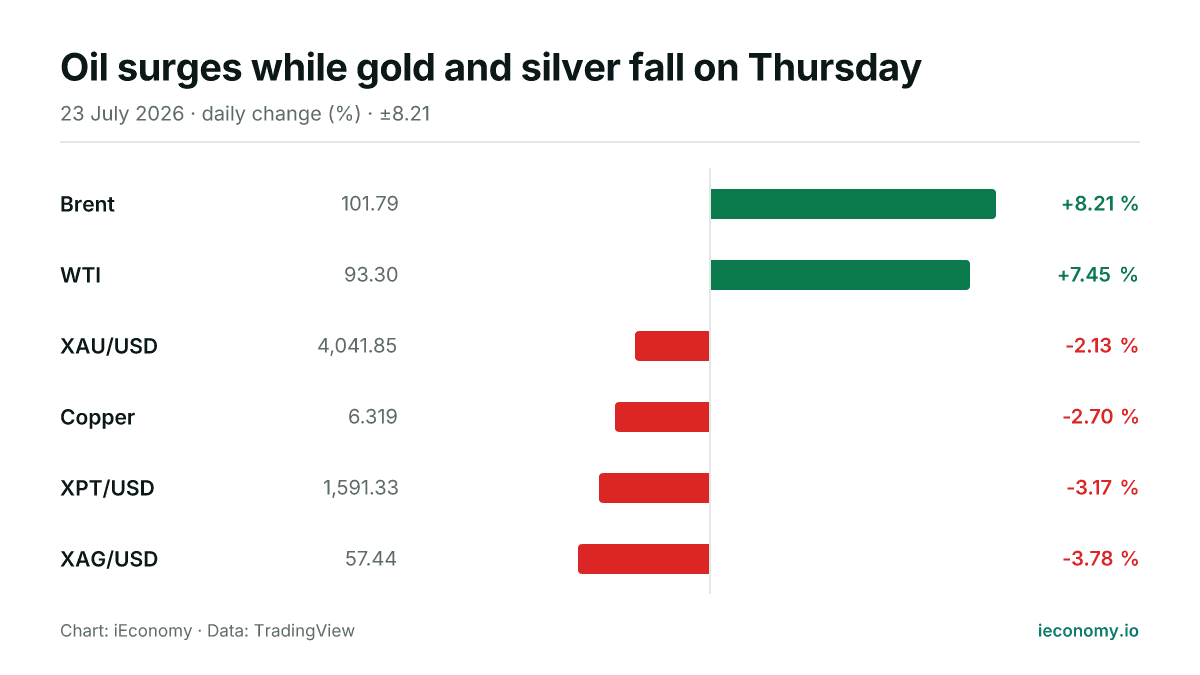
Oil surges while gold and silver fall on Thursday
Crude advanced sharply on the day, while gold and silver moved lower. The moves highlight how commodity prices can shift quickly across asset classes even in a single session.
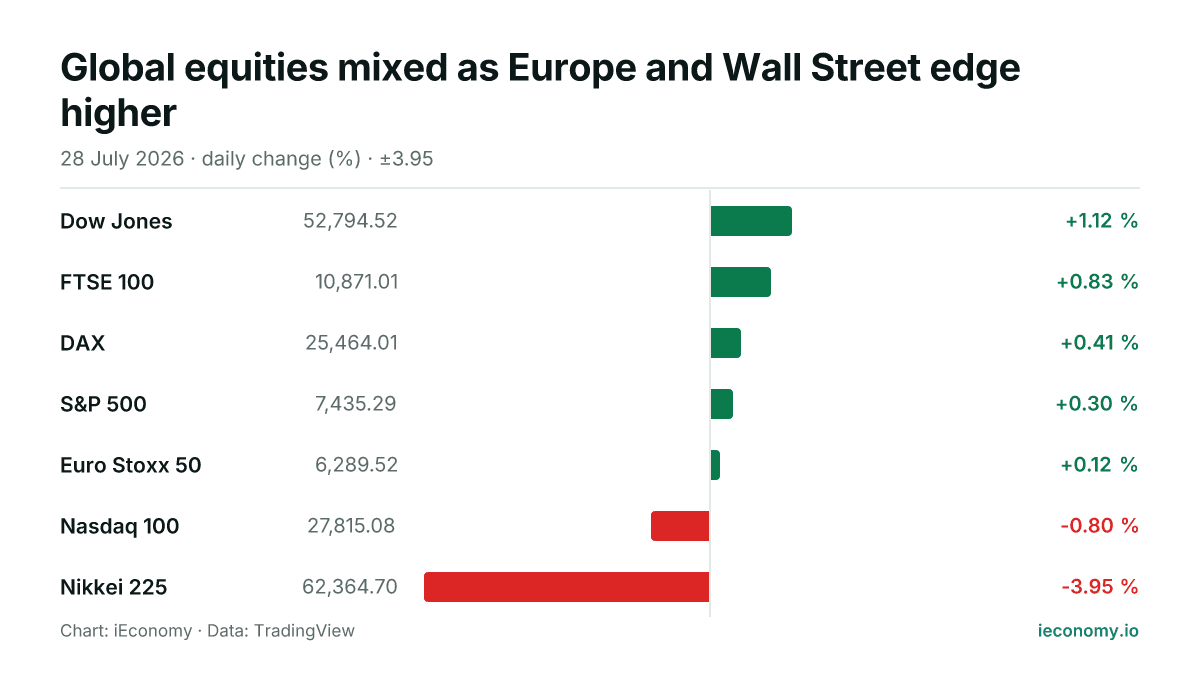
Global equities mixed as Europe and Wall Street edge higher
US and European indices mostly advanced on Tuesday, while Tokyo’s Nikkei 225 fell sharply. The day left a split picture across regions rather than a broad risk-off or risk-on move.