Asian gains lead mixed global equity session
Asian and European indices were firmer while US benchmarks were mixed, with the Nasdaq 100 edging higher and the S&P 500 and Dow Jones lower. The day left a split picture across regions rather than a broad risk-on move.
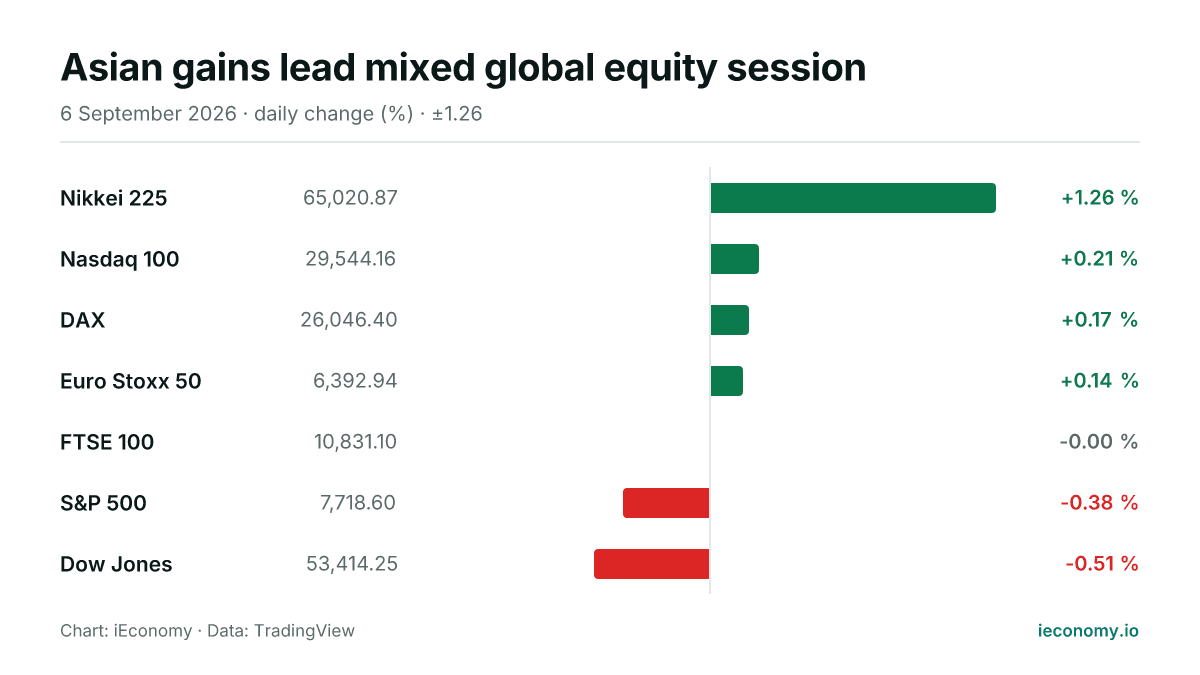
Chart: iEconomy · Data: TradingView
World equity markets showed a mixed tone on Sunday, with 4 of the 7 tracked benchmarks higher and 3 lower or flat. Asia led the advance, Europe was modestly firmer and the US session was split, pointing to selective rather than broad participation.
What moved and by how much
Japan's Nikkei 225 was the strongest major mover, up 1.26% to 65,020.87. In the US, the Nasdaq 100 added 0.21% to 29,544.16, while Europe's DAX gained 0.17% to 26,046.40 and the Euro Stoxx 50 rose 0.14% to 6,392.94.
| Instrument | Last | Change |
|---|---|---|
| Nikkei 225 | 65,020.87 | +1.26 % |
| Nasdaq 100 | 29,544.16 | +0.21 % |
| DAX | 26,046.40 | +0.17 % |
| Euro Stoxx 50 | 6,392.94 | +0.14 % |
| FTSE 100 | 10,831.10 | -0.00 % |
| S&P 500 | 7,718.60 | -0.38 % |
| Dow Jones | 53,414.25 | -0.51 % |
On the other side of the ledger, the S&P 500 fell 0.38% to 7,718.60 and the Dow Jones lost 0.51% to 53,414.25. The FTSE 100 was effectively unchanged at 10,831.10, leaving London close to flat as other regions moved a little more decisively.
The standouts at each end
The day's clearest winner was the Nikkei 225, which outpaced the rest of the field by a wide margin. That kind of move matters because it can reflect stronger buying in one market even when the broader global tape is only mildly positive.
At the weaker end, the Dow Jones posted the largest decline among the tracked indices. The S&P 500 also finished lower, so the US large-cap picture was weaker than the Nasdaq 100's gain suggests.
The spread between the best and worst performances was enough to show dispersion, but not enough to signal a wholesale shift across asset classes. When markets move this way, the mechanics are usually index-specific positioning, sector rotation and local sentiment rather than a single global impulse.
What a long-term investor should take from one day
One session tells investors more about relative strength than about a durable trend. A market can lead for a day because it is more concentrated in the sectors or names attracting flows, while others lag even though the underlying macro backdrop is unchanged.
For long-term holders, the key point is that short-term index moves mainly alter entry points and the pace of mark-to-market gains or losses. They do not, on their own, change the discipline of diversification, patience and position sizing.
It is also worth remembering that a flat or slightly negative day can be meaningful in an index that has already risen sharply, because it may show consolidation rather than reversal. The reverse is true as well: a strong one-day gain can matter less if it remains isolated to one region or one benchmark.
This article is not investment advice and recommends no asset, level or direction; a single session's move is not evidence of a trend. For background see Markets, Bear Market, BIST 100, and for terms the finance glossary.
Frequently asked questions
Which market led the day?
The Nikkei 225 led the session, rising 1.26%. It was the largest move among the tracked equity benchmarks and the strongest sign of appetite in the digest.
Were US stocks broadly higher or lower?
The US picture was mixed rather than one-directional. The Nasdaq 100 edged up, but the S&P 500 and Dow Jones were lower, which means gains were concentrated rather than broad-based.
What should investors infer from a mixed day like this?
A mixed day usually points to dispersion across regions and styles, not a single clear market verdict. For long-term investors, the main lesson is to focus on portfolio structure and risk control rather than reading too much into one session's moves.
Sources
Related News
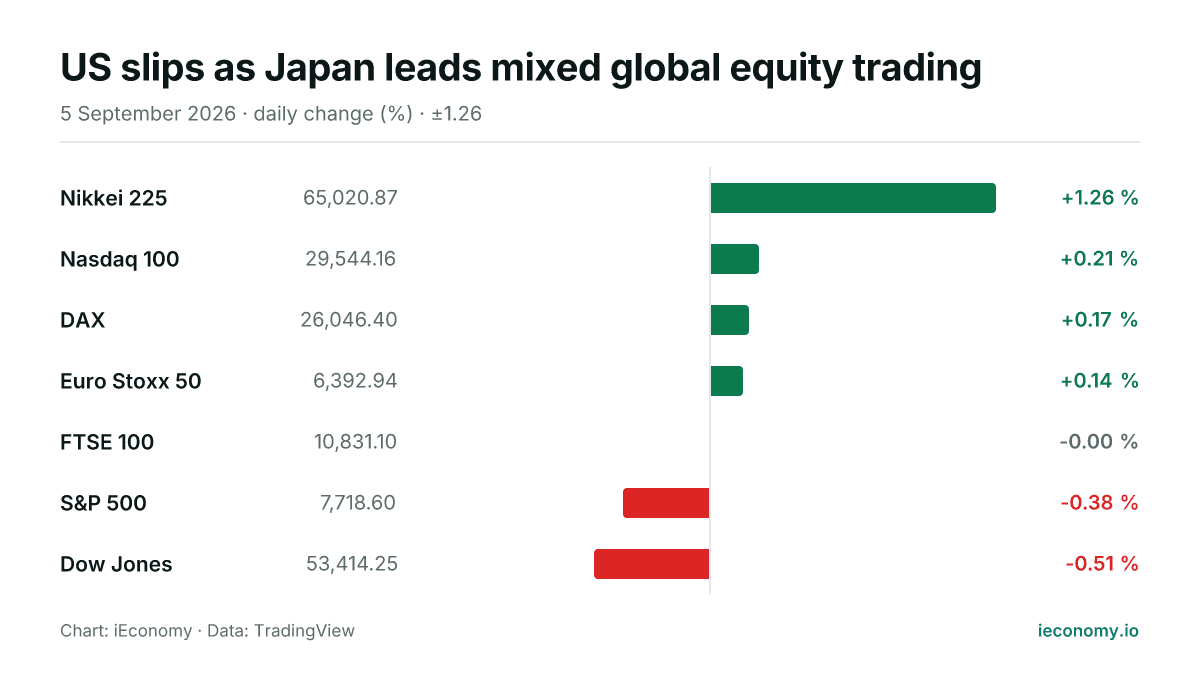
US slips as Japan leads mixed global equity trading
World equities were mixed on 2026-09-05, with Japan leading gains and US benchmarks mostly weaker. Europe edged higher, while the FTSE 100 was flat as the Dow and S&P 500 lagged.
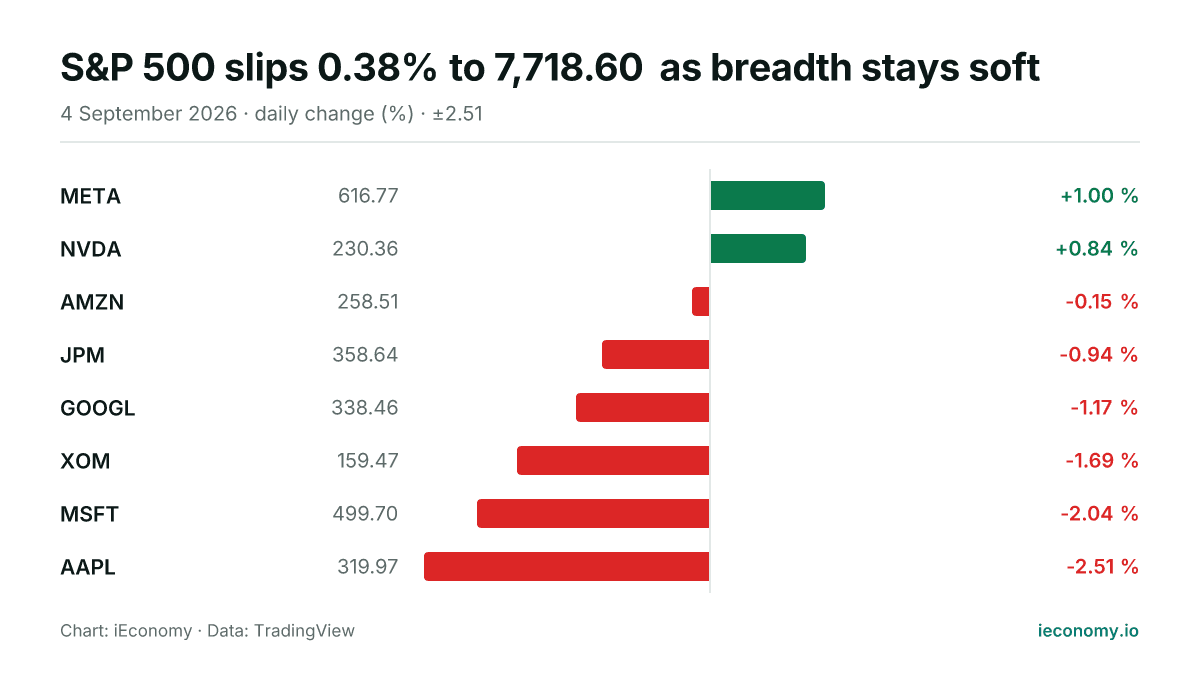
S&P 500 slips 0.38% to 7,718.60 as breadth stays soft
The S&P 500 finished Friday lower at 7,718.60, with six of the eight tracked constituents declining. META was the day’s best performer, while AAPL posted the steepest fall.
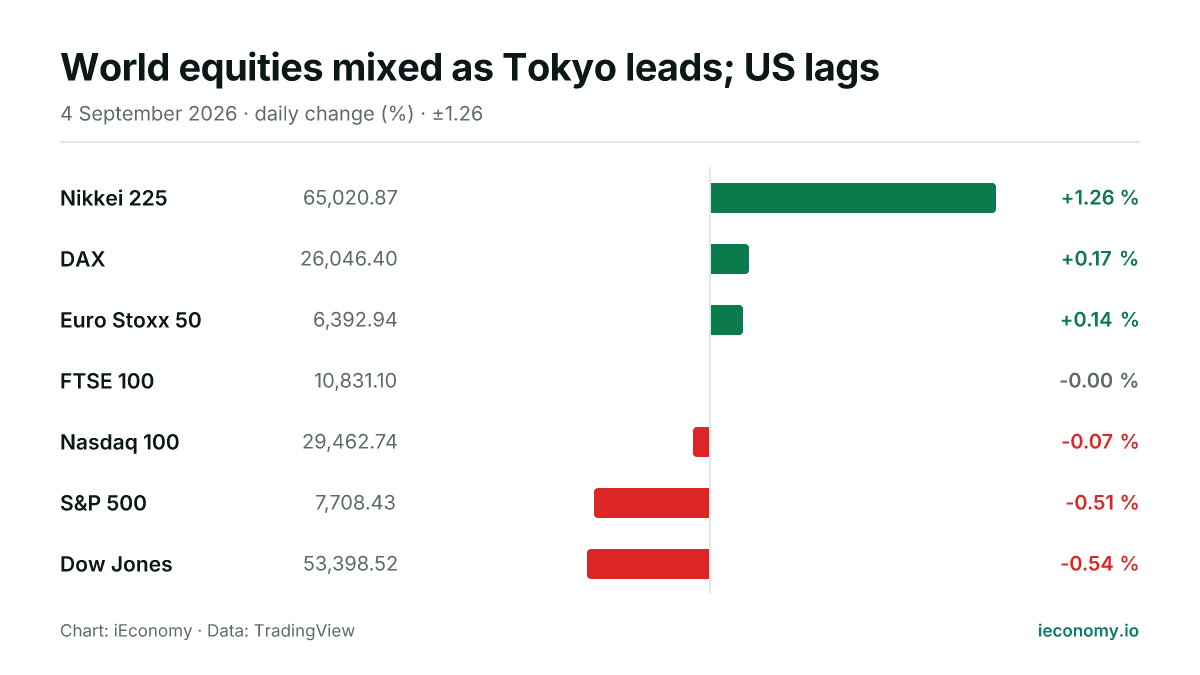
World equities mixed as Tokyo leads; US lags
Asian and European indices were mostly firmer on Friday, while US benchmarks finished lower in the digest. The move was uneven, with the Nikkei 225 the clear standout and the Dow Jones and S&P 500 among the weaker gauges.
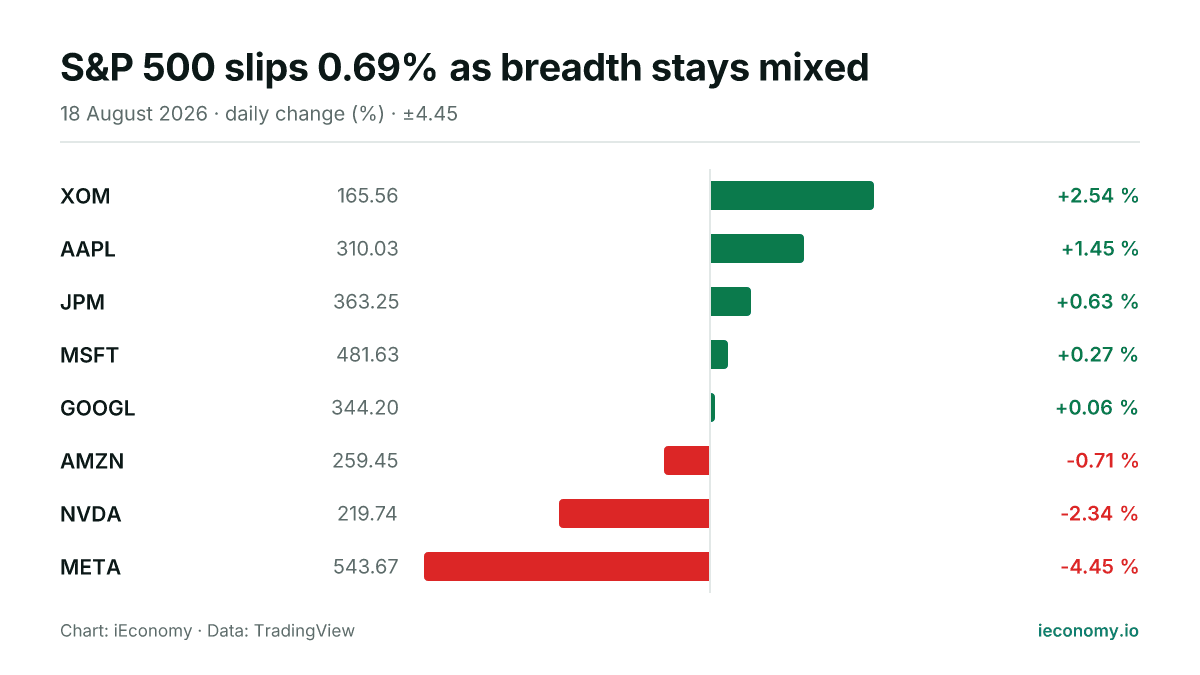
S&P 500 slips 0.69% as breadth stays mixed
The S&P 500 finished Tuesday at 7,691.76, down 0.69% on the session. Among the eight tracked constituents, five advanced and three declined, with XOM the strongest and META the weakest.
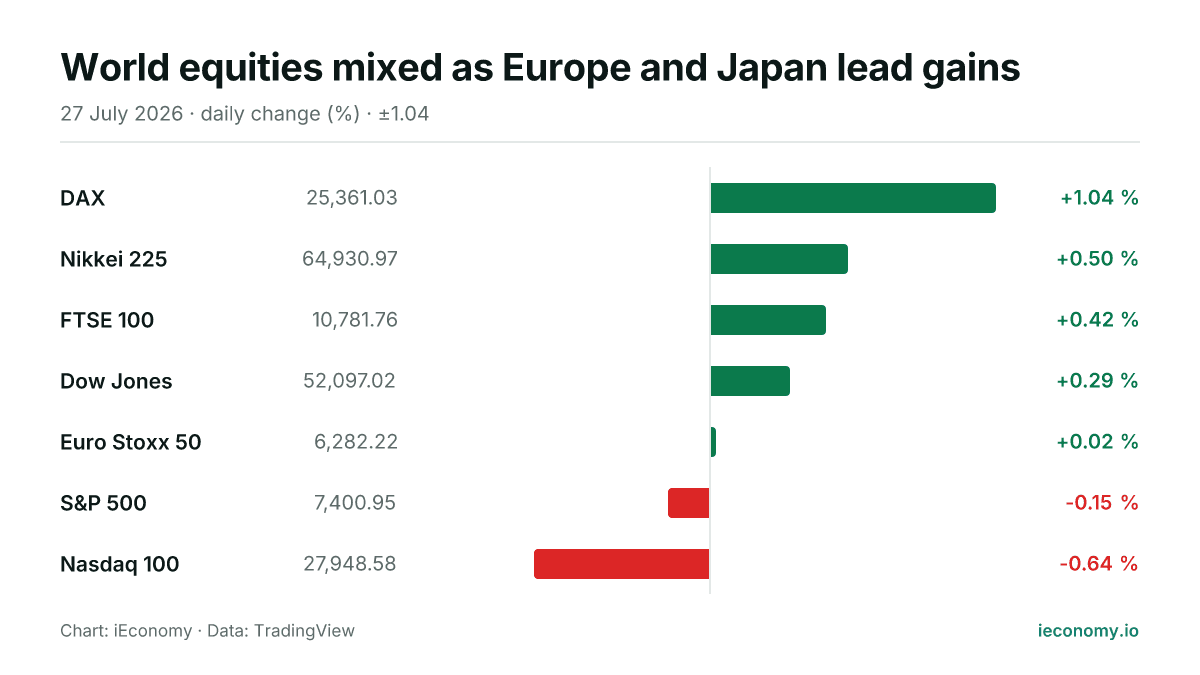
World equities mixed as Europe and Japan lead gains
European benchmarks and Japan advanced, while US large-cap indices were mixed in Monday trading. The DAX and Nikkei 225 led the upside, while the Nasdaq 100 lagged.
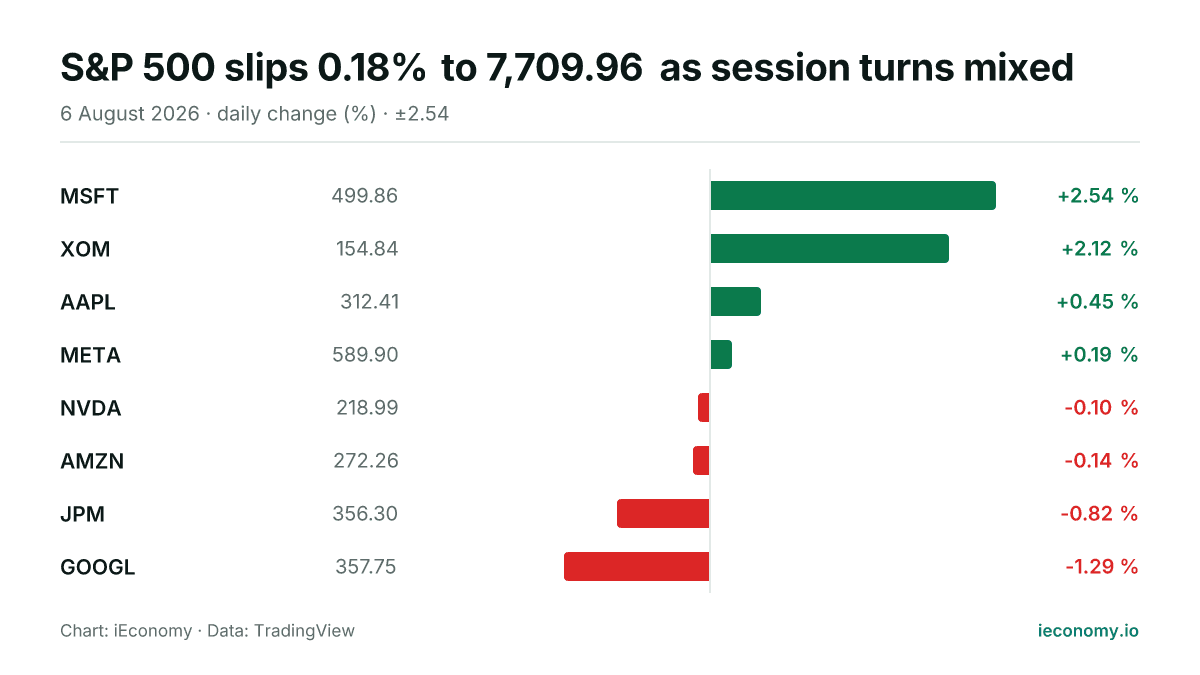
S&P 500 slips 0.18% to 7,709.96 as session turns mixed
The S&P 500 edged lower on Thursday, August 6, 2026, finishing at 7,709.96 after a mixed day across the tracked constituents. MSFT led the group while GOOGL was the weakest performer.