World equities mixed as Europe and Japan lead gains
European benchmarks and Japan advanced, while US large-cap indices were mixed in Monday trading. The DAX and Nikkei 225 led the upside, while the Nasdaq 100 lagged.
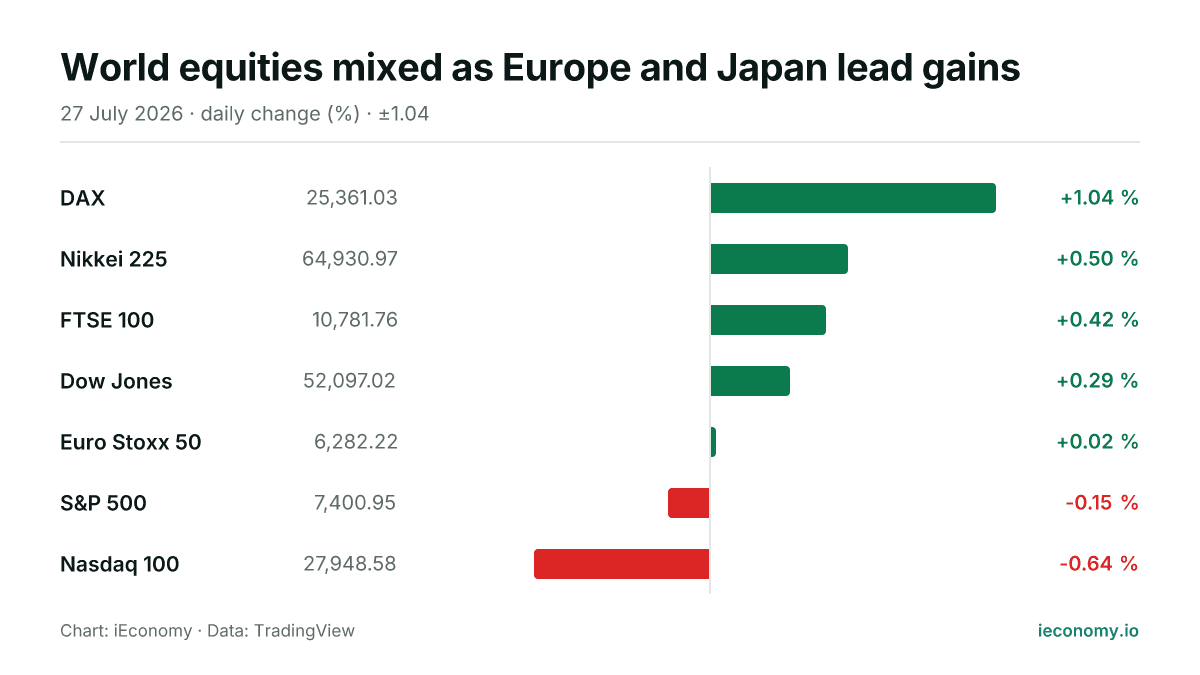
Chart: iEconomy · Data: TradingView
World equity markets were mixed on Monday, with five of the seven tracked indices higher and two lower. Europe and Japan showed the firmer tone, while US benchmark performance was split: the Dow Jones edged up, the S&P 500 slipped and the Nasdaq 100 underperformed. The moves were modest in most cases, but the dispersion across regions and styles was clear.
What moved and by how much
The DAX was the strongest performer, rising 1.04% to 25,361.03. The Nikkei 225 added 0.50% to 64,930.97, while the FTSE 100 gained 0.42% to 10,781.76. In the US, the Dow Jones advanced 0.29% to 52,097.02, and the Euro Stoxx 50 was almost unchanged, up 0.02% at 6,282.22. On the softer side, the S&P 500 fell 0.15% to 7,400.95 and the Nasdaq 100 declined 0.64% to 27,948.58.
| Instrument | Last | Change |
|---|---|---|
| DAX | 25,361.03 | +1.04 % |
| Nikkei 225 | 64,930.97 | +0.50 % |
| FTSE 100 | 10,781.76 | +0.42 % |
| Dow Jones | 52,097.02 | +0.29 % |
| Euro Stoxx 50 | 6,282.22 | +0.02 % |
| S&P 500 | 7,400.95 | -0.15 % |
| Nasdaq 100 | 27,948.58 | -0.64 % |
The standouts at each end
The day’s leadership sat in Germany, where the DAX outpaced the rest of the pack, and in Japan, where the Nikkei 225 also posted a solid gain. At the other end, the Nasdaq 100 was the weakest of the seven, with the S&P 500 also lower. That split matters because broad index moves are not just about direction: they also reflect how investors are positioning between more cyclically exposed markets and more growth-heavy US technology exposure. A near-flat Euro Stoxx 50 suggests the region as a whole was less decisive than individual national benchmarks.
What a long-term investor should take from one day
For long-term investors, the main point is that a single session rarely changes the broader picture, but it can reveal how quickly leadership can rotate across regions and sectors. When a market rises while another falls, the difference often comes down to index composition and short-term positioning rather than a wholesale shift in fundamentals. The mechanics are straightforward: benchmark returns are weighted averages of their constituents, so stronger moves in one part of the market can outweigh weakness elsewhere. One day’s dispersion is a reminder to watch risk, diversification and the balance between growth and value exposures rather than reading too much into any one session.
Sources
Related News

Global equities ease; Nikkei edges higher
US and European indices were lower in Thursday trading, while Asia was mixed. The Nikkei 225 rose modestly, leaving one gain against six declines across the seven markets tracked.
Global equities slip across US, Europe and Asia
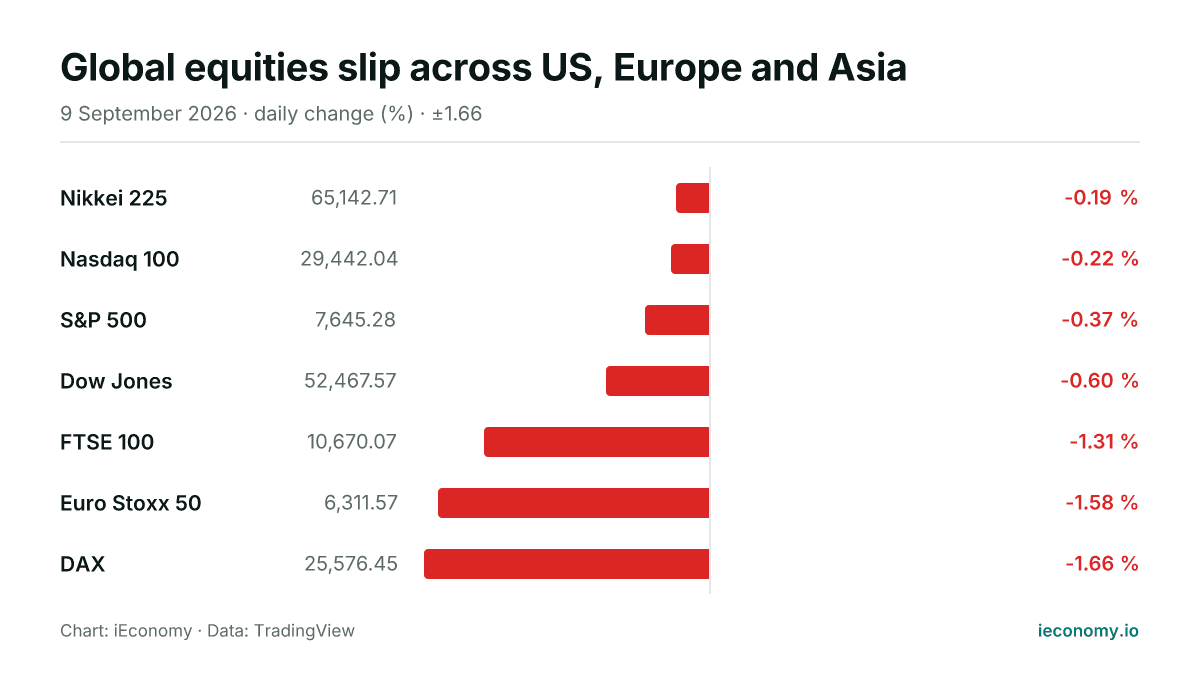
All seven tracked indices were lower or flat on Wednesday, with Europe leading the declines and the Dow among the weakest in the US. The session was broadly risk-off, but only the price action itself is visible here.
Nikkei leads as US stocks slip; Europe mixed
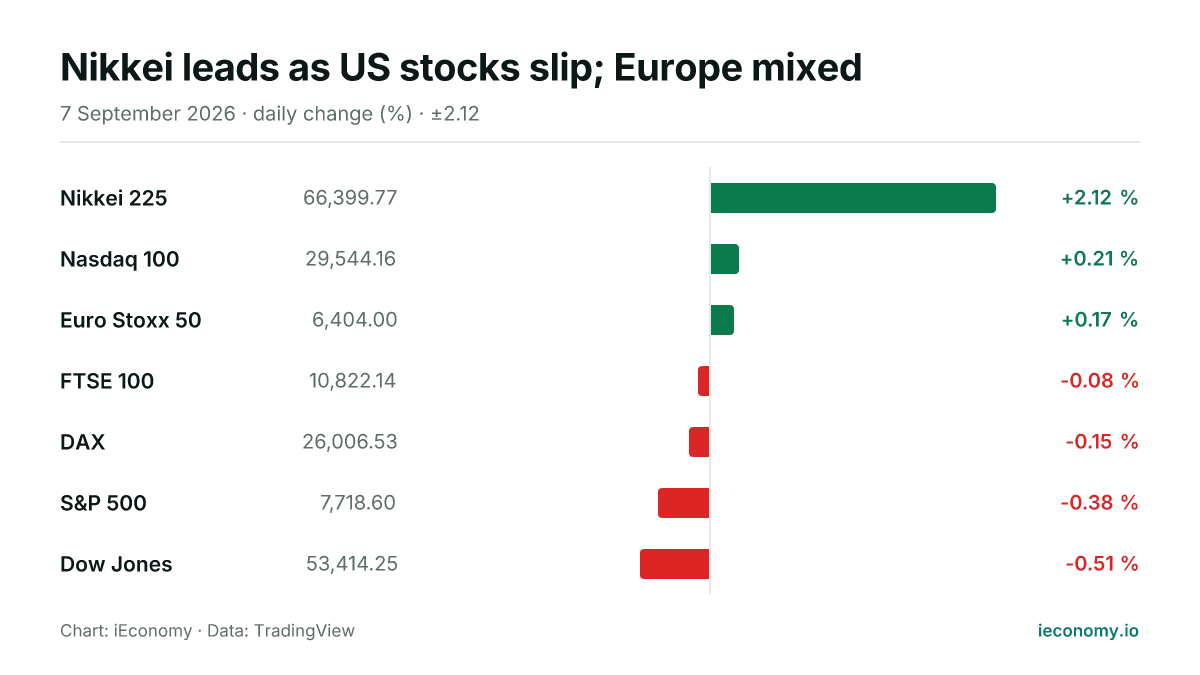
Asian equities outperformed on Monday, with the Nikkei 225 rising sharply while US benchmarks traded lower and Europe was mixed. The day’s moves were modest in most markets, but the gap between Japan and Wall Street stood out.
S&P 500 rises 0.72% to 7,730.99 as Nvidia leads
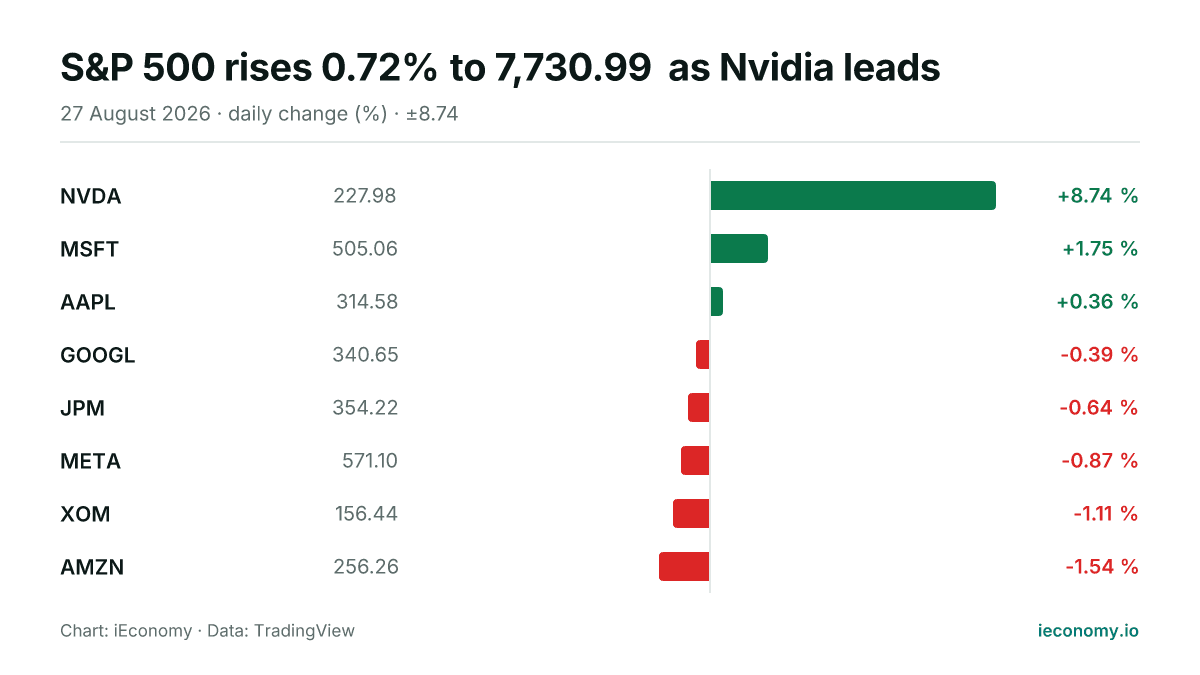
The S&P 500 advanced on Thursday, with a narrow majority of tracked constituents higher. Nvidia was the strongest performer, while Amazon lagged the group.
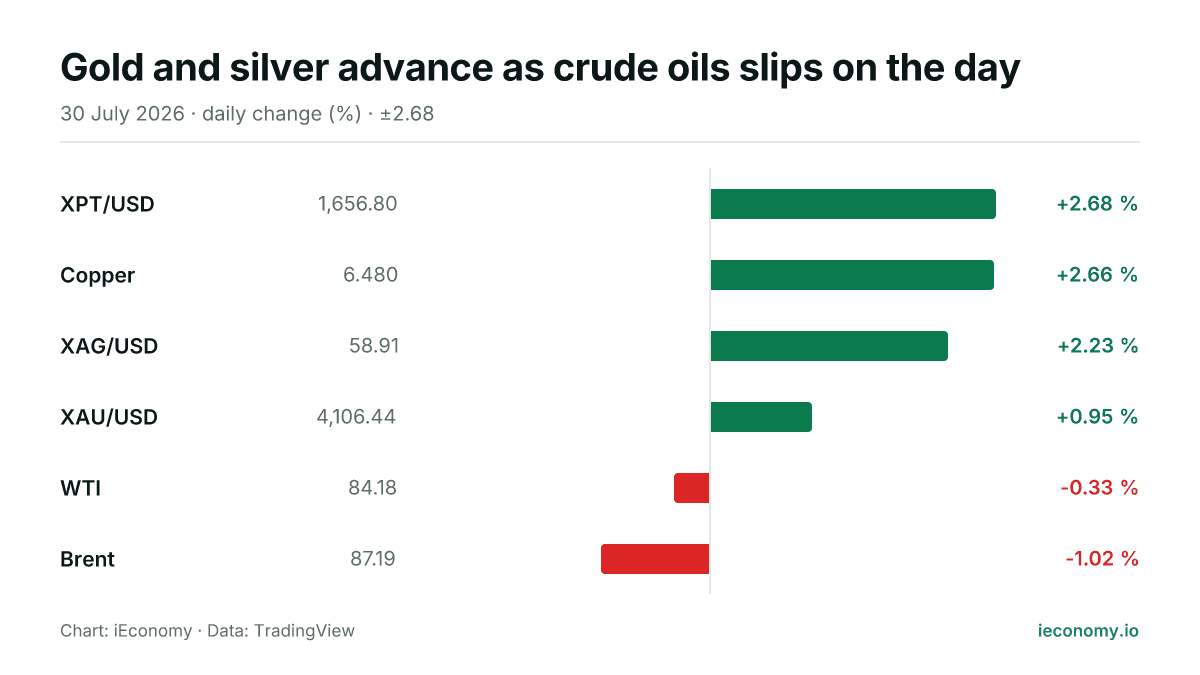
Gold and silver advance as crude oils slips on the day
Precious metals were firmer on Thursday, led by a sharper gain in silver, while crude oil traded lower. The session left the group mixed overall, with 4 of 6 tracked markets higher and 2 lower.
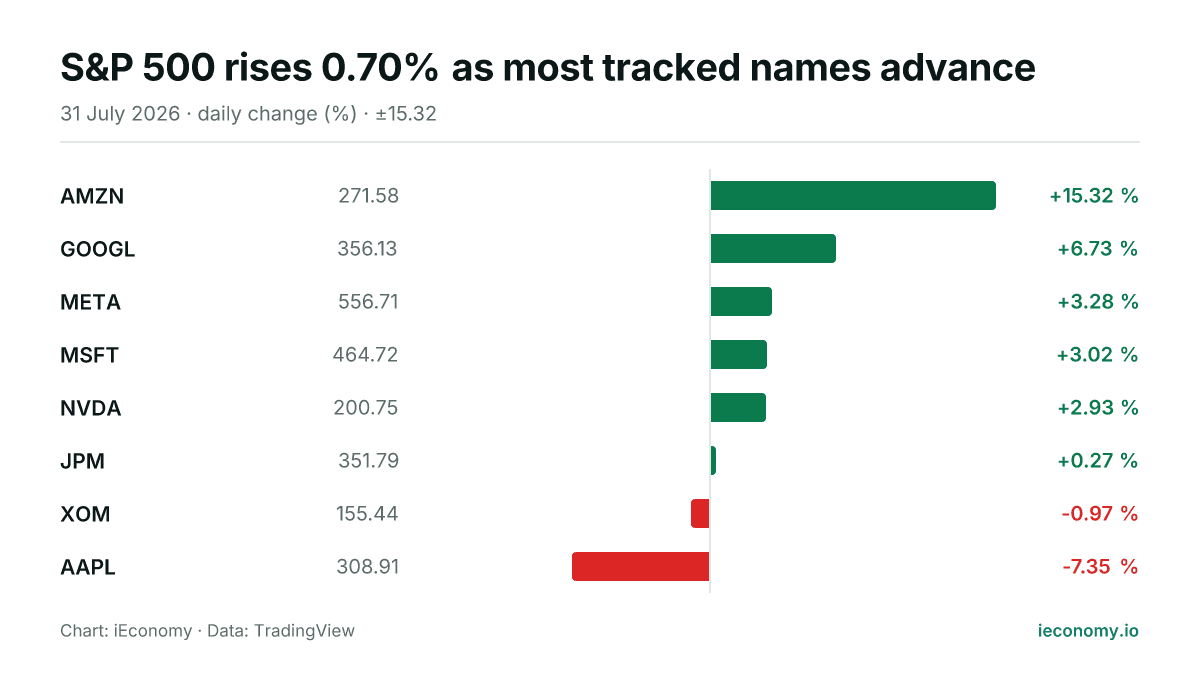
S&P 500 rises 0.70% as most tracked names advance
The S&P 500 finished Friday at 7,489.72, up 0.70% on the day. Among the eight tracked constituents, six rose and two fell, with AMZN the strongest and AAPL the weakest.