Gold steady as silver rises while oil sells off
Gold was little changed on Sunday, silver led the gains among the metals, and crude oil was weaker across both benchmarks. The session left three of the six tracked instruments higher and three lower or flat.
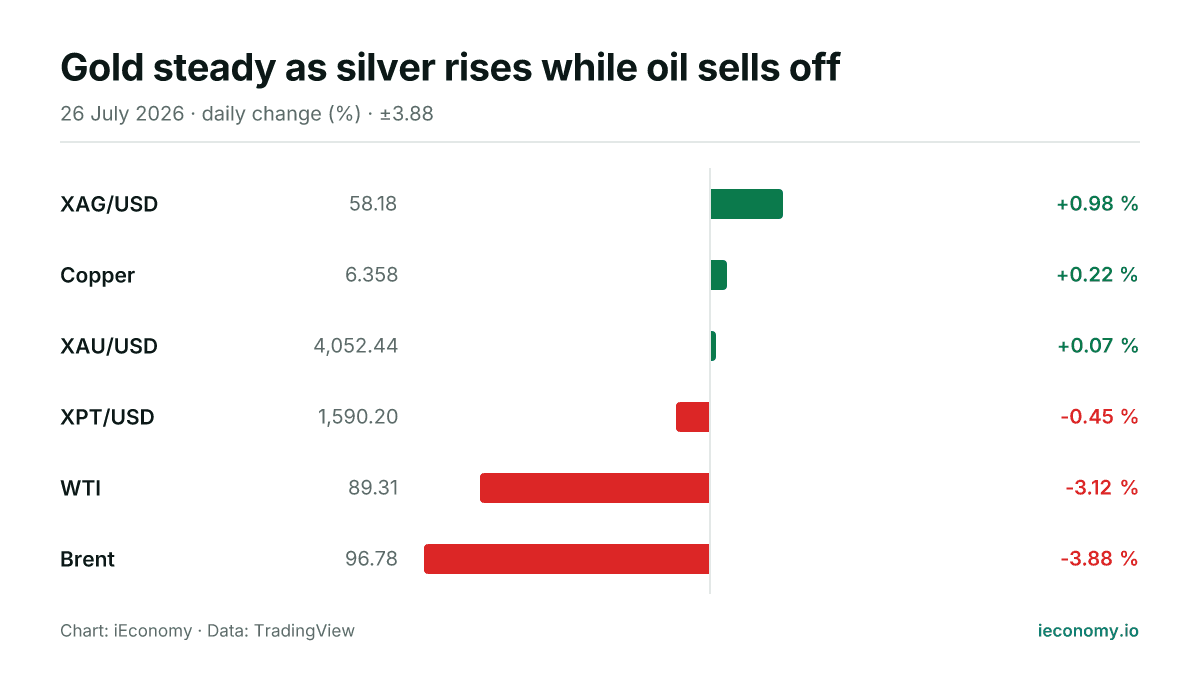
Chart: iEconomy · Data: TradingView
Commodities were mixed on Sunday, with precious metals showing a firmer tone while crude oil dropped sharply. Among the six instruments tracked, three were higher and three were lower or flat, leaving the day defined by a strong split between metals and energy. XAU/USD was nearly unchanged, XAG/USD advanced more clearly, and both WTI and Brent traded lower in percentage terms.
What moved and by how much
Silver led the metals, with XAG/USD up 0.98% to 58.18. Gold was much steadier, as XAU/USD edged 0.07% higher to 4,052.44, a move that points more to consolidation than to a decisive change in direction. In energy, the moves were larger and negative: WTI fell 3.12% to 89.31, while Brent declined 3.88% to 96.78. That gap in scale matters because percentage swings in oil often translate into more noticeable changes in broader commodity sentiment than small day-to-day adjustments in bullion.
| Instrument | Last | Change |
|---|---|---|
| XAG/USD | 58.18 | +0.98 % |
| Copper | 6.358 | +0.22 % |
| XAU/USD | 4,052.44 | +0.07 % |
| XPT/USD | 1,590.20 | -0.45 % |
| WTI | 89.31 | -3.12 % |
| Brent | 96.78 | -3.88 % |
The standouts at both ends
On the positive side, silver was the clear outperformer and the only market in this group to post a gain of close to 1%. Gold’s small rise was enough to keep it above water, but not enough to make it a standout. At the weaker end, Brent was the biggest decliner, followed by WTI, which left energy as the main drag on the day. Platinum also fell, though by a more modest 0.45%, reinforcing the mixed tone outside gold and silver. The day’s ranking therefore separated the metals complex from crude, rather than showing a broad commodity move in one direction.
What a long-term investor should take from one day
A single Sunday’s move is best read as a snapshot of trading mechanics rather than a new trend. In round-the-clock markets, prices can shift on positioning, liquidity and the balance of orders even when there is no obvious new catalyst visible in the data. For long-term investors, the key point is that gold remained close to flat, silver outperformed, and crude oil weakened sharply on the day; that combination can be informative about relative momentum, but it is not enough on its own to justify a strategic conclusion. The prudent lesson is to distinguish between short-term volatility and durable change, especially when the available evidence covers only one trading session.
Sources
Related News

Gold lags as silver, oil and platinum surge
Commodities were broadly higher on Wednesday, with all six tracked instruments in positive territory. Platinum, Brent and silver led gains, while gold advanced more modestly and crude oil also moved sharply higher.
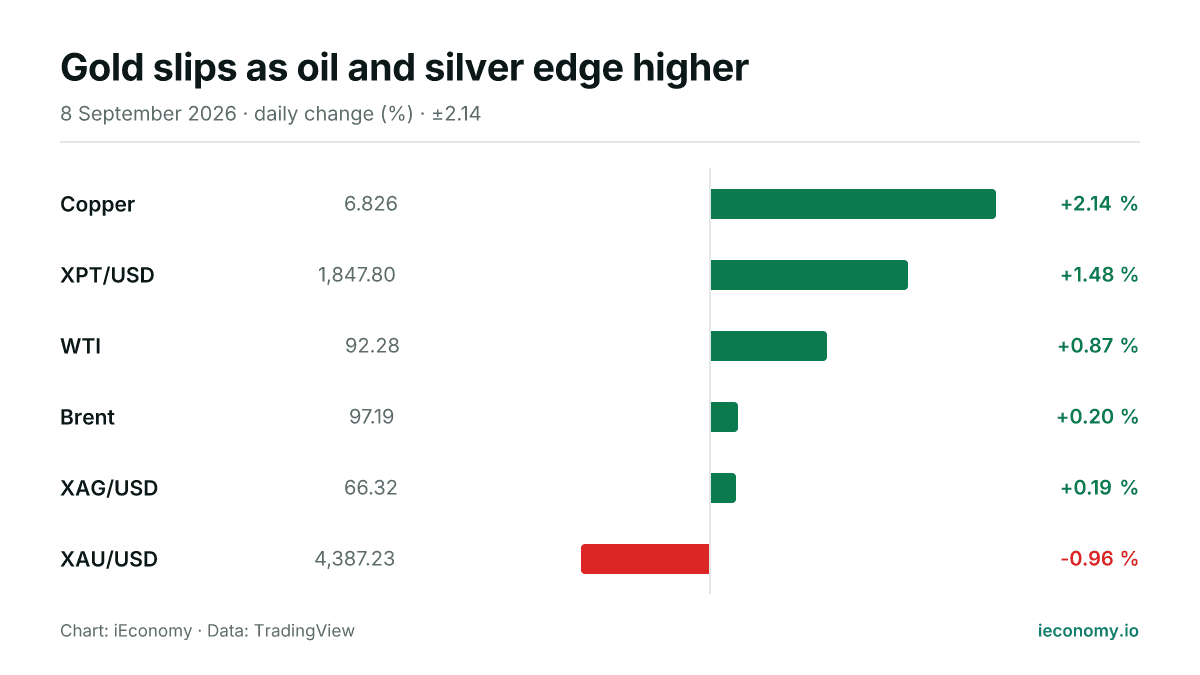
Gold slips as oil and silver edge higher
Gold fell on Tuesday while silver and the main crude benchmarks posted gains, leaving the complex mixed. Copper led the day’s advances, and the spread between the strongest and weakest moves was wide.
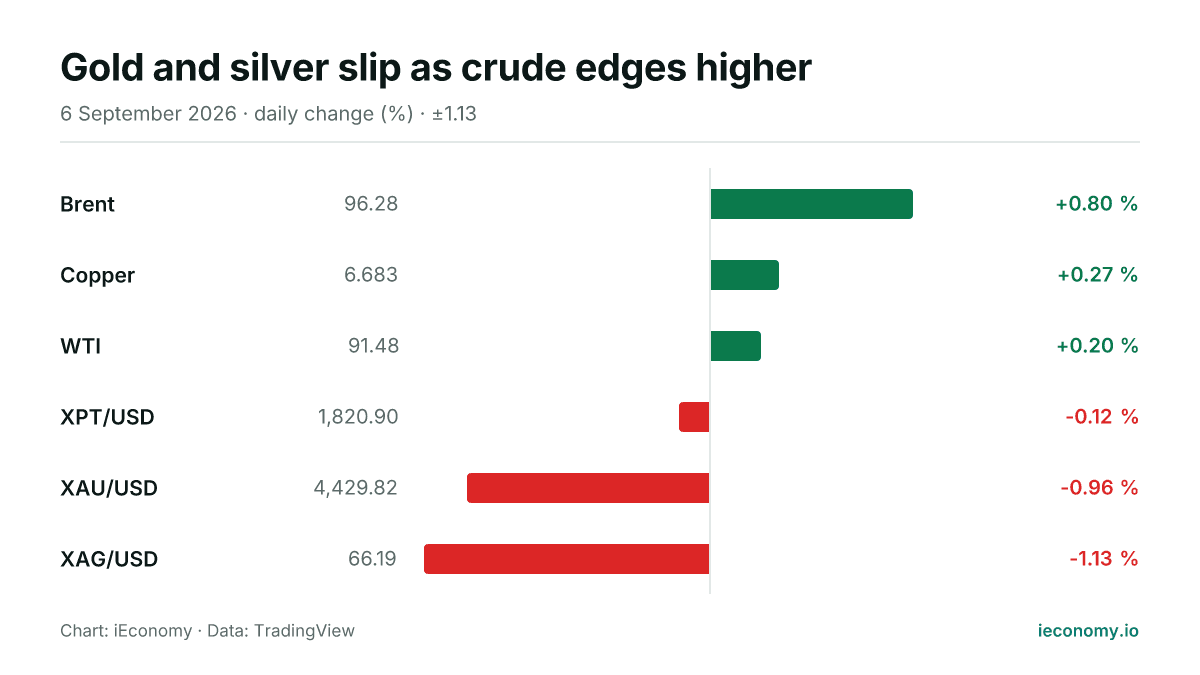
Gold and silver slip as crude edges higher
Gold and silver were weaker on Sunday while Brent and WTI posted gains. The session showed a broad split across the metals and oil complex, with one-day moves that matter for positioning but not for long-term conclusions.
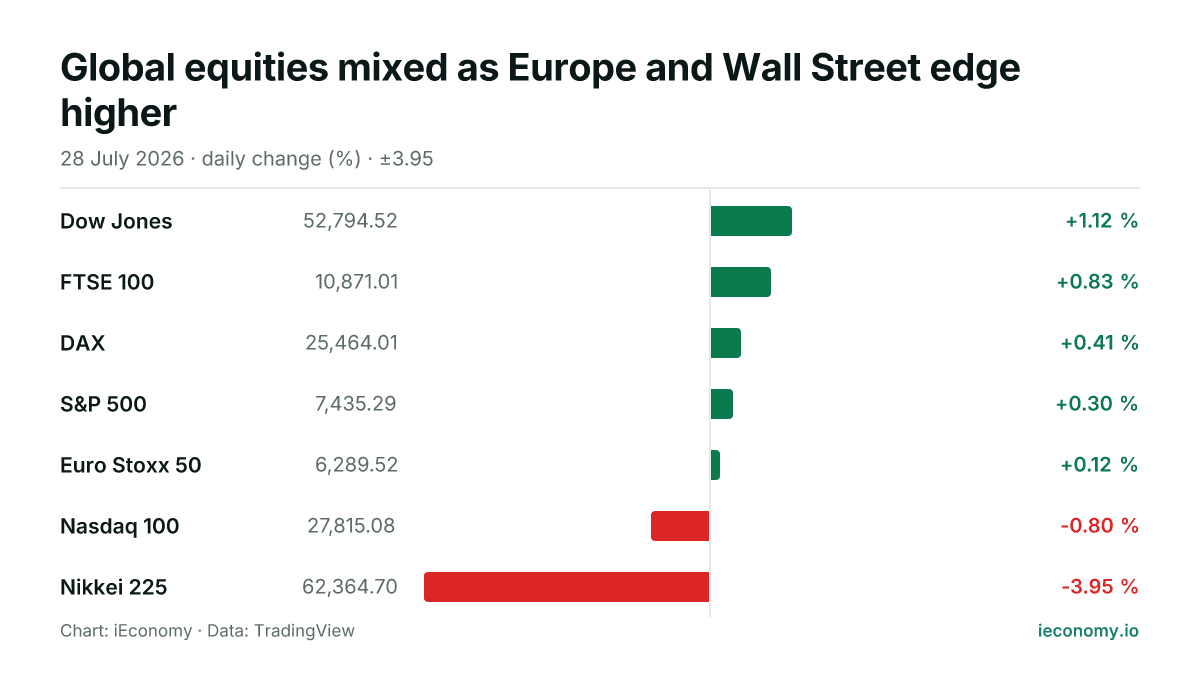
Global equities mixed as Europe and Wall Street edge higher
US and European indices mostly advanced on Tuesday, while Tokyo’s Nikkei 225 fell sharply. The day left a split picture across regions rather than a broad risk-off or risk-on move.

Oil Prices Jump on Mounting Strait of Hormuz Tensions
Oil climbed sharply as clashes between Washington and Tehran intensified, heightening fears of disruption in the Strait of Hormuz, a key route for global crude shipments.
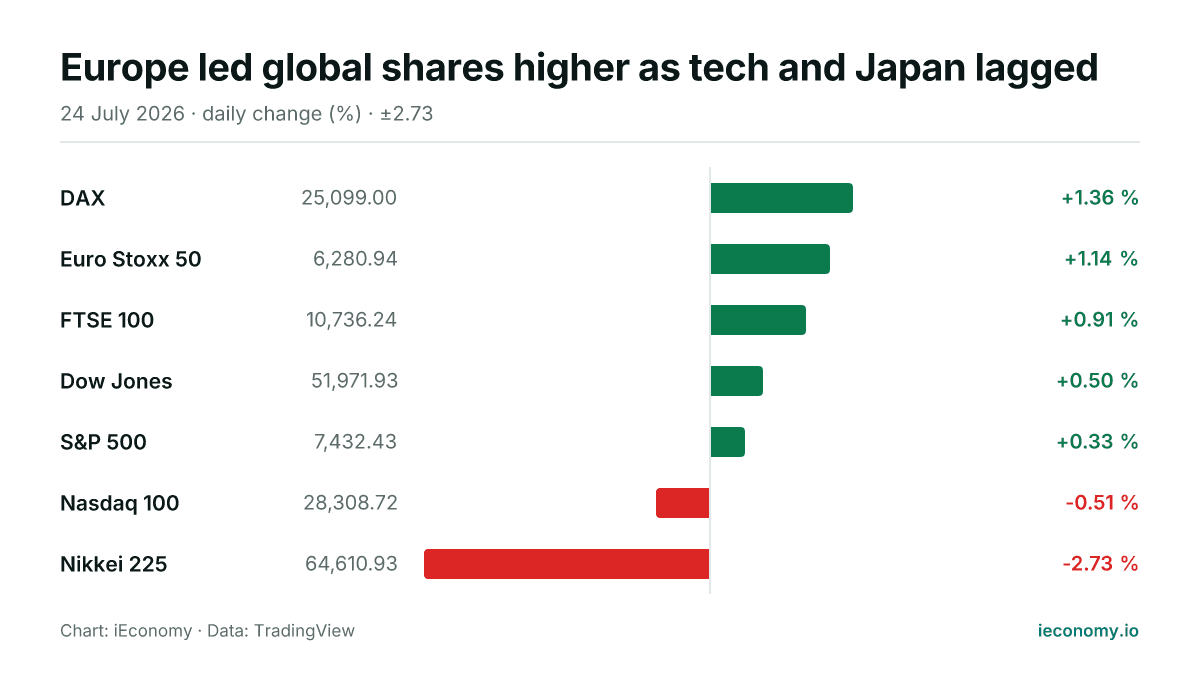
Europe led global shares higher as tech and Japan lagged
European indices outperformed on Friday, while US benchmarks were mixed and Tokyo fell sharply. The day left five of the seven tracked equity gauges higher, with the Nasdaq 100 and Nikkei 225 on the losing side.