Gold lags as silver, oil and platinum surge
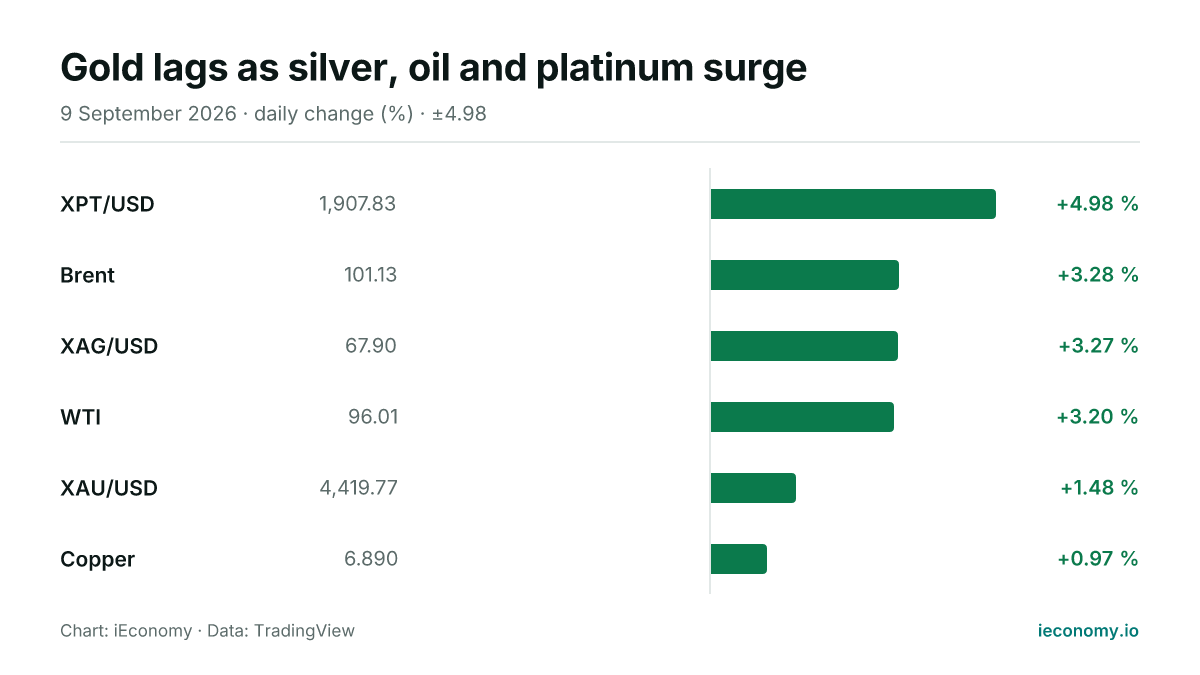
Commodities were broadly higher on Wednesday, with all six tracked instruments in positive territory. Platinum, Brent and silver led gains, while gold advanced more modestly and crude oil also moved sharply higher.

Ibex73 / Wikimedia Commons (CC BY 4.0)
Commodities were firmly higher on Wednesday, with all six tracked contracts and pairs in positive territory. The advance was led by platinum, Brent and silver, while gold posted the smallest rise among the precious metals and crude benchmarks also gained more than 3%.
What moved and by how much
Platinum was the strongest performer at 1,907.83, up 4.98% on the day. Brent followed with a 3.28% rise to 101.13, while silver climbed 3.27% to 67.90. WTI was close behind, advancing 3.20% to 96.01.
| Instrument | Last | Change |
|---|---|---|
| XPT/USD | 1,907.83 | +4.98 % |
| Brent | 101.13 | +3.28 % |
| XAG/USD | 67.90 | +3.27 % |
| WTI | 96.01 | +3.20 % |
| XAU/USD | 4,419.77 | +1.48 % |
| Copper | 6.890 | +0.97 % |
Gold also moved higher, but less decisively than the rest of the complex, rising 1.48% to 4,419.77. Copper added 0.97% to 6.890, leaving every instrument in the basket higher as of the moment of writing.
The standouts at each end
At the top of the day’s leaderboard, platinum’s gain was the largest in both percentage and absolute terms among the instruments provided. That kind of move can matter because it tends to pull attention toward the broader metals space, even when the underlying drivers are not yet clear from price action alone.
At the slower end, copper and gold both rose less than the headline movers. That does not make them weak in absolute terms; it simply means their gains were smaller than those seen in silver, crude oil and platinum.
What a long-term investor should take from one day
One session is a snapshot, not a thesis. A broad, synchronized rise across metals and oil can reflect portfolio rebalancing, shifting risk appetite or mechanical flows, but the prices alone do not prove which force is dominant.
For long-term investors, the key takeaway is that commodity markets can reprice quickly across multiple segments at once. That makes position sizing, diversification and an awareness of volatility more important than reading too much into a single day’s move.
This article is not investment advice and recommends no asset, level or direction; a single session's move is not evidence of a trend. For background see Markets, Bear Market, BIST 100, and for terms the finance glossary.
Frequently asked questions
Which commodity moved the most on Wednesday?
Platinum posted the largest gain in the digest, rising 4.98% to 1,907.83. It outpaced both the oil benchmarks and the other metals, making it the clear leader of the session.
Did gold outperform or underperform the wider complex?
Gold underperformed the strongest movers because its 1.48% gain was smaller than the increases seen in platinum, Brent, silver and WTI. It still finished higher, so the move was positive even if it was comparatively muted.
What should readers infer from all six instruments rising?
The main inference is that the day featured broad-based buying rather than a move confined to one corner of the commodity market. That said, price action alone does not identify the cause, so it is safest to treat the pattern as a market snapshot and not a forecast.
Sources
Related News
Gold and silver slip as crude edges higher
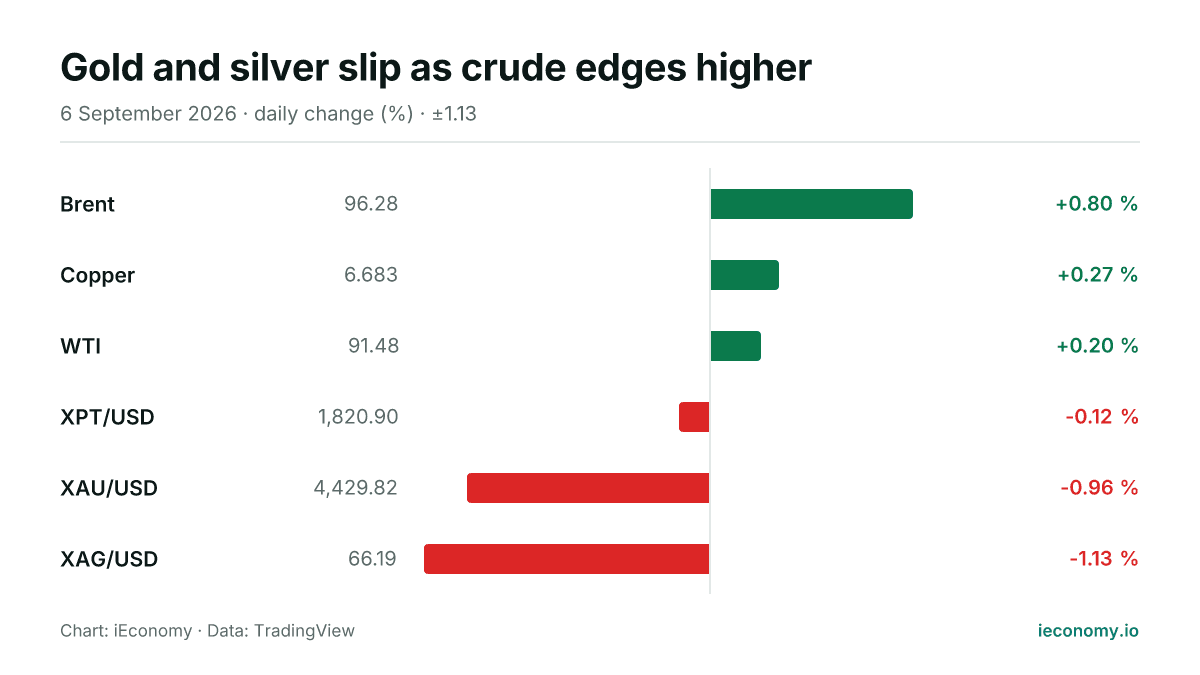
Gold and silver were weaker on Sunday while Brent and WTI posted gains. The session showed a broad split across the metals and oil complex, with one-day moves that matter for positioning but not for long-term conclusions.
Gold, silver and oil slip as copper edges higher
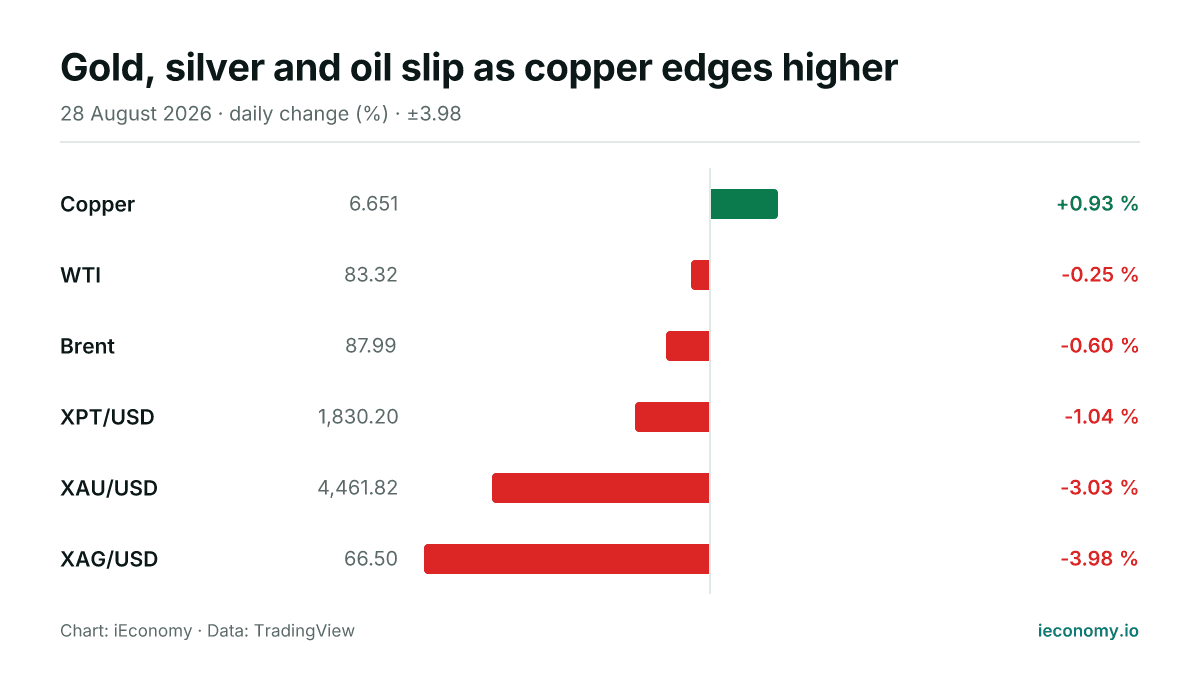
On Friday, gold and silver led losses in the tracked commodity set while crude oil also eased and copper was the only gainer. The move left five of six instruments lower or flat, with the heaviest declines in precious metals.
Gold slips as oil and silver edge higher
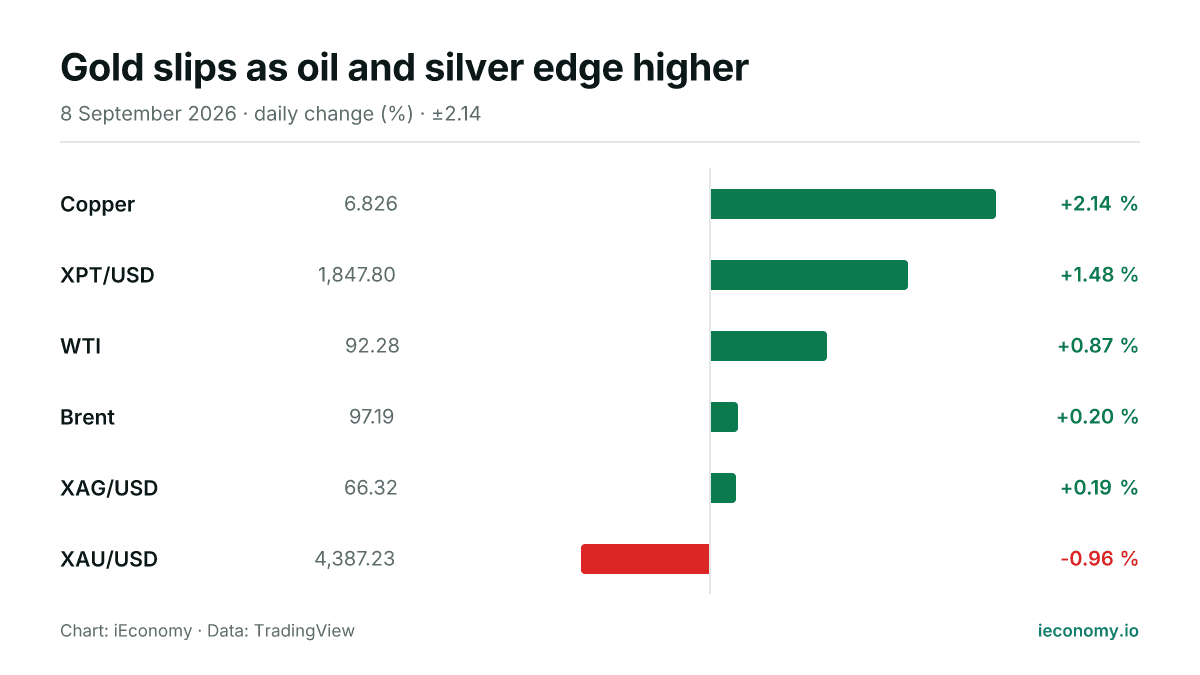
Gold fell on Tuesday while silver and the main crude benchmarks posted gains, leaving the complex mixed. Copper led the day’s advances, and the spread between the strongest and weakest moves was wide.
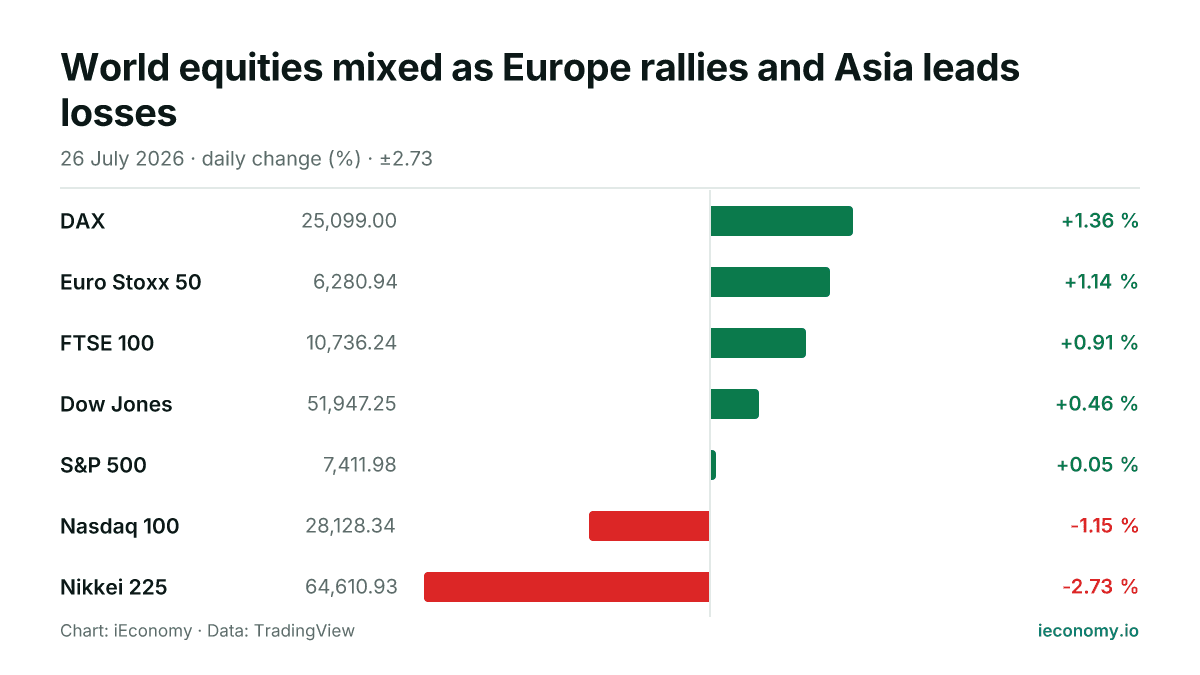
World equities mixed as Europe rallies and Asia leads losses
European benchmarks advanced while US indexes were broadly firmer and Asia finished lower, with the Nasdaq 100 and Nikkei 225 lagging. The day left 5 of 7 tracked indices higher, but the dispersion was wide.
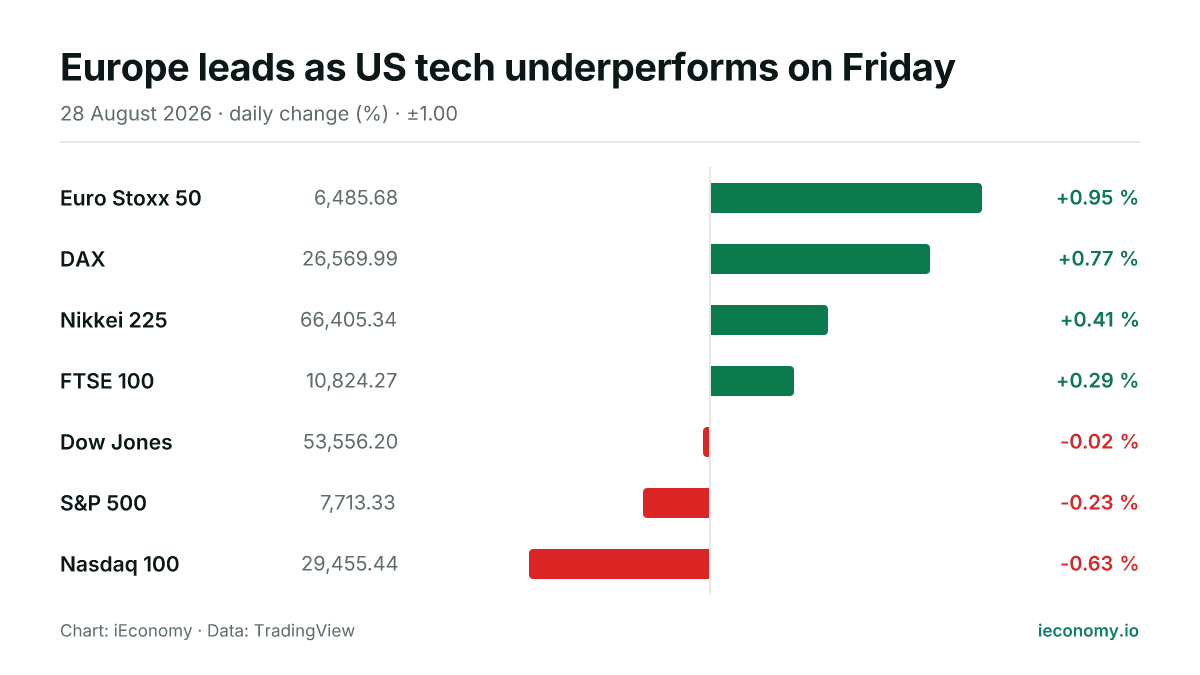
Europe leads as US tech underperforms on Friday
European and Asian benchmarks advanced on Friday, while the main US averages were mixed to weaker. The day’s moves were modest in the US and broader in Europe, leaving regional performance uneven.
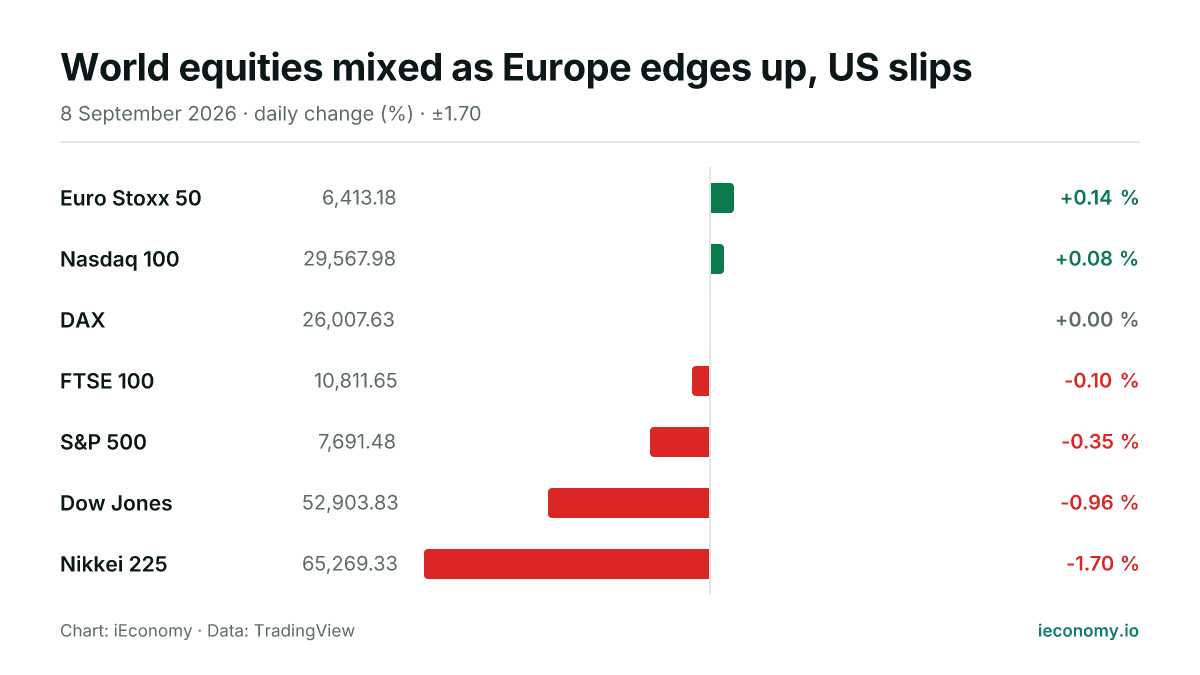
World equities mixed as Europe edges up, US slips
European shares were modestly firmer, US indices were mixed to lower, and Tokyo lagged. The day’s moves were small in much of Europe but sharper in the US and Japan, showing uneven risk appetite.